| Param | Original file | Final file |
|---|---|---|
| Filename | modeM0/AS1A11_060T01_9000004808_33587cztM0_level2.evt | modeM0/AS1A11_060T01_9000004808_33587cztM0_level2_quad_clean.evt |
| Size (bytes) | 647,732,160 | 66,467,520 |
| Size | 617.7 MB | 63.4 MB |
| Events in quadrant A | 6,365,497 | 401,107 |
| Events in quadrant B | 4,143,395 | 391,322 |
| Events in quadrant C | 3,892,645 | 404,707 |
| Events in quadrant D | 4,802,741 | 388,912 |
| Mode M0 | |||
|---|---|---|---|
| Quadrant | BADHDUFLAG | Total packets | Discarded packets |
| A | 0 | 23317 | 3 |
| B | 0 | 16252 | 2 |
| C | 0 | 15216 | 2 |
| D | 0 | 18504 | 2 |
| Mode M9 | |||
|---|---|---|---|
| Quadrant | BADHDUFLAG | Total packets | Discarded packets |
| A | 0 | 30 | 0 |
| B | 0 | 30 | 0 |
| C | 0 | 30 | 0 |
| D | 0 | 30 | 0 |
| Mode SS | |||
|---|---|---|---|
| Quadrant | BADHDUFLAG | Total packets | Discarded packets |
| A | 0 | 126 | 0 |
| B | 0 | 126 | 0 |
| C | 0 | 126 | 0 |
| D | 0 | 126 | 0 |
| Quadrant | Total seconds | Saturated seconds | Saturation percentage |
|---|---|---|---|
| A | 6105 | 782 | 12.809173% |
| B | 6105 | 485 | 7.944308% |
| C | 6105 | 116 | 1.900082% |
| D | 6105 | 203 | 3.325143% |
Noise dominated data is calculated using 1-second bins in cleaned event files. If a bin has >2000 counts, and if more than 50% of those come from <1% of pixels, then it is considered to be noise-dominated and hence unusable.
| Quadrant | # 1 sec bins | Bins with >0 counts | Bins with >2000 counts | High rate bins dominated by noise | Noise dominated (total time) | Noise dominated (detector-on time) | Marked lightcurve |
|---|---|---|---|---|---|---|---|
| A | 9121 | 6107 | 603 | 603 | 6.61% | 9.87% | 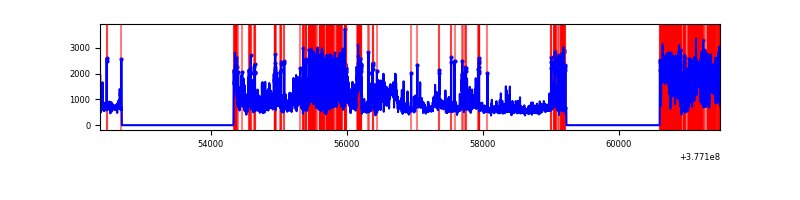 |
| B | 9121 | 6106 | 358 | 358 | 3.93% | 5.86% | 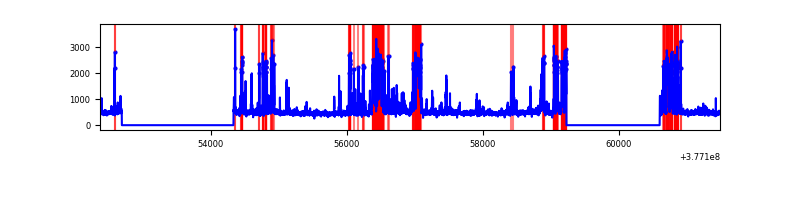 |
| C | 9121 | 6107 | 105 | 105 | 1.15% | 1.72% | 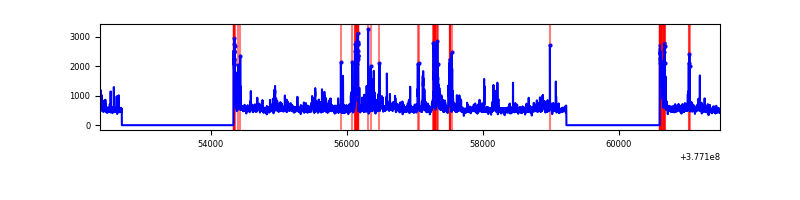 |
| D | 9120 | 6106 | 177 | 177 | 1.94% | 2.90% | 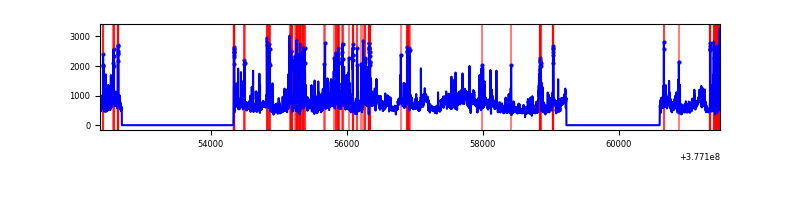 |
Top three noisy pixels from each quadrant. If the there are fewer than three noisy pixels in the level2.evt file, extra rows are filled as -1
| Pixel properties | Quadrant properties | ||||||
|---|---|---|---|---|---|---|---|
| Quadrant | DetID | PixID | Counts | Sigma | Mean | Median | Sigma |
| A | 15 | 169 | 3665663 | 26593.82 | 685 | 671 | 137.8 |
| A | 12 | 16 | 36095 | 257.04 | 685 | 671 | 137.8 |
| A | 12 | 194 | 10923 | 74.39 | 685 | 671 | 137.8 |
| B | 5 | 172 | 1191987 | 8943.61 | 686 | 668 | 133.2 |
| B | 0 | 190 | 118286 | 882.99 | 686 | 668 | 133.2 |
| B | 4 | 251 | 42507 | 314.1 | 686 | 668 | 133.2 |
| C | 3 | 233 | 723433 | 4509.01 | 691 | 696 | 160.3 |
| C | 15 | 214 | 259023 | 1611.65 | 691 | 696 | 160.3 |
| C | 0 | 10 | 202913 | 1261.59 | 691 | 696 | 160.3 |
| D | 8 | 195 | 879872 | 5155.83 | 684 | 663 | 170.5 |
| D | 13 | 249 | 546378 | 3200.16 | 684 | 663 | 170.5 |
| D | 1 | 52 | 255442 | 1494.07 | 684 | 663 | 170.5 |
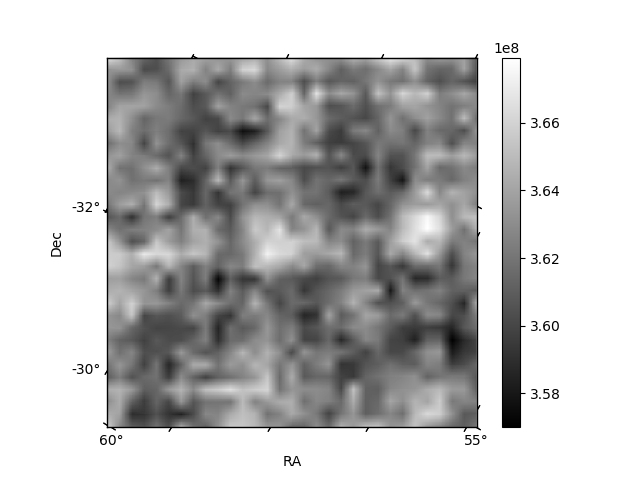
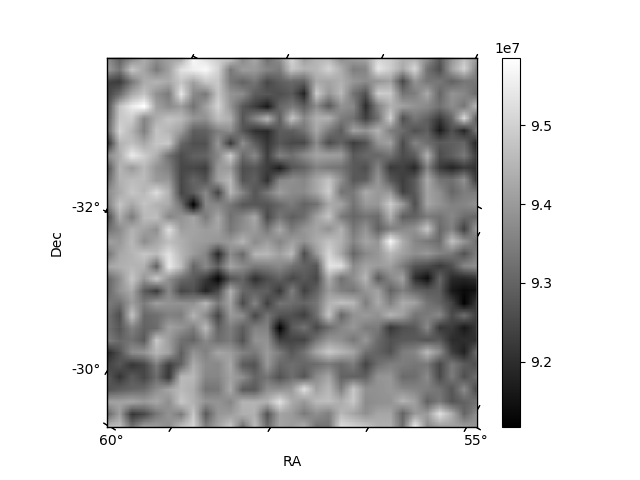
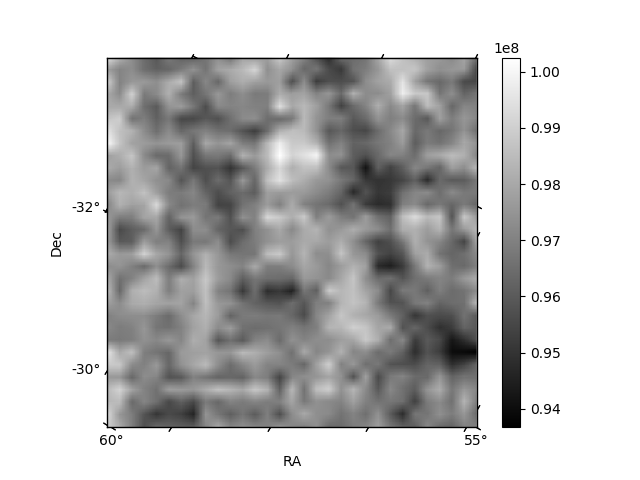
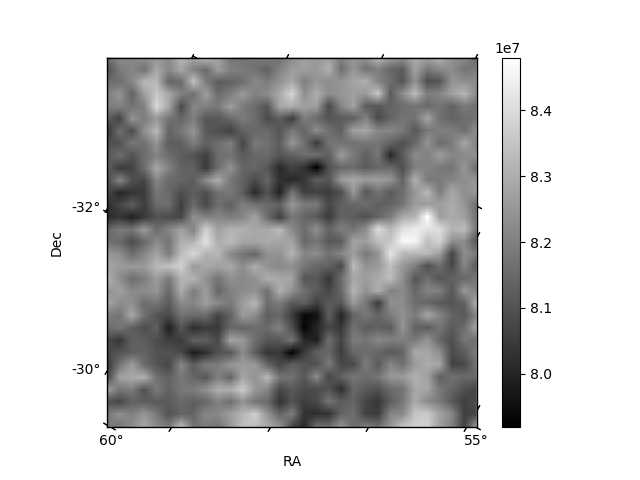
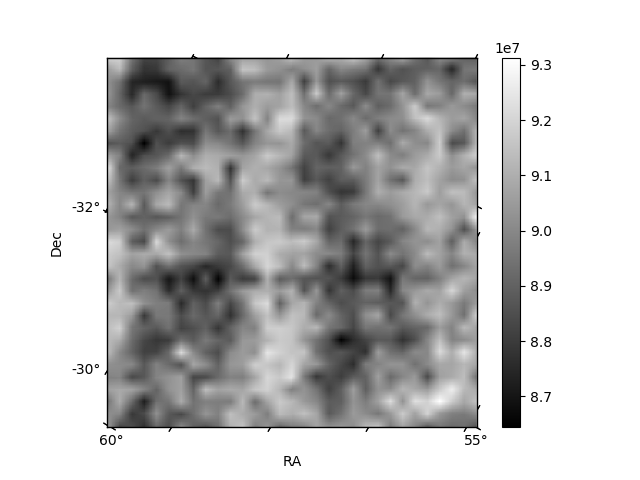
Histogram calculated using DETX and DETY for each event in the final _common_clean file
| Quadrant A | 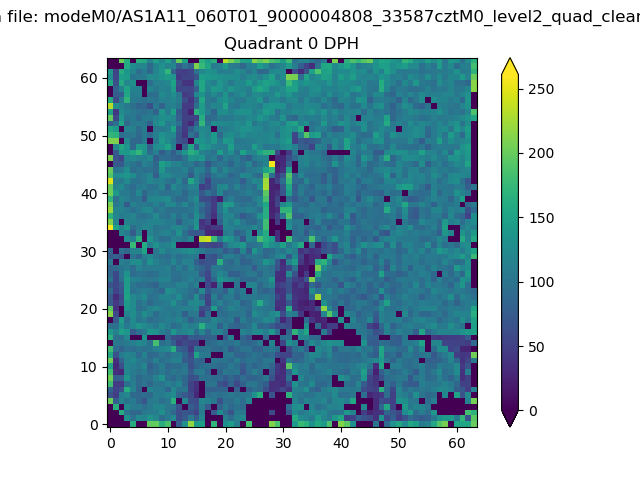 |
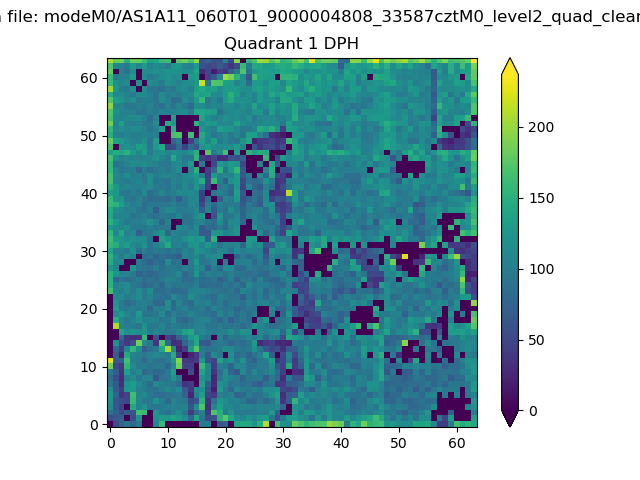 |
Quadrant B |
|---|---|---|---|
| Quadrant D | 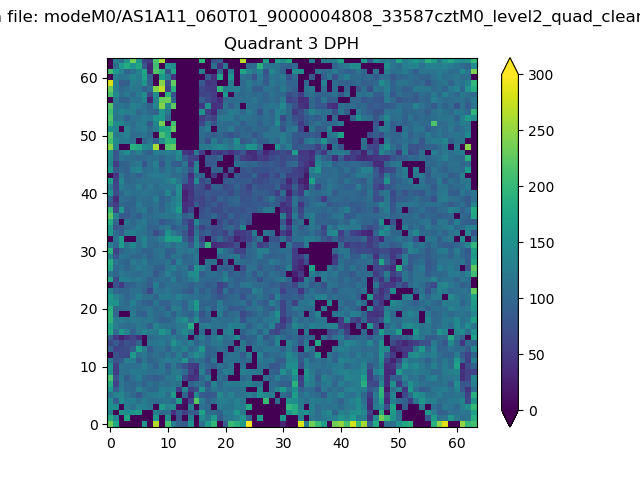 |
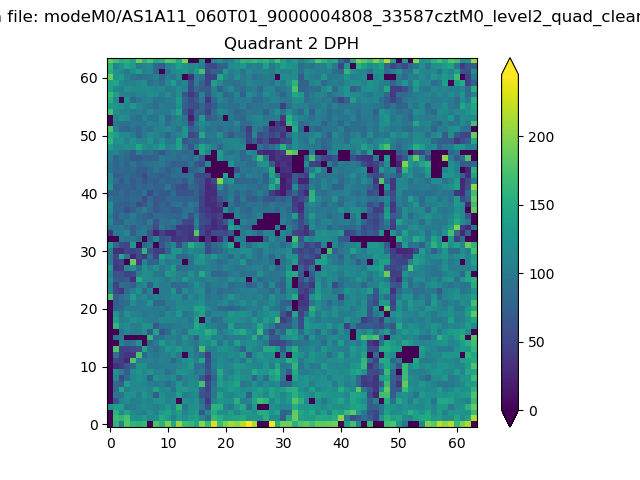 |
Quadrant C |
| Plot type | Count rate plots | Images |
|---|---|---|
| Comparison with Poisson distribution Blue bars denote a histogram of data divided into 1 sec bins. Red curve is a Poisson curve with rate = median count rate of data. |
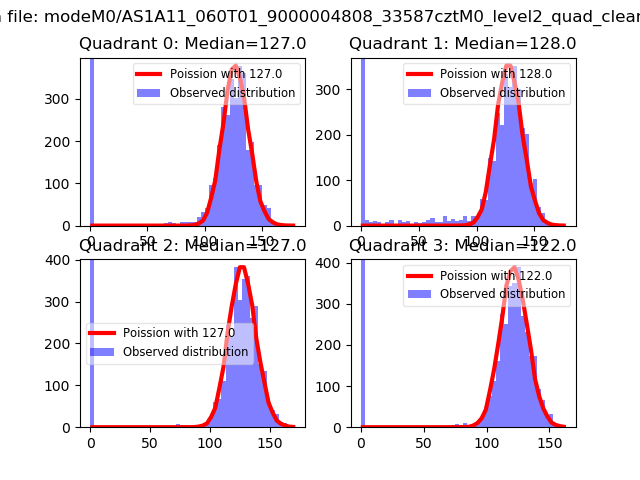 |
 |
| Quadrant-wise count rates Data is divided into 100 sec bins |
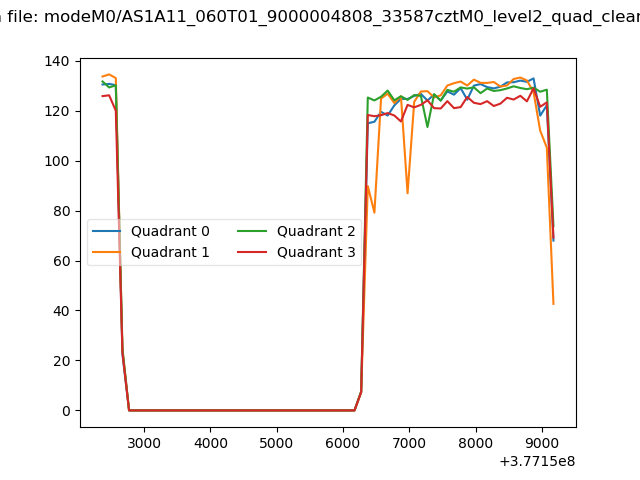 |
|
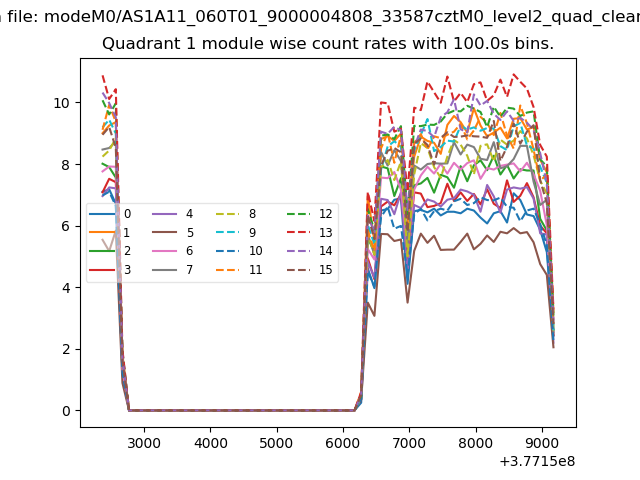
| Module-wise count rates for Quadrant A Data is divided into 100 sec bins |
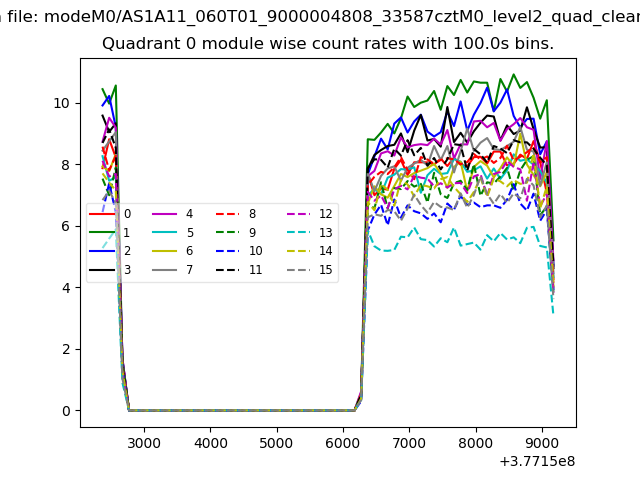 |
 |
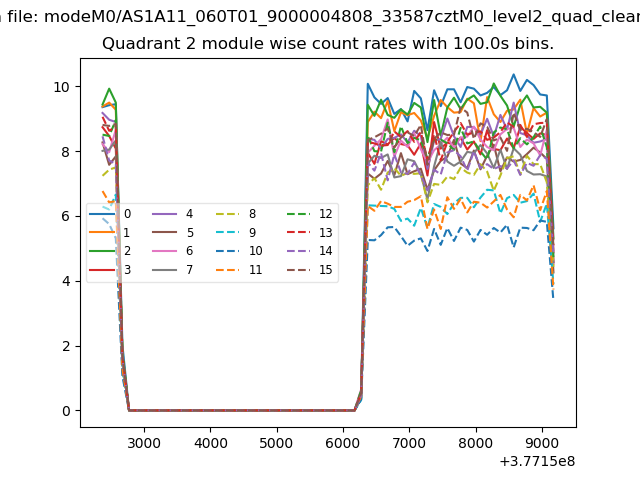
| Module-wise count rates for Quadrant B Data is divided into 100 sec bins |
 |
 |
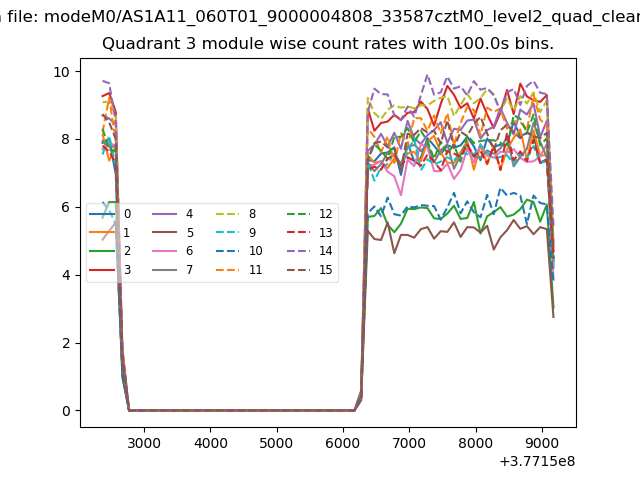
| Module-wise count rates for Quadrant C Data is divided into 100 sec bins |
 |
 |
| Module-wise count rates for Quadrant D Data is divided into 100 sec bins |
 |
 |
| Parameter | Plot |
|---|---|
| CZT HV Monitor | 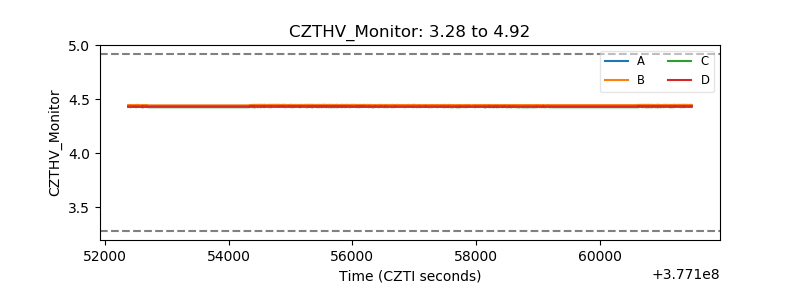 |
| D_VDD | 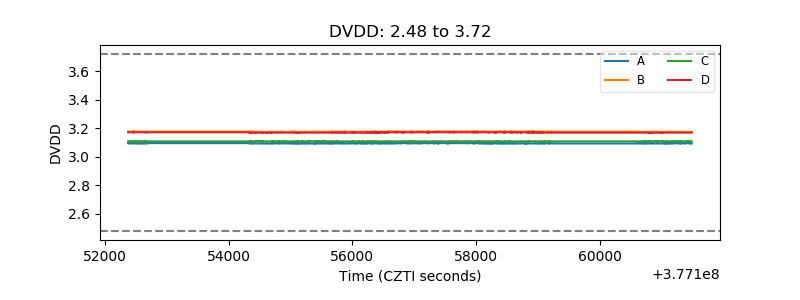 |
| Temperature 1 | 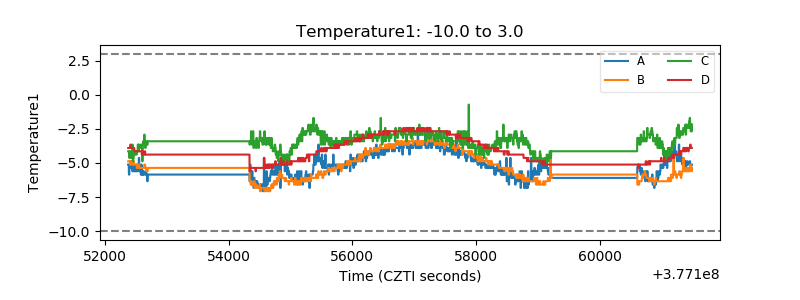 |
| Veto HV Monitor | 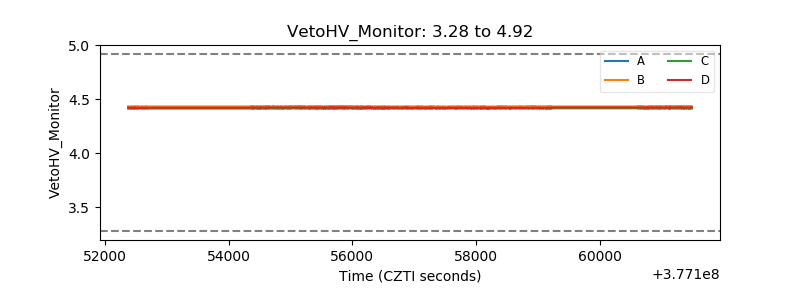 |
| Veto LLD | 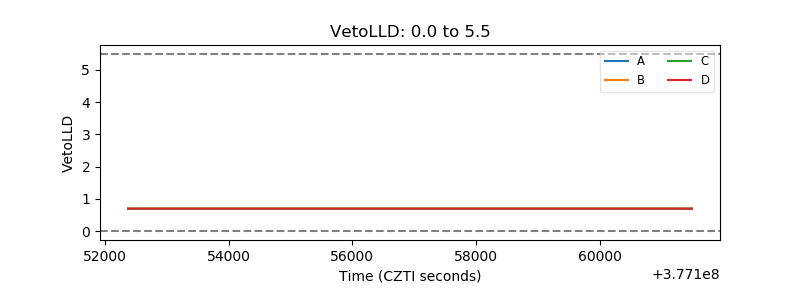 |
| Alpha Counter | 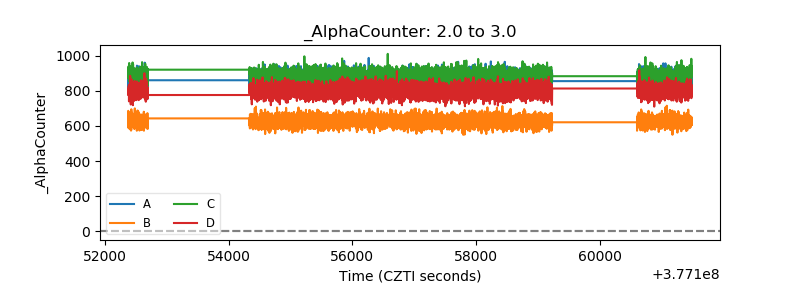 |
| _CPM_Rate | 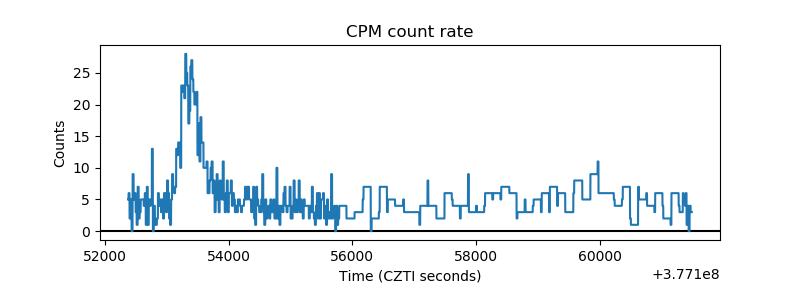 |
| CZT Counter | 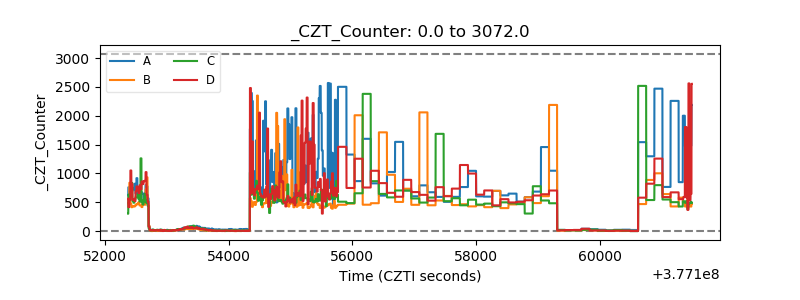 |
| +2.5 Volts monitor |  |
| +5 Volts monitor |  |
| _ROLL_ROT | 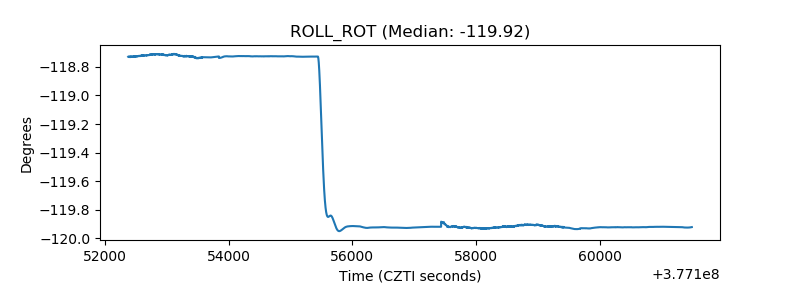 |
| _Roll_DEC |  |
| _Roll_RA | 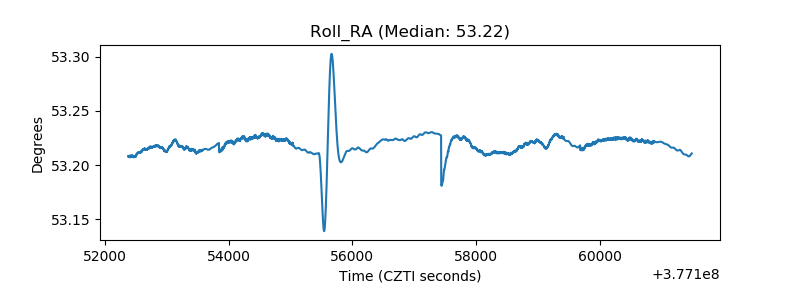 |
| Veto Counter | 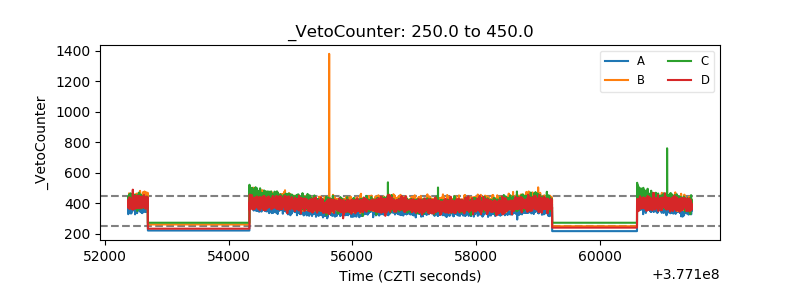 |