| Param | Original file | Final file |
|---|---|---|
| Filename | modeM0/AS1A11_060T01_9000004808_33588cztM0_level2.evt | modeM0/AS1A11_060T01_9000004808_33588cztM0_level2_quad_clean.evt |
| Size (bytes) | 656,830,080 | 70,470,720 |
| Size | 626.4 MB | 67.2 MB |
| Events in quadrant A | 7,187,479 | 426,584 |
| Events in quadrant B | 4,355,795 | 422,929 |
| Events in quadrant C | 3,644,996 | 435,475 |
| Events in quadrant D | 4,291,011 | 421,480 |
| Mode M0 | |||
|---|---|---|---|
| Quadrant | BADHDUFLAG | Total packets | Discarded packets |
| A | 0 | 25785 | 3 |
| B | 0 | 16800 | 2 |
| C | 0 | 14362 | 2 |
| D | 0 | 16887 | 2 |
| Mode M9 | |||
|---|---|---|---|
| Quadrant | BADHDUFLAG | Total packets | Discarded packets |
| A | 0 | 26 | 0 |
| B | 0 | 26 | 0 |
| C | 0 | 26 | 0 |
| D | 0 | 26 | 0 |
| Mode SS | |||
|---|---|---|---|
| Quadrant | BADHDUFLAG | Total packets | Discarded packets |
| A | 0 | 128 | 0 |
| B | 0 | 128 | 0 |
| C | 0 | 128 | 0 |
| D | 0 | 128 | 0 |
| Quadrant | Total seconds | Saturated seconds | Saturation percentage |
|---|---|---|---|
| A | 6111 | 736 | 12.043855% |
| B | 6111 | 498 | 8.149239% |
| C | 6111 | 97 | 1.587302% |
| D | 6111 | 173 | 2.830961% |
Noise dominated data is calculated using 1-second bins in cleaned event files. If a bin has >2000 counts, and if more than 50% of those come from <1% of pixels, then it is considered to be noise-dominated and hence unusable.
| Quadrant | # 1 sec bins | Bins with >0 counts | Bins with >2000 counts | High rate bins dominated by noise | Noise dominated (total time) | Noise dominated (detector-on time) | Marked lightcurve |
|---|---|---|---|---|---|---|---|
| A | 8797 | 6113 | 556 | 556 | 6.32% | 9.10% | 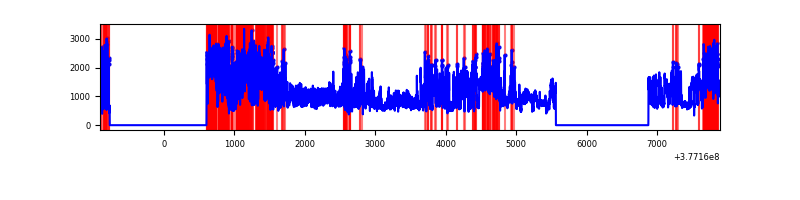 |
| B | 8797 | 6112 | 371 | 371 | 4.22% | 6.07% | 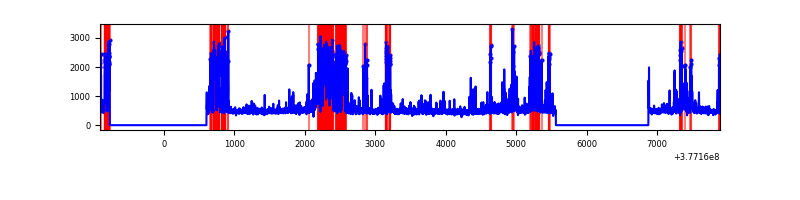 |
| C | 8797 | 6113 | 82 | 82 | 0.93% | 1.34% | 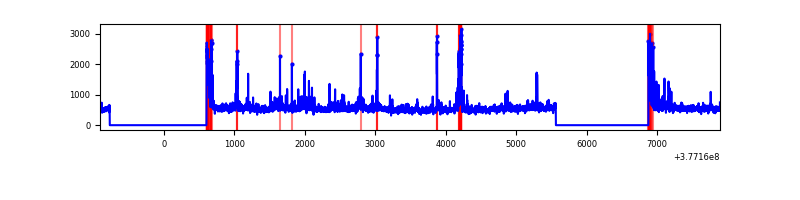 |
| D | 8796 | 6112 | 152 | 152 | 1.73% | 2.49% | 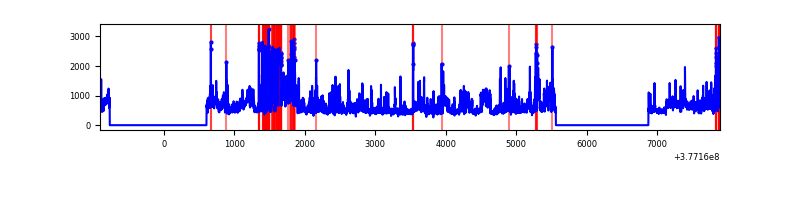 |
Top three noisy pixels from each quadrant. If the there are fewer than three noisy pixels in the level2.evt file, extra rows are filled as -1
| Pixel properties | Quadrant properties | ||||||
|---|---|---|---|---|---|---|---|
| Quadrant | DetID | PixID | Counts | Sigma | Mean | Median | Sigma |
| A | 15 | 169 | 4517361 | 32680.07 | 687 | 673 | 138.2 |
| A | 13 | 254 | 10326 | 69.84 | 687 | 673 | 138.2 |
| A | 3 | 137 | 7046 | 46.11 | 687 | 673 | 138.2 |
| B | 5 | 172 | 739210 | 5575.58 | 687 | 669 | 132.5 |
| B | 5 | 255 | 347823 | 2620.82 | 687 | 669 | 132.5 |
| B | 15 | 222 | 296372 | 2232.4 | 687 | 669 | 132.5 |
| C | 3 | 233 | 447831 | 2766.23 | 691 | 698 | 161.6 |
| C | 15 | 214 | 259831 | 1603.15 | 691 | 698 | 161.6 |
| C | 0 | 10 | 217612 | 1341.96 | 691 | 698 | 161.6 |
| D | 8 | 195 | 745684 | 4484.4 | 684 | 666 | 166.1 |
| D | 13 | 249 | 367758 | 2209.59 | 684 | 666 | 166.1 |
| D | 7 | 80 | 175095 | 1049.92 | 684 | 666 | 166.1 |
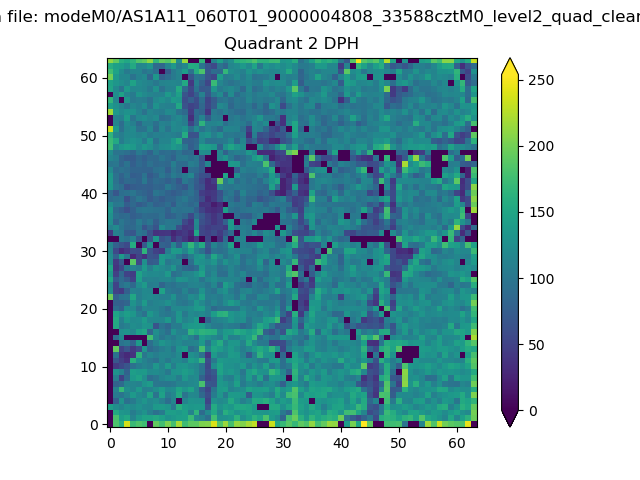
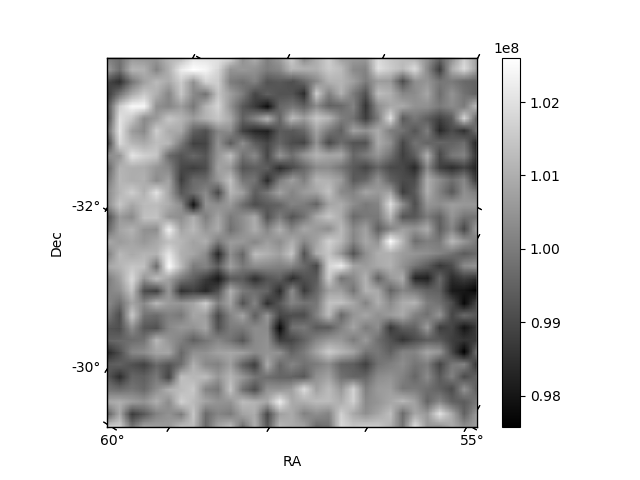
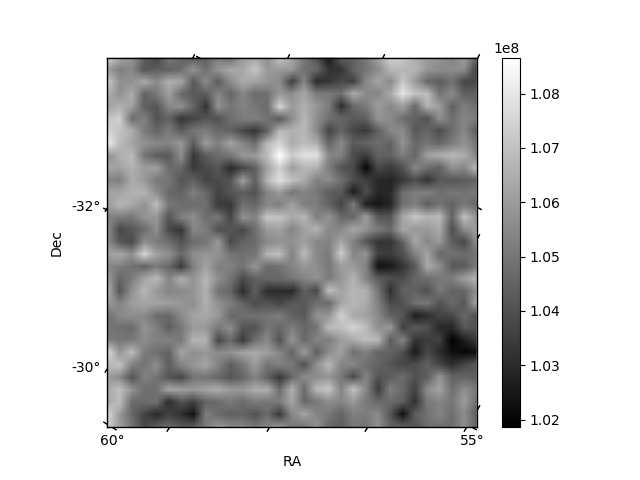
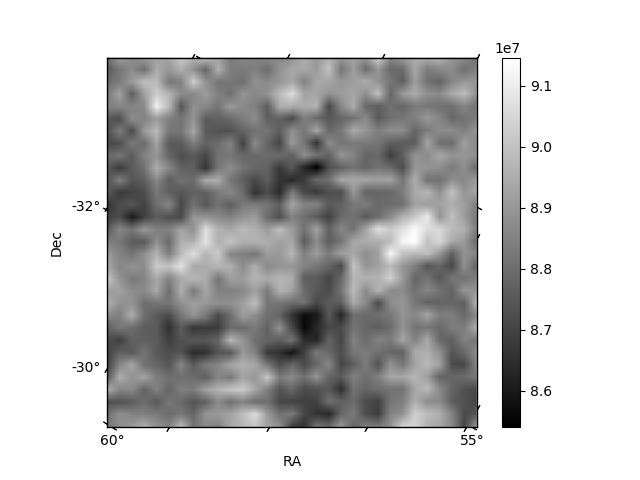
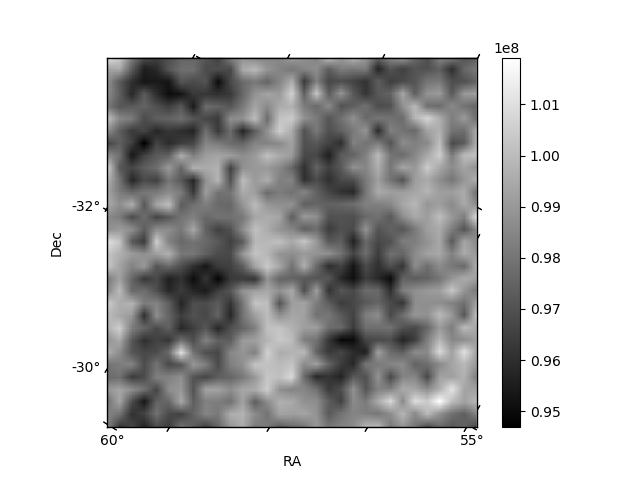
Histogram calculated using DETX and DETY for each event in the final _common_clean file
| Quadrant A | 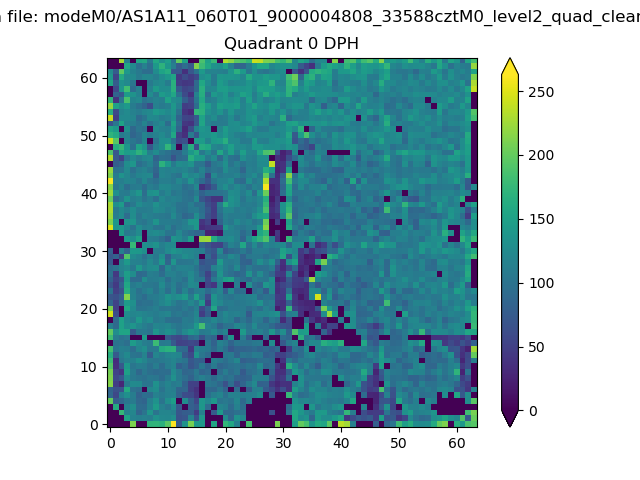 |
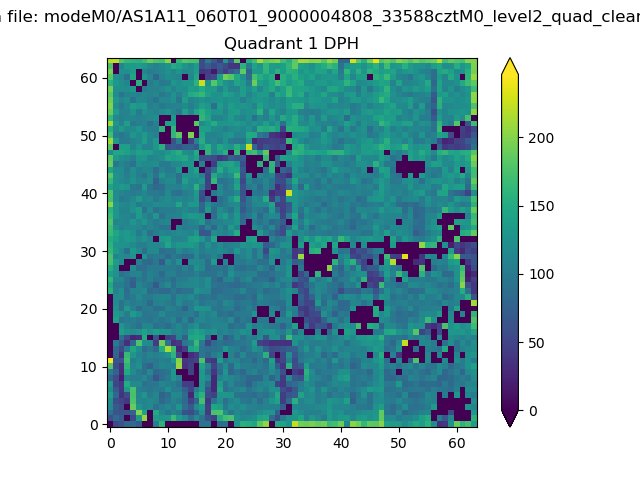 |
Quadrant B |
|---|---|---|---|
| Quadrant D | 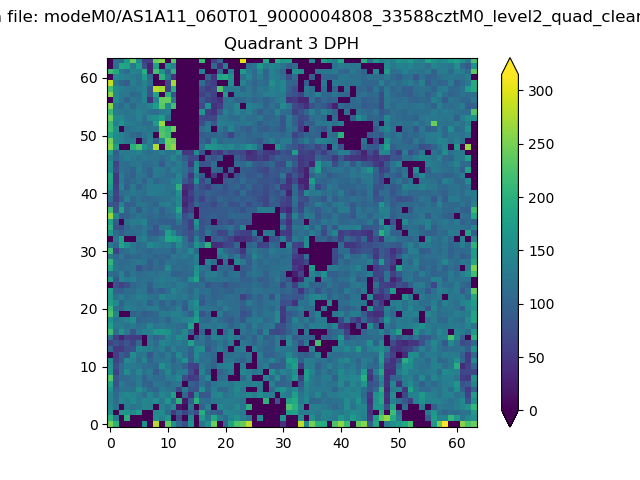 |
 |
Quadrant C |
| Plot type | Count rate plots | Images |
|---|---|---|
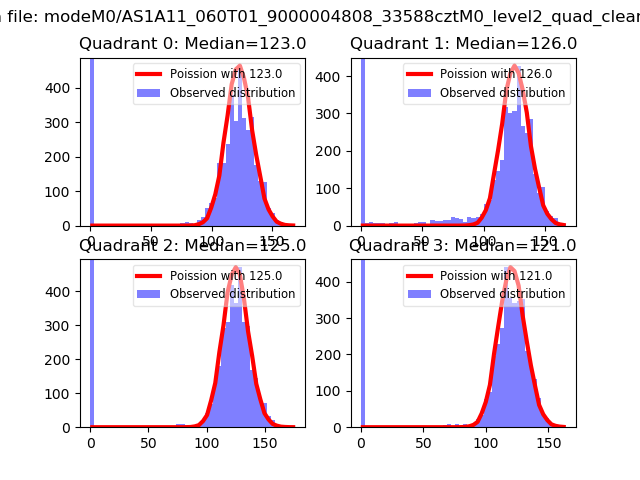
| Comparison with Poisson distribution Blue bars denote a histogram of data divided into 1 sec bins. Red curve is a Poisson curve with rate = median count rate of data. |
 |
 |
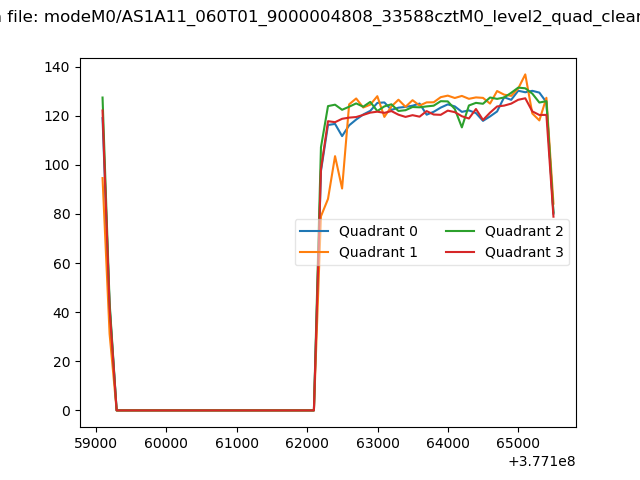
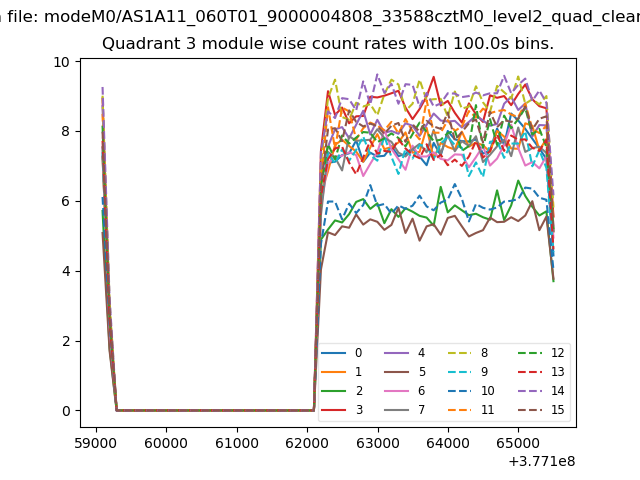
| Quadrant-wise count rates Data is divided into 100 sec bins |
 |
|
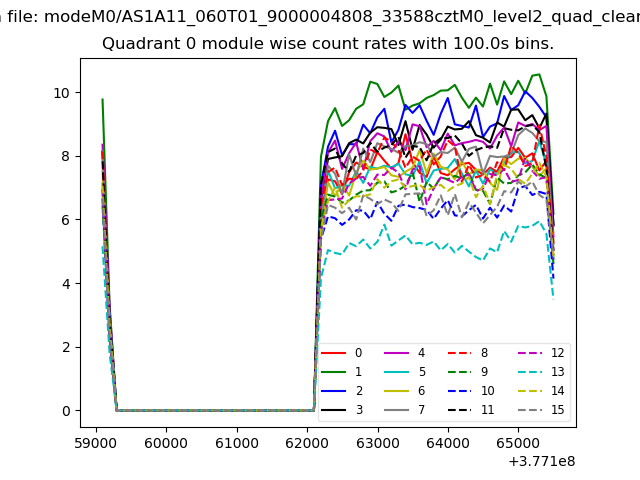
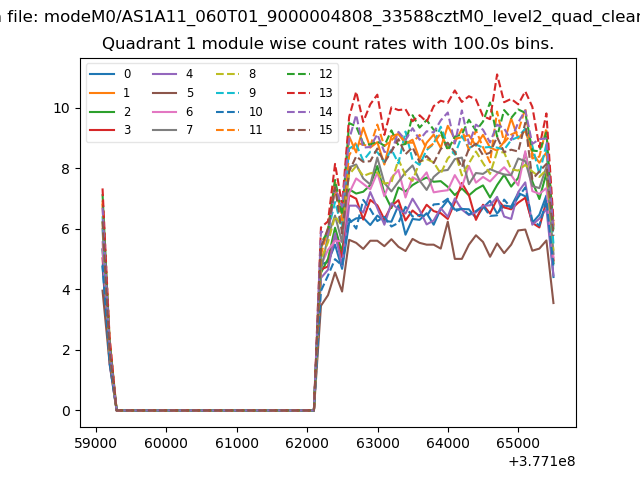
| Module-wise count rates for Quadrant A Data is divided into 100 sec bins |
 |
 |
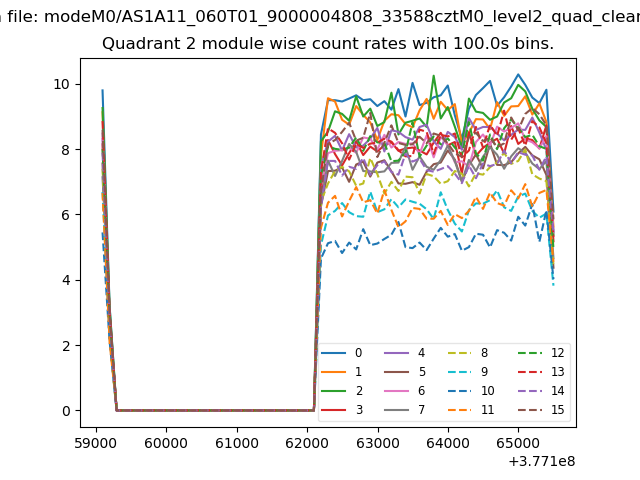
| Module-wise count rates for Quadrant B Data is divided into 100 sec bins |
 |
 |
| Module-wise count rates for Quadrant C Data is divided into 100 sec bins |
 |
 |
| Module-wise count rates for Quadrant D Data is divided into 100 sec bins |
 |
 |
| Parameter | Plot |
|---|---|
| CZT HV Monitor | 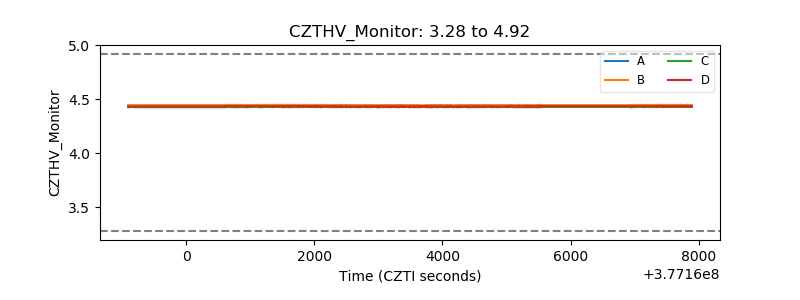 |
| D_VDD | 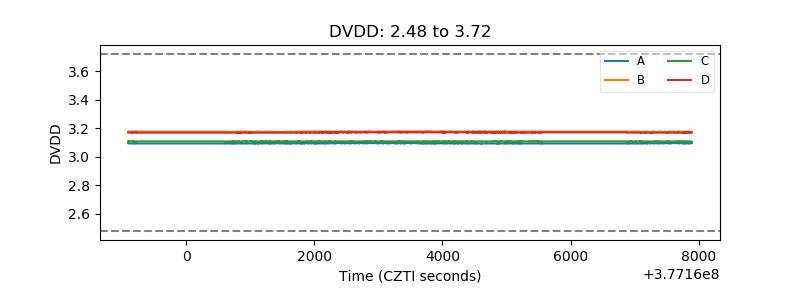 |
| Temperature 1 | 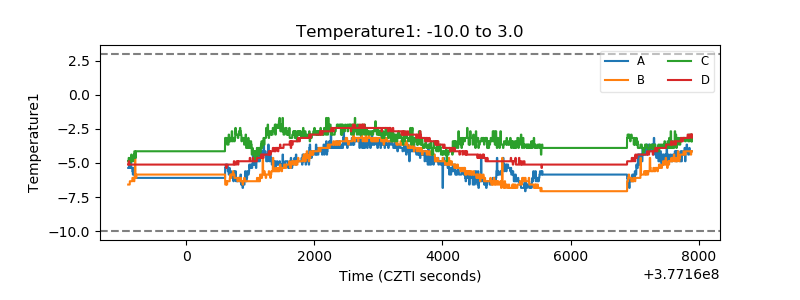 |
| Veto HV Monitor | 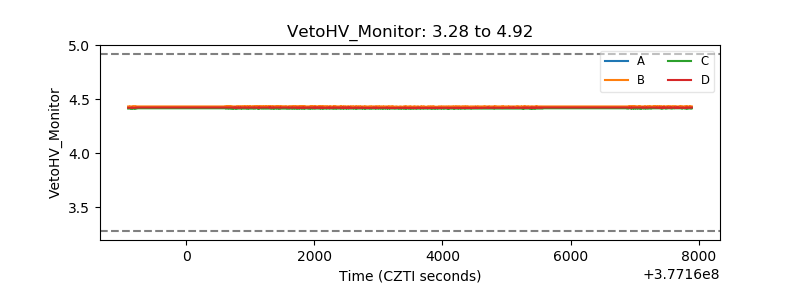 |
| Veto LLD | 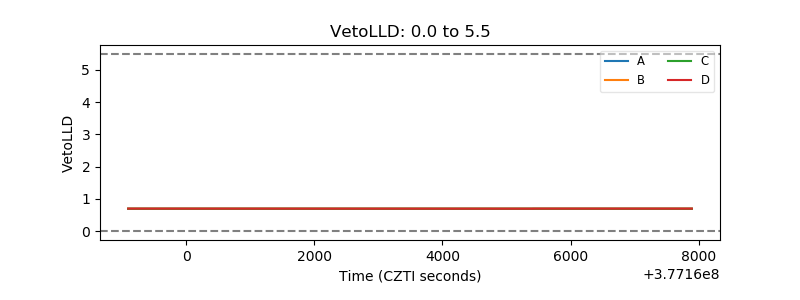 |
| Alpha Counter | 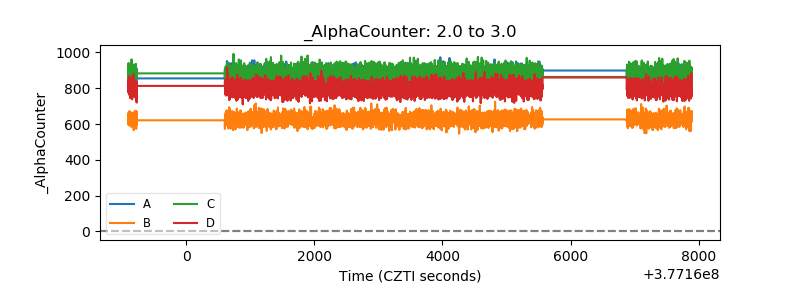 |
| _CPM_Rate | 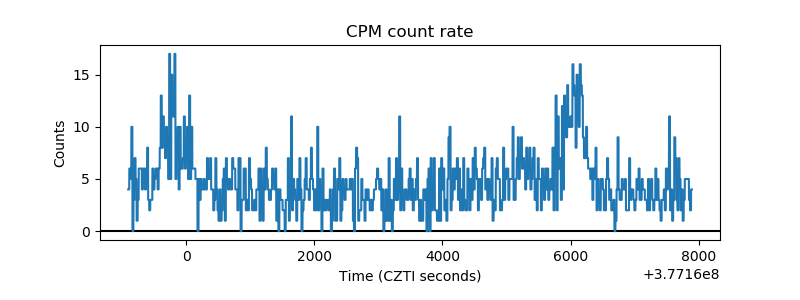 |
| CZT Counter | 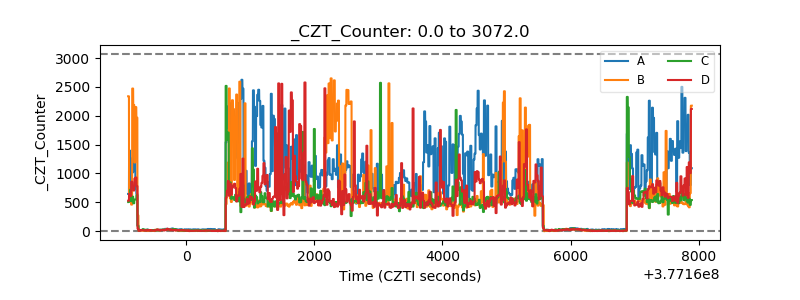 |
| +2.5 Volts monitor |  |
| +5 Volts monitor |  |
| _ROLL_ROT | 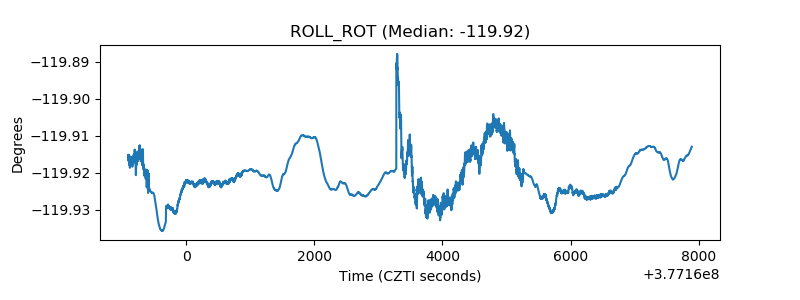 |
| _Roll_DEC | 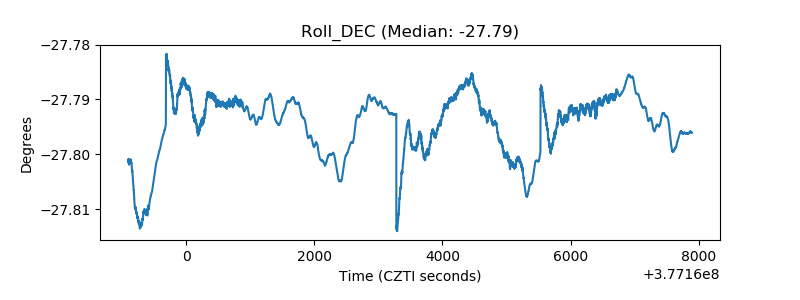 |
| _Roll_RA | 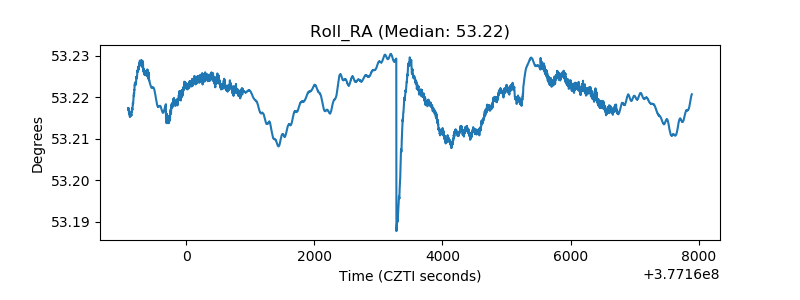 |
| Veto Counter | 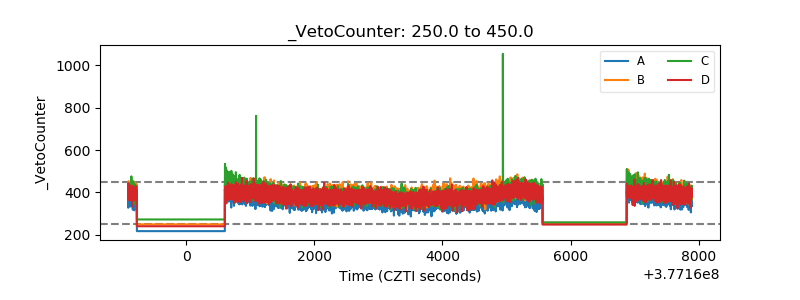 |