| Param | Original file | Final file |
|---|---|---|
| Filename | modeM0/AS1A11_060T01_9000004808_33591cztM0_level2.evt | modeM0/AS1A11_060T01_9000004808_33591cztM0_level2_quad_clean.evt |
| Size (bytes) | 1,435,933,440 | 210,424,320 |
| Size | 1.3 GB | 200.7 MB |
| Events in quadrant A | 11,696,997 | 1,317,528 |
| Events in quadrant B | 11,149,732 | 1,359,623 |
| Events in quadrant C | 8,423,518 | 1,406,614 |
| Events in quadrant D | 11,280,468 | 1,327,008 |
| Mode M0 | |||
|---|---|---|---|
| Quadrant | BADHDUFLAG | Total packets | Discarded packets |
| A | 0 | 44029 | 4 |
| B | 0 | 42412 | 3 |
| C | 0 | 33797 | 3 |
| D | 0 | 43372 | 3 |
| Mode M9 | |||
|---|---|---|---|
| Quadrant | BADHDUFLAG | Total packets | Discarded packets |
| A | 0 | 43 | 0 |
| B | 0 | 43 | 0 |
| C | 0 | 43 | 0 |
| D | 0 | 43 | 0 |
| Mode SS | |||
|---|---|---|---|
| Quadrant | BADHDUFLAG | Total packets | Discarded packets |
| A | 0 | 284 | 0 |
| B | 0 | 284 | 0 |
| C | 0 | 284 | 0 |
| D | 0 | 284 | 0 |
| Quadrant | Total seconds | Saturated seconds | Saturation percentage |
|---|---|---|---|
| A | 13918 | 1876 | 13.478948% |
| B | 13918 | 1456 | 10.461273% |
| C | 13918 | 163 | 1.171145% |
| D | 13918 | 804 | 5.776692% |
Noise dominated data is calculated using 1-second bins in cleaned event files. If a bin has >2000 counts, and if more than 50% of those come from <1% of pixels, then it is considered to be noise-dominated and hence unusable.
| Quadrant | # 1 sec bins | Bins with >0 counts | Bins with >2000 counts | High rate bins dominated by noise | Noise dominated (total time) | Noise dominated (detector-on time) | Marked lightcurve |
|---|---|---|---|---|---|---|---|
| A | 18216 | 13921 | 1615 | 1615 | 8.87% | 11.60% | 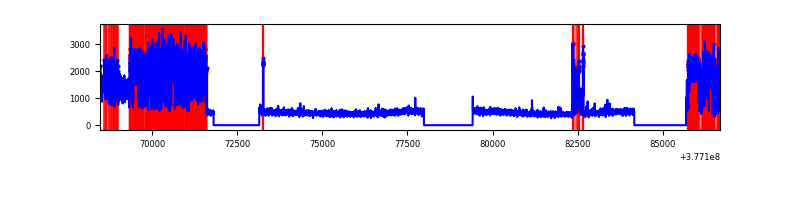 |
| B | 18216 | 13920 | 1118 | 1118 | 6.14% | 8.03% | 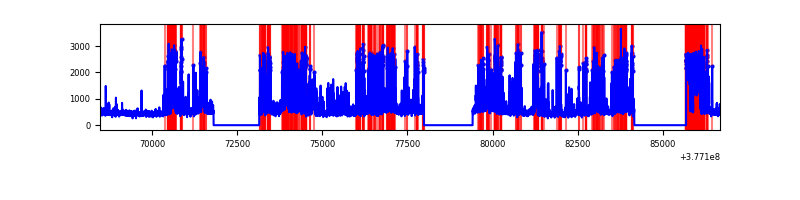 |
| C | 18216 | 13921 | 143 | 143 | 0.79% | 1.03% | 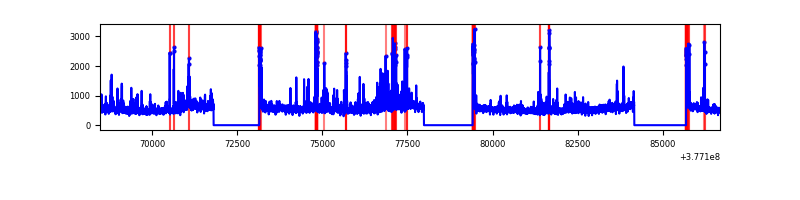 |
| D | 18216 | 13921 | 778 | 778 | 4.27% | 5.59% | 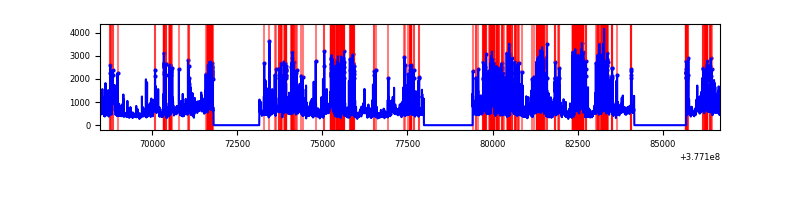 |
Top three noisy pixels from each quadrant. If the there are fewer than three noisy pixels in the level2.evt file, extra rows are filled as -1
| Pixel properties | Quadrant properties | ||||||
|---|---|---|---|---|---|---|---|
| Quadrant | DetID | PixID | Counts | Sigma | Mean | Median | Sigma |
| A | 15 | 169 | 5715516 | 18560.29 | 1533 | 1507 | 307.9 |
| A | 12 | 16 | 38276 | 119.43 | 1533 | 1507 | 307.9 |
| A | 13 | 254 | 22239 | 67.34 | 1533 | 1507 | 307.9 |
| B | 5 | 172 | 2902268 | 9700.38 | 1543 | 1499 | 299.0 |
| B | 15 | 222 | 1737681 | 5805.92 | 1543 | 1499 | 299.0 |
| B | 0 | 190 | 123696 | 408.64 | 1543 | 1499 | 299.0 |
| C | 3 | 233 | 1226517 | 3403.19 | 1559 | 1570 | 359.9 |
| C | 15 | 214 | 586371 | 1624.71 | 1559 | 1570 | 359.9 |
| C | 0 | 10 | 337734 | 933.94 | 1559 | 1570 | 359.9 |
| D | 2 | 250 | 2380828 | 6238.42 | 1540 | 1498 | 381.4 |
| D | 8 | 195 | 1313123 | 3438.98 | 1540 | 1498 | 381.4 |
| D | 14 | 34 | 555565 | 1452.72 | 1540 | 1498 | 381.4 |
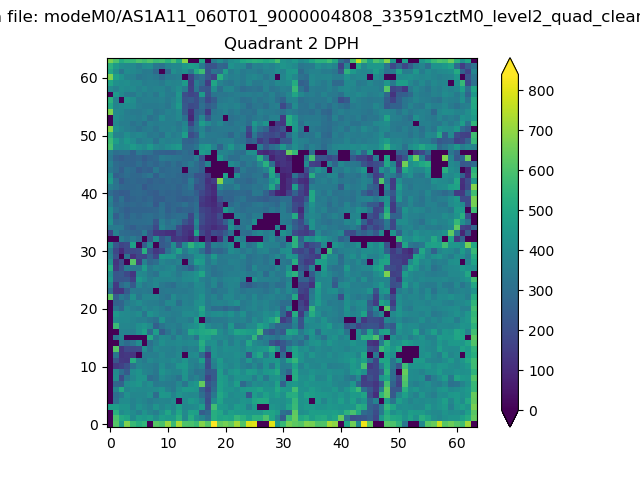
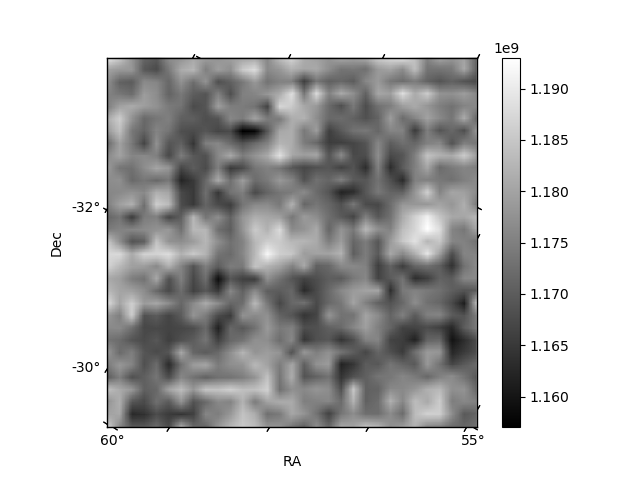
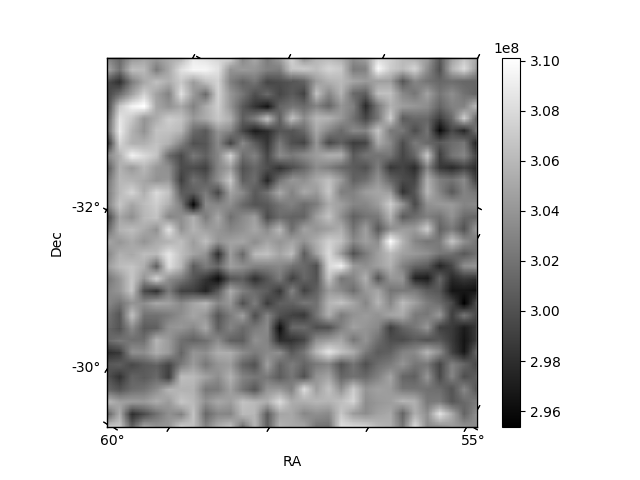
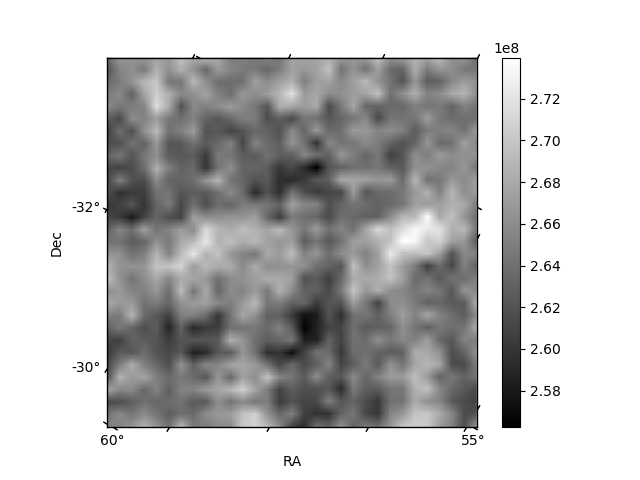
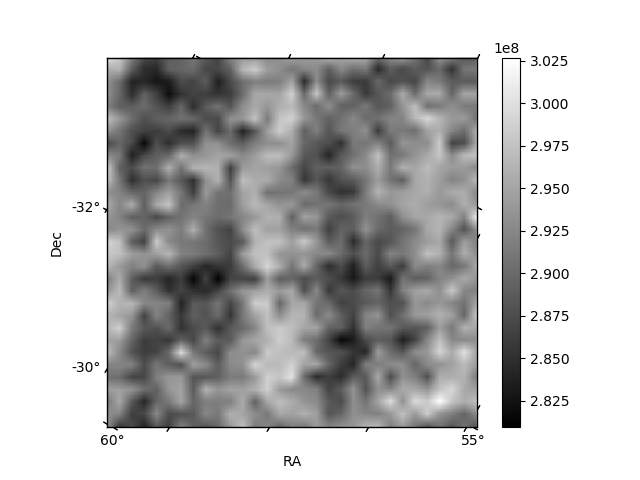
Histogram calculated using DETX and DETY for each event in the final _common_clean file
| Quadrant A | 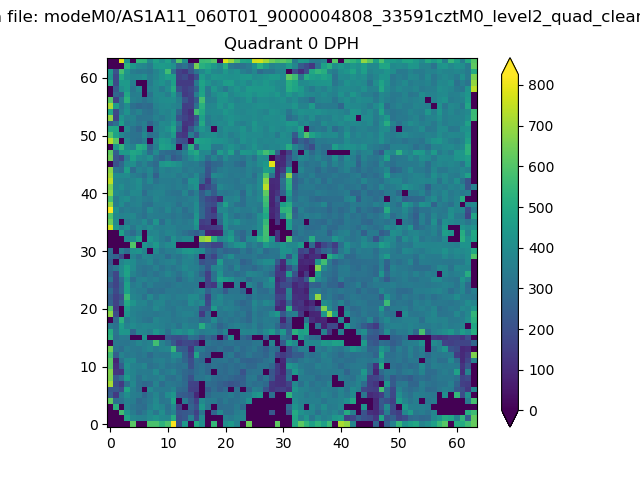 |
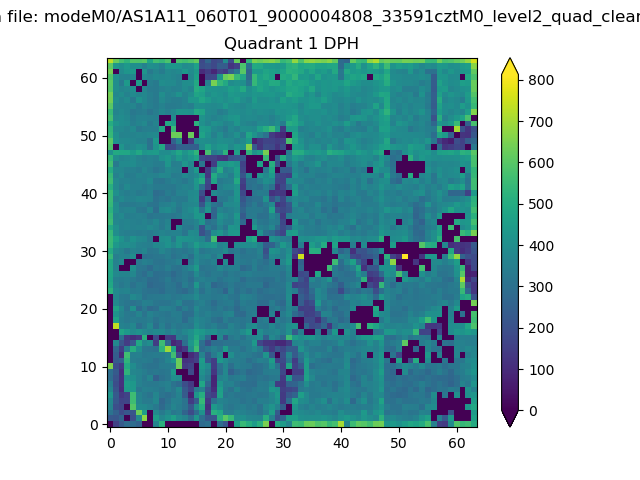 |
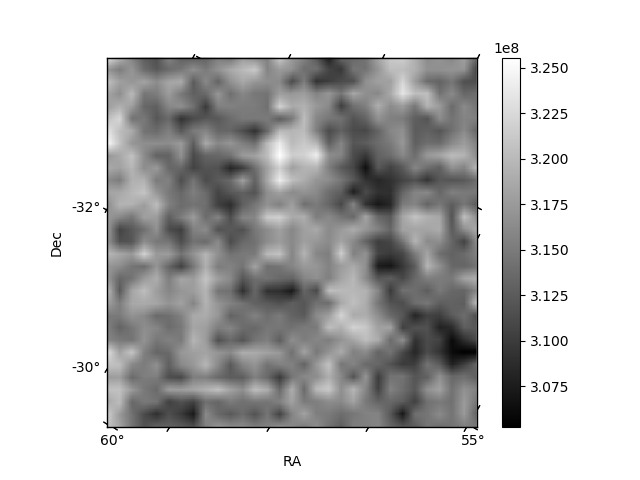
Quadrant B |
|---|---|---|---|
| Quadrant D | 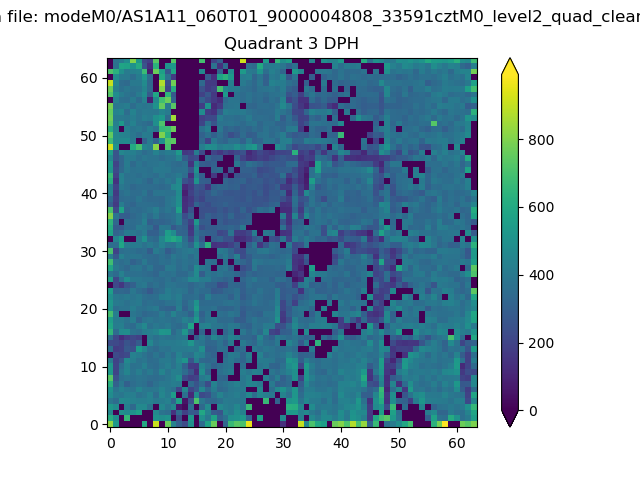 |
 |
Quadrant C |
| Plot type | Count rate plots | Images |
|---|---|---|
| Comparison with Poisson distribution Blue bars denote a histogram of data divided into 1 sec bins. Red curve is a Poisson curve with rate = median count rate of data. |
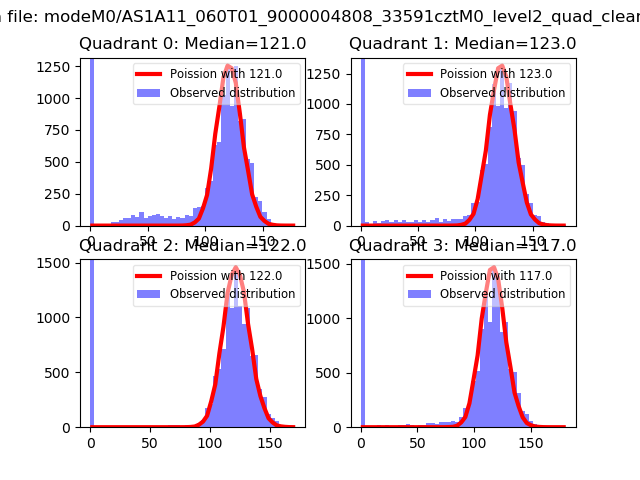 |
 |
| Quadrant-wise count rates Data is divided into 100 sec bins |
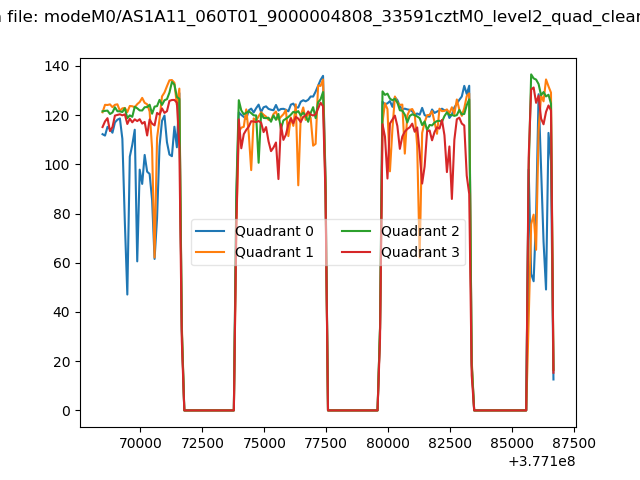 |
|
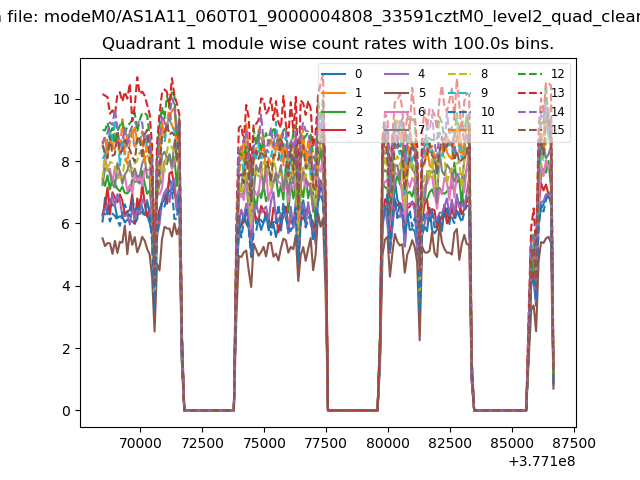
| Module-wise count rates for Quadrant A Data is divided into 100 sec bins |
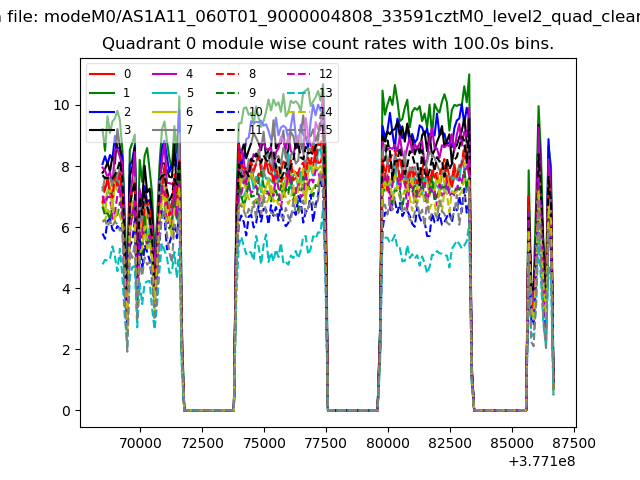 |
 |
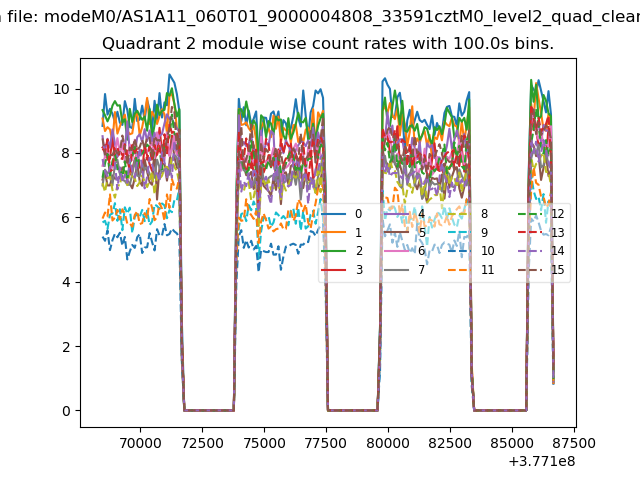
| Module-wise count rates for Quadrant B Data is divided into 100 sec bins |
 |
 |
| Module-wise count rates for Quadrant C Data is divided into 100 sec bins |
 |
 |
| Module-wise count rates for Quadrant D Data is divided into 100 sec bins |
 |
 |
| Parameter | Plot |
|---|---|
| CZT HV Monitor | 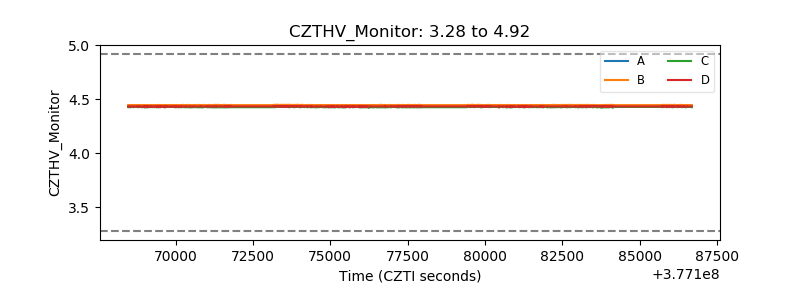 |
| D_VDD | 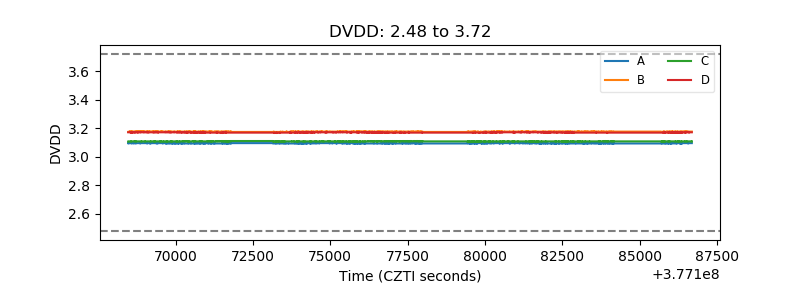 |
| Temperature 1 | 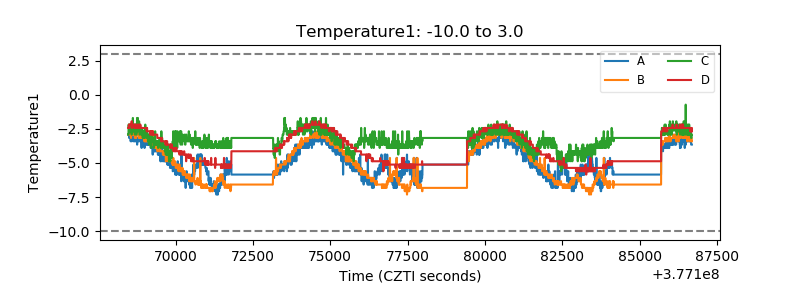 |
| Veto HV Monitor |  |
| Veto LLD | 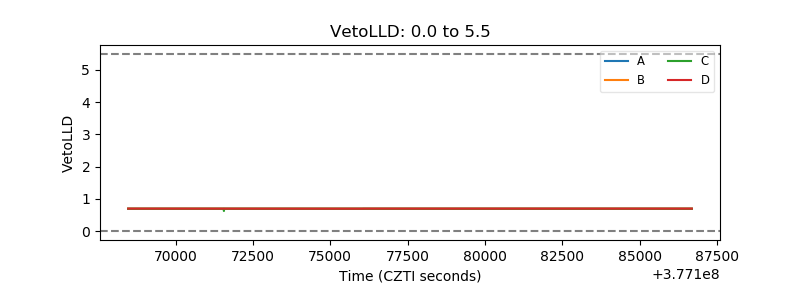 |
| Alpha Counter | 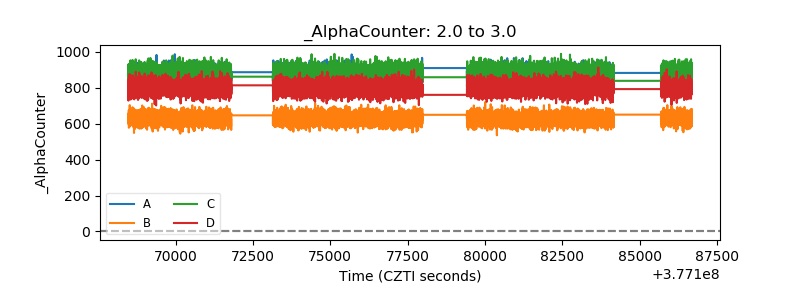 |
| _CPM_Rate | 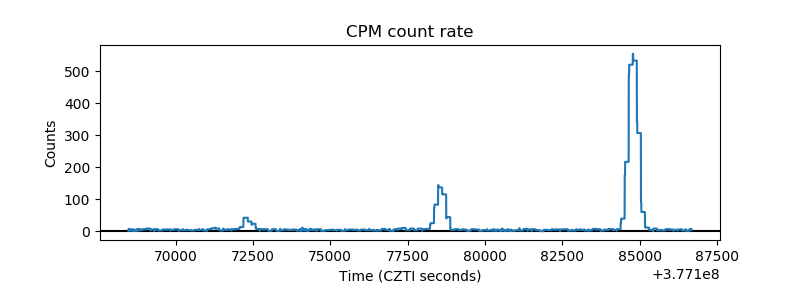 |
| CZT Counter | 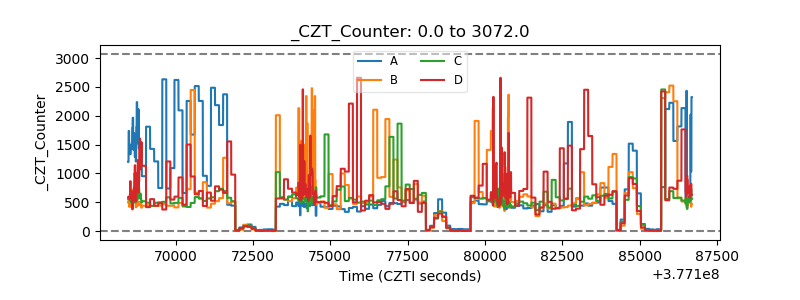 |
| +2.5 Volts monitor |  |
| +5 Volts monitor |  |
| _ROLL_ROT |  |
| _Roll_DEC |  |
| _Roll_RA | 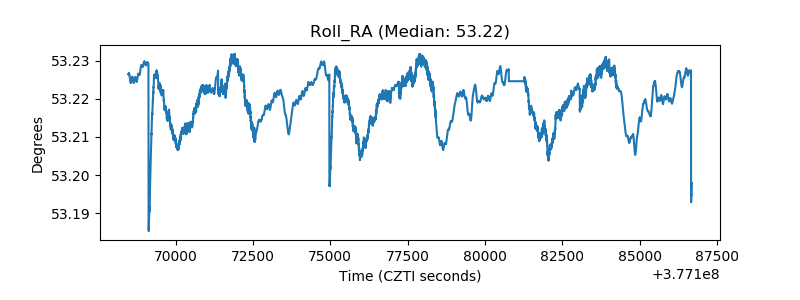 |
| Veto Counter |  |