| Param | Original file | Final file |
|---|---|---|
| Filename | modeM0/AS1A11_060T01_9000004808_33594cztM0_level2.evt | modeM0/AS1A11_060T01_9000004808_33594cztM0_level2_quad_clean.evt |
| Size (bytes) | 568,019,520 | 82,091,520 |
| Size | 541.7 MB | 78.3 MB |
| Events in quadrant A | 6,005,028 | 523,865 |
| Events in quadrant B | 3,683,600 | 547,159 |
| Events in quadrant C | 3,209,697 | 527,096 |
| Events in quadrant D | 3,937,128 | 507,475 |
| Mode M0 | |||
|---|---|---|---|
| Quadrant | BADHDUFLAG | Total packets | Discarded packets |
| A | 0 | 21642 | 2 |
| B | 0 | 14541 | 1 |
| C | 0 | 12960 | 1 |
| D | 0 | 15598 | 1 |
| Mode M9 | |||
|---|---|---|---|
| Quadrant | BADHDUFLAG | Total packets | Discarded packets |
| A | 0 | 35 | 0 |
| B | 0 | 35 | 0 |
| C | 0 | 35 | 0 |
| D | 0 | 35 | 0 |
| Mode SS | |||
|---|---|---|---|
| Quadrant | BADHDUFLAG | Total packets | Discarded packets |
| A | 0 | 112 | 0 |
| B | 0 | 112 | 0 |
| C | 0 | 112 | 0 |
| D | 0 | 112 | 0 |
| Quadrant | Total seconds | Saturated seconds | Saturation percentage |
|---|---|---|---|
| A | 5433 | 828 | 15.240199% |
| B | 5433 | 195 | 3.589177% |
| C | 5433 | 81 | 1.490889% |
| D | 5433 | 118 | 2.171912% |
Noise dominated data is calculated using 1-second bins in cleaned event files. If a bin has >2000 counts, and if more than 50% of those come from <1% of pixels, then it is considered to be noise-dominated and hence unusable.
| Quadrant | # 1 sec bins | Bins with >0 counts | Bins with >2000 counts | High rate bins dominated by noise | Noise dominated (total time) | Noise dominated (detector-on time) | Marked lightcurve |
|---|---|---|---|---|---|---|---|
| A | 8900 | 5435 | 590 | 590 | 6.63% | 10.86% | 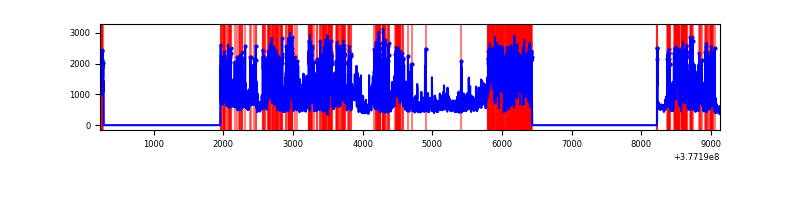 |
| B | 8900 | 5435 | 135 | 135 | 1.52% | 2.48% | 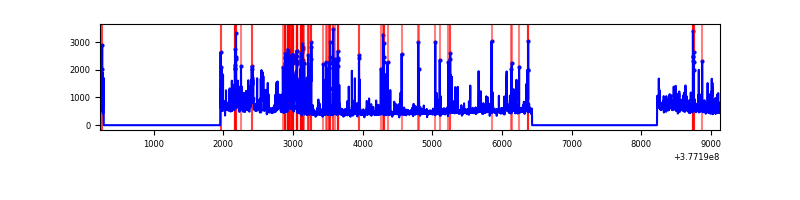 |
| C | 8900 | 5435 | 73 | 73 | 0.82% | 1.34% | 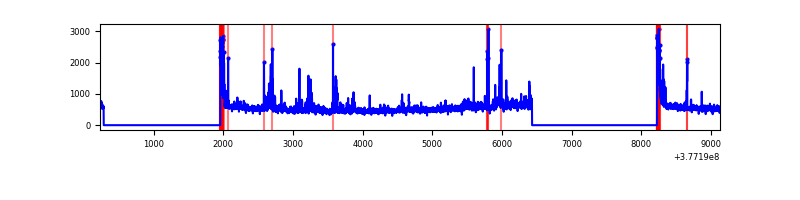 |
| D | 8900 | 5435 | 110 | 110 | 1.24% | 2.02% | 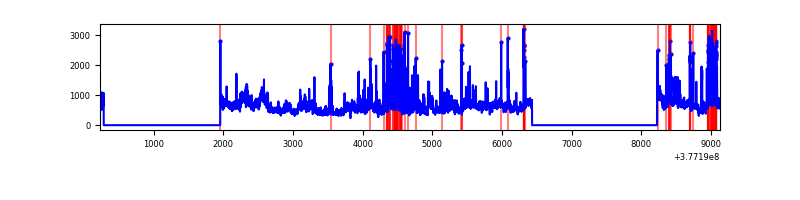 |
Top three noisy pixels from each quadrant. If the there are fewer than three noisy pixels in the level2.evt file, extra rows are filled as -1
| Pixel properties | Quadrant properties | ||||||
|---|---|---|---|---|---|---|---|
| Quadrant | DetID | PixID | Counts | Sigma | Mean | Median | Sigma |
| A | 15 | 169 | 3557345 | 28174.93 | 631 | 619 | 126.2 |
| A | 13 | 254 | 8444 | 61.99 | 631 | 619 | 126.2 |
| A | 3 | 137 | 6041 | 42.95 | 631 | 619 | 126.2 |
| B | 5 | 172 | 801942 | 6339.13 | 651 | 633 | 126.4 |
| B | 0 | 213 | 100525 | 790.24 | 651 | 633 | 126.4 |
| B | 5 | 255 | 91608 | 719.7 | 651 | 633 | 126.4 |
| C | 3 | 233 | 252653 | 1729.4 | 625 | 631 | 145.7 |
| C | 15 | 214 | 233078 | 1595.08 | 625 | 631 | 145.7 |
| C | 0 | 10 | 202652 | 1386.29 | 625 | 631 | 145.7 |
| D | 8 | 195 | 678665 | 4399.77 | 627 | 611 | 154.1 |
| D | 2 | 250 | 288673 | 1869.18 | 627 | 611 | 154.1 |
| D | 10 | 118 | 198371 | 1283.23 | 627 | 611 | 154.1 |
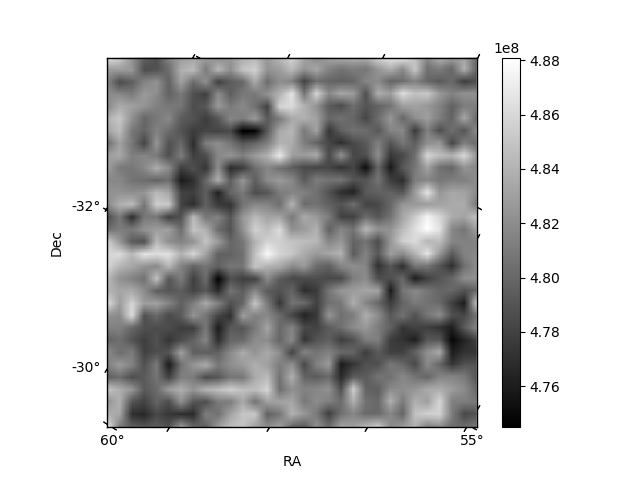
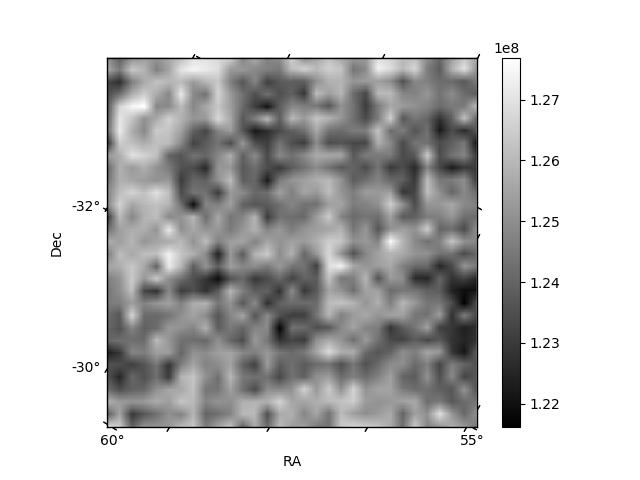
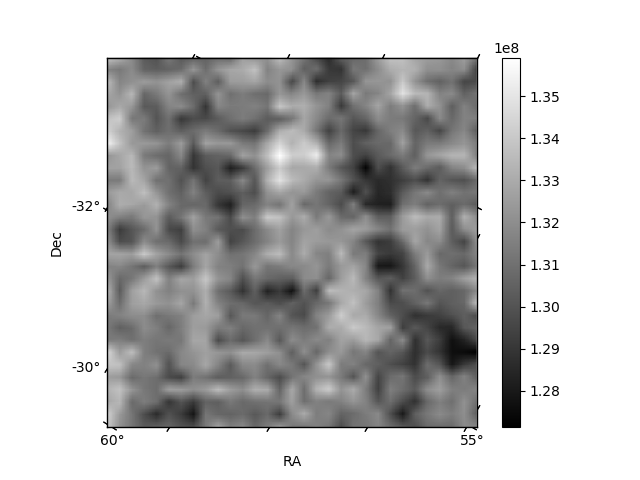
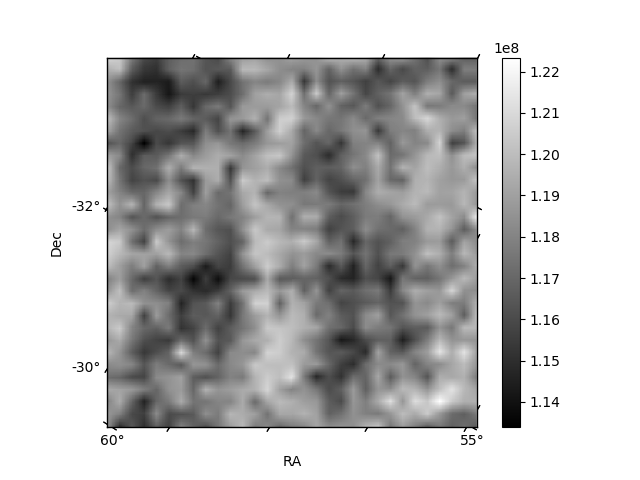
Histogram calculated using DETX and DETY for each event in the final _common_clean file
| Quadrant A | 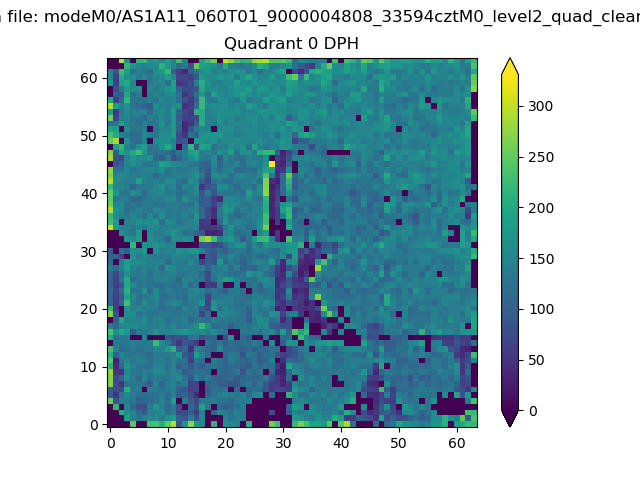 |
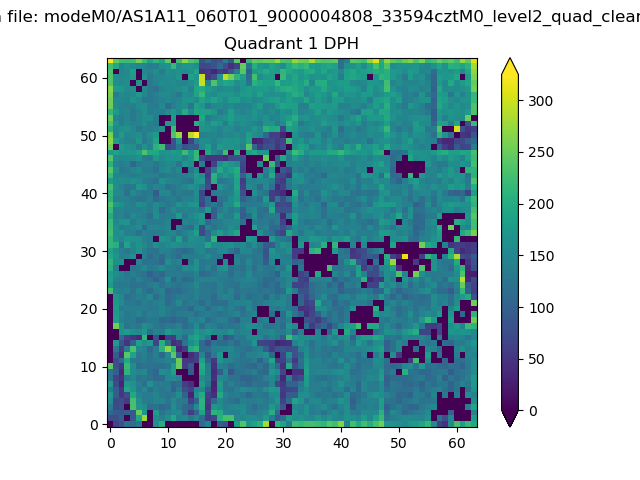 |
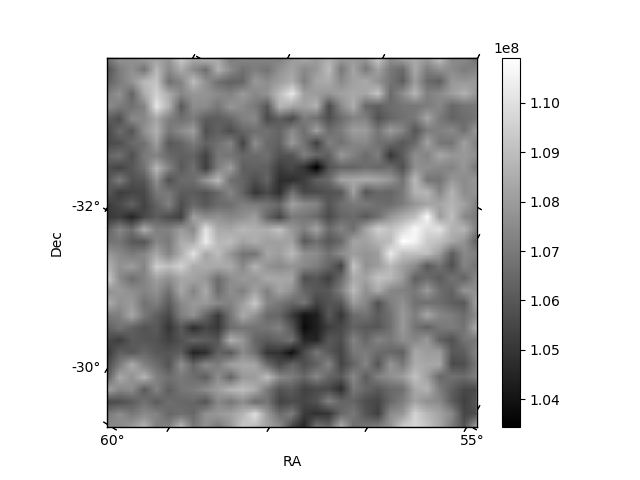
Quadrant B |
|---|---|---|---|
| Quadrant D | 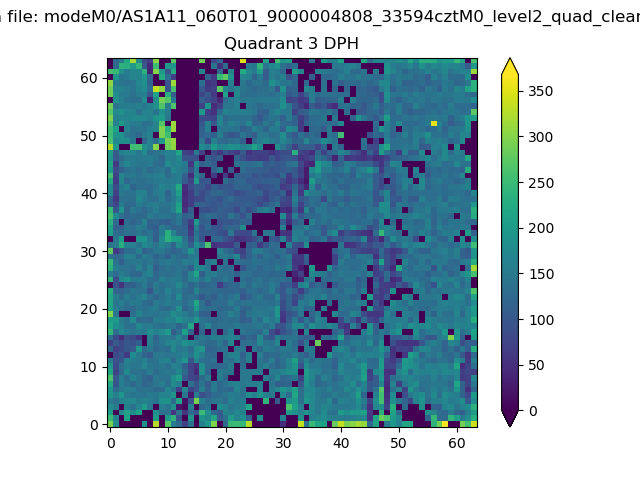 |
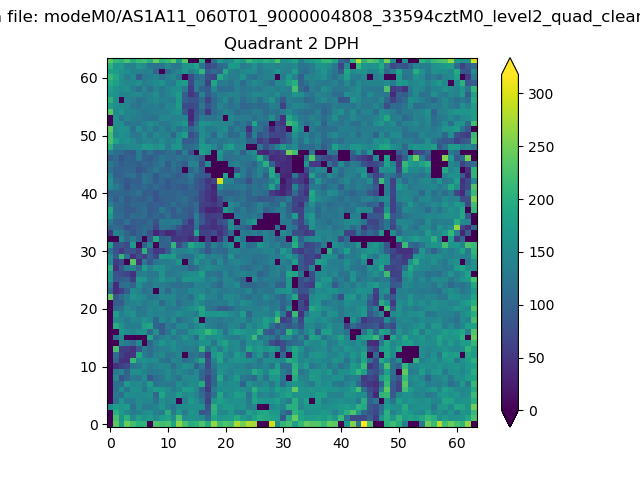 |
Quadrant C |
| Plot type | Count rate plots | Images |
|---|---|---|
| Comparison with Poisson distribution Blue bars denote a histogram of data divided into 1 sec bins. Red curve is a Poisson curve with rate = median count rate of data. |
 |
 |
| Quadrant-wise count rates Data is divided into 100 sec bins |
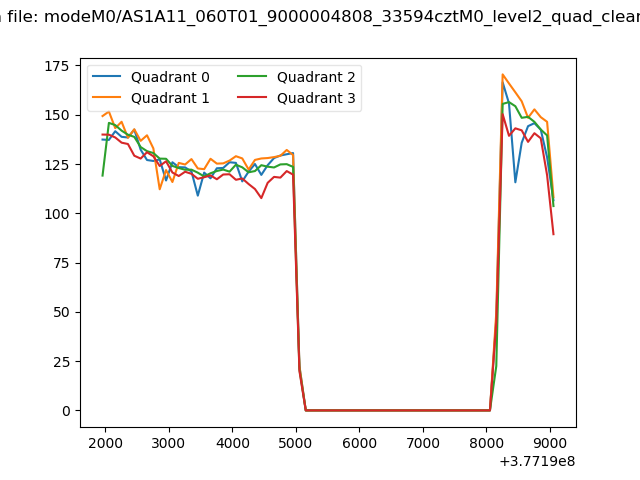 |
|
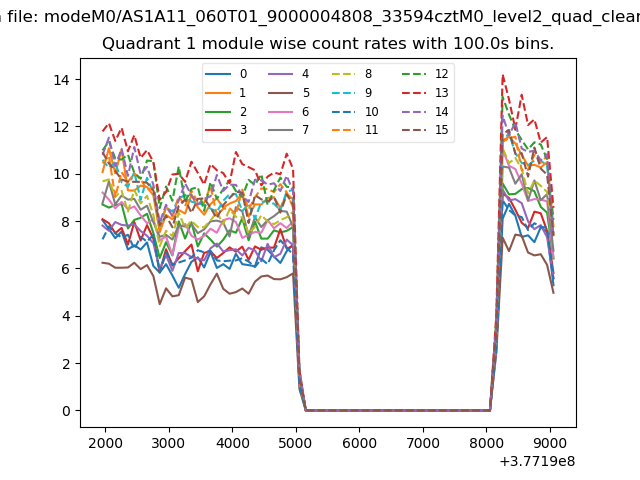
| Module-wise count rates for Quadrant A Data is divided into 100 sec bins |
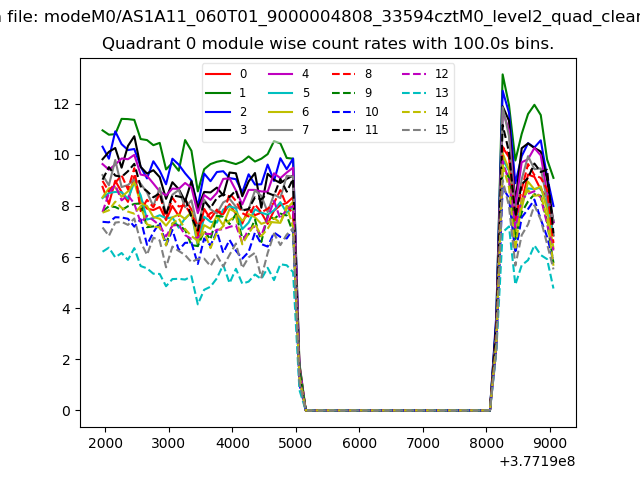 |
 |
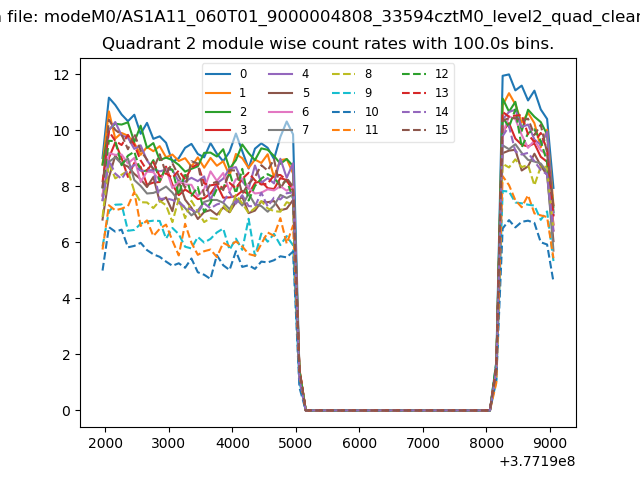
| Module-wise count rates for Quadrant B Data is divided into 100 sec bins |
 |
 |
| Module-wise count rates for Quadrant C Data is divided into 100 sec bins |
 |
 |
| Module-wise count rates for Quadrant D Data is divided into 100 sec bins |
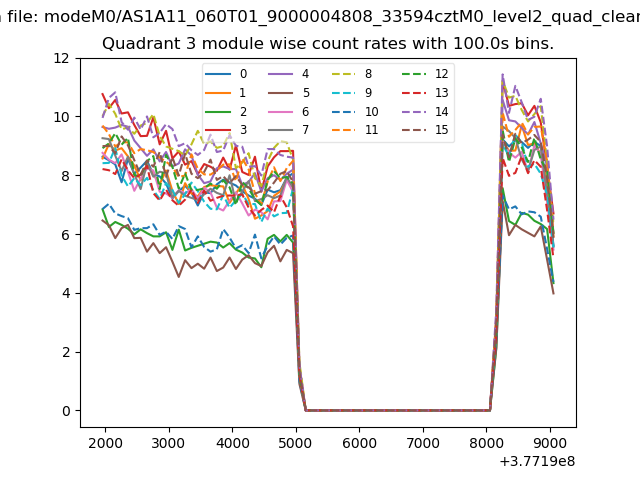 |
 |
| Parameter | Plot |
|---|---|
| CZT HV Monitor | 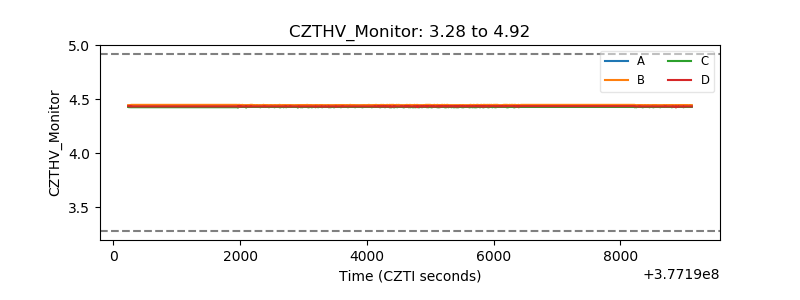 |
| D_VDD | 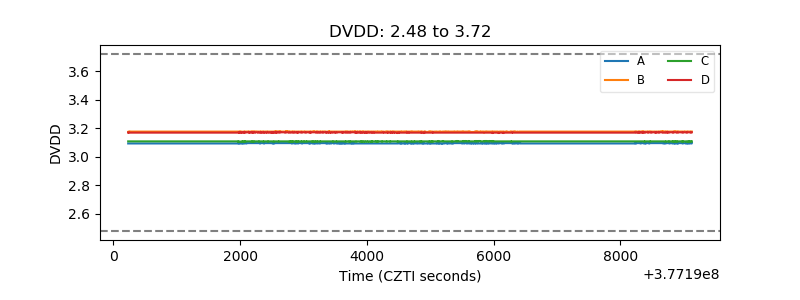 |
| Temperature 1 | 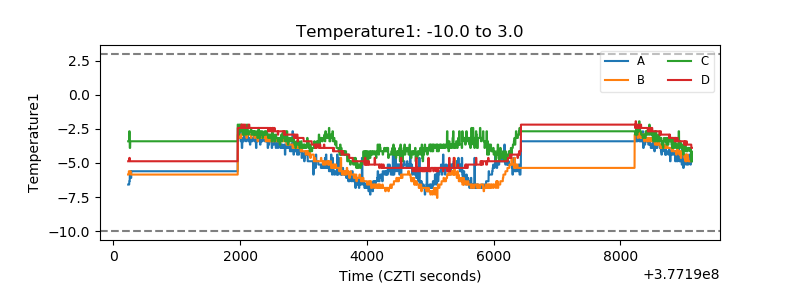 |
| Veto HV Monitor | 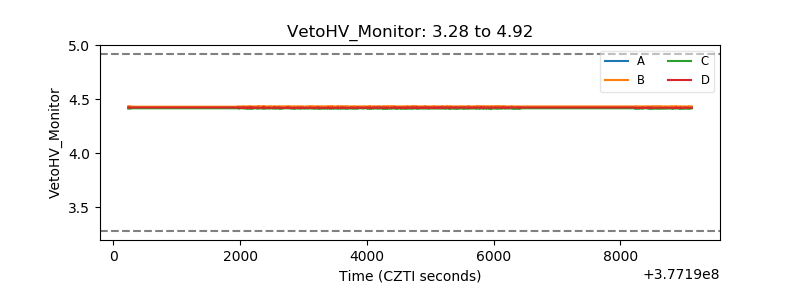 |
| Veto LLD |  |
| Alpha Counter | 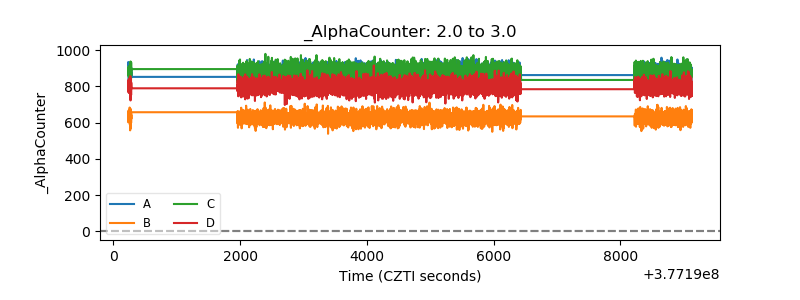 |
| _CPM_Rate | 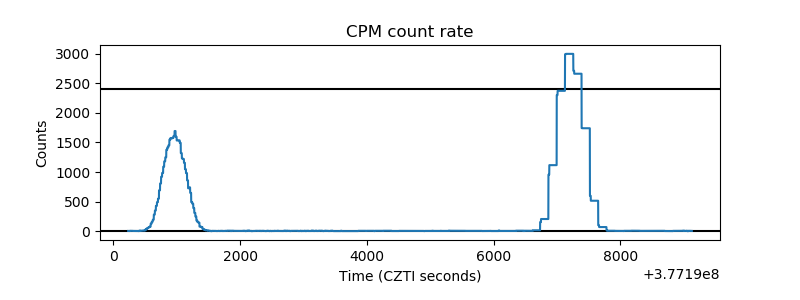 |
| CZT Counter | 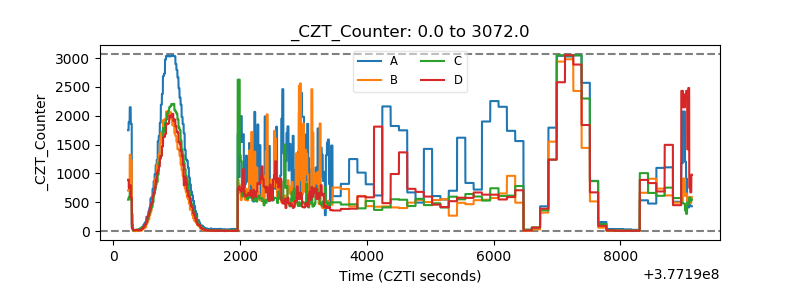 |
| +2.5 Volts monitor |  |
| +5 Volts monitor |  |
| _ROLL_ROT |  |
| _Roll_DEC | 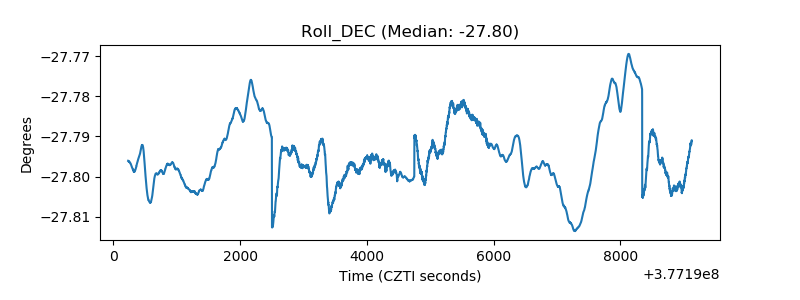 |
| _Roll_RA | 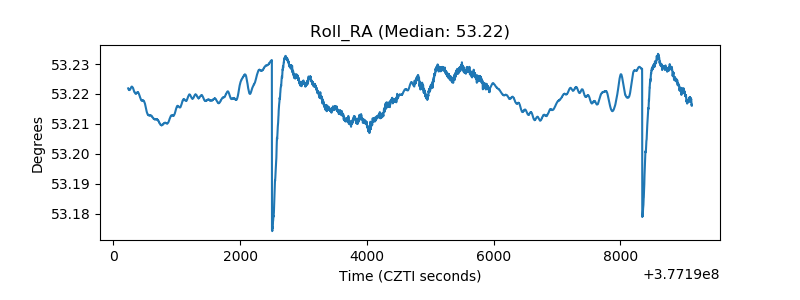 |
| Veto Counter |  |