| Param | Original file | Final file |
|---|---|---|
| Filename | modeM0/AS1A11_060T01_9000004808_33597cztM0_level2.evt | modeM0/AS1A11_060T01_9000004808_33597cztM0_level2_quad_clean.evt |
| Size (bytes) | 475,787,520 | 67,783,680 |
| Size | 453.7 MB | 64.6 MB |
| Events in quadrant A | 2,840,986 | 436,192 |
| Events in quadrant B | 4,466,609 | 433,644 |
| Events in quadrant C | 3,185,786 | 426,781 |
| Events in quadrant D | 3,573,042 | 401,073 |
| Mode M0 | |||
|---|---|---|---|
| Quadrant | BADHDUFLAG | Total packets | Discarded packets |
| A | 0 | 11430 | 3 |
| B | 0 | 16631 | 2 |
| C | 0 | 12695 | 2 |
| D | 0 | 14077 | 2 |
| Mode M9 | |||
|---|---|---|---|
| Quadrant | BADHDUFLAG | Total packets | Discarded packets |
| A | 0 | 33 | 0 |
| B | 0 | 33 | 0 |
| C | 0 | 33 | 0 |
| D | 0 | 34 | 0 |
| Mode SS | |||
|---|---|---|---|
| Quadrant | BADHDUFLAG | Total packets | Discarded packets |
| A | 0 | 102 | 0 |
| B | 0 | 102 | 0 |
| C | 0 | 102 | 0 |
| D | 0 | 102 | 0 |
| Quadrant | Total seconds | Saturated seconds | Saturation percentage |
|---|---|---|---|
| A | 5063 | 28 | 0.553032% |
| B | 5063 | 518 | 10.231088% |
| C | 5063 | 79 | 1.560340% |
| D | 5063 | 102 | 2.014616% |
Noise dominated data is calculated using 1-second bins in cleaned event files. If a bin has >2000 counts, and if more than 50% of those come from <1% of pixels, then it is considered to be noise-dominated and hence unusable.
| Quadrant | # 1 sec bins | Bins with >0 counts | Bins with >2000 counts | High rate bins dominated by noise | Noise dominated (total time) | Noise dominated (detector-on time) | Marked lightcurve |
|---|---|---|---|---|---|---|---|
| A | 7186 | 5064 | 10 | 10 | 0.14% | 0.20% | 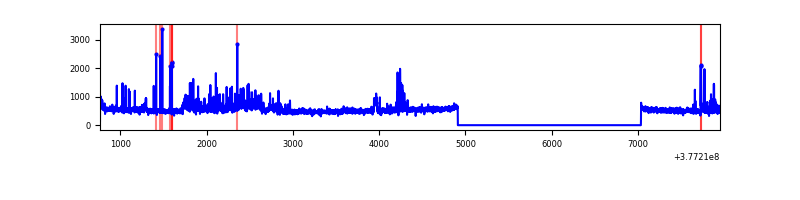 |
| B | 7186 | 5064 | 416 | 416 | 5.79% | 8.21% | 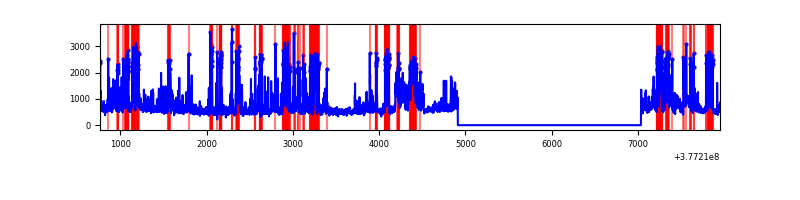 |
| C | 7186 | 5064 | 81 | 81 | 1.13% | 1.60% | 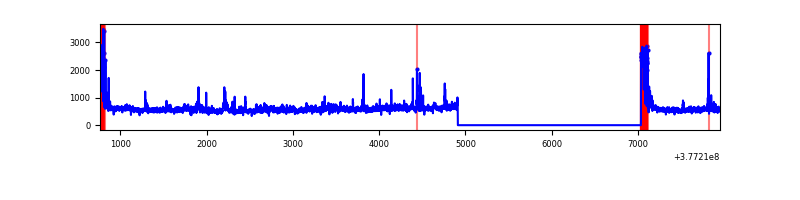 |
| D | 7186 | 5064 | 110 | 110 | 1.53% | 2.17% | 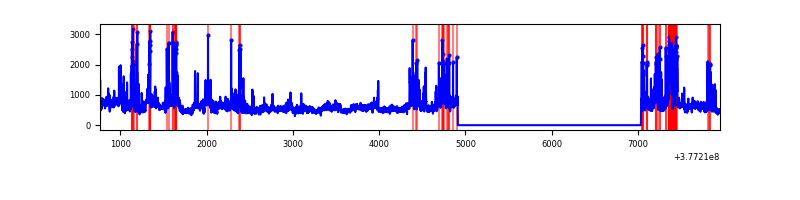 |
Top three noisy pixels from each quadrant. If the there are fewer than three noisy pixels in the level2.evt file, extra rows are filled as -1
| Pixel properties | Quadrant properties | ||||||
|---|---|---|---|---|---|---|---|
| Quadrant | DetID | PixID | Counts | Sigma | Mean | Median | Sigma |
| A | 15 | 169 | 369804 | 2917.69 | 638 | 628 | 126.5 |
| A | 13 | 254 | 7604 | 55.13 | 638 | 628 | 126.5 |
| A | 10 | 83 | 6607 | 47.25 | 638 | 628 | 126.5 |
| B | 5 | 172 | 1522266 | 12792.54 | 622 | 606 | 118.9 |
| B | 0 | 213 | 262140 | 2198.71 | 622 | 606 | 118.9 |
| B | 15 | 222 | 119599 | 1000.37 | 622 | 606 | 118.9 |
| C | 0 | 10 | 241604 | 1660.22 | 627 | 633 | 145.1 |
| C | 15 | 214 | 217424 | 1493.63 | 627 | 633 | 145.1 |
| C | 3 | 233 | 138329 | 948.69 | 627 | 633 | 145.1 |
| D | 8 | 195 | 451247 | 3047.04 | 616 | 601 | 147.9 |
| D | 2 | 250 | 332521 | 2244.28 | 616 | 601 | 147.9 |
| D | 1 | 52 | 134370 | 904.48 | 616 | 601 | 147.9 |
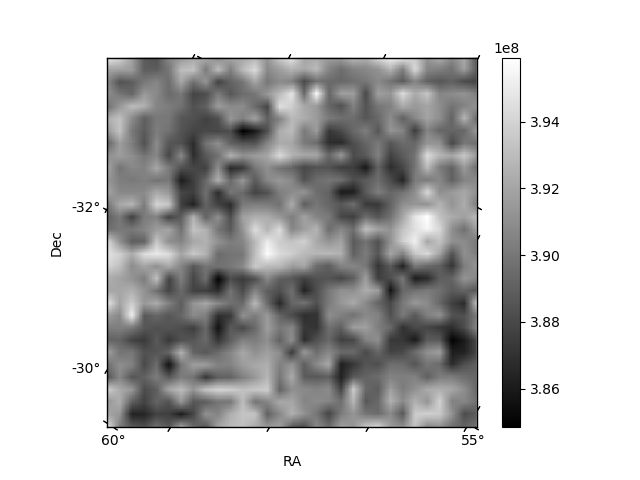
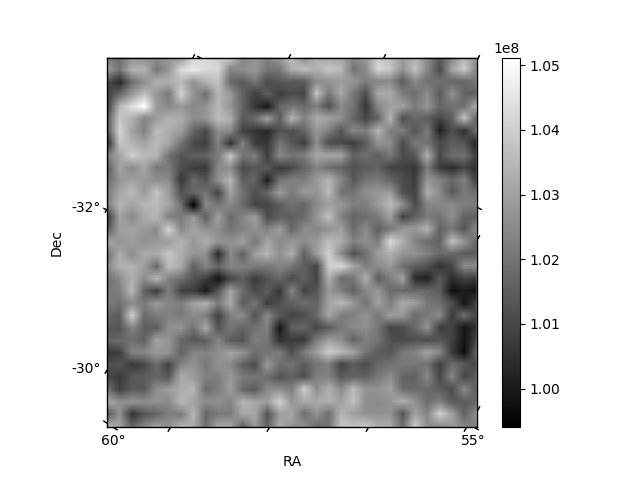
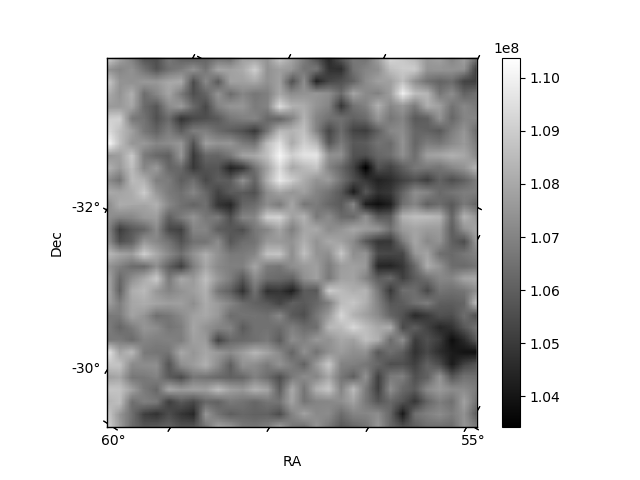
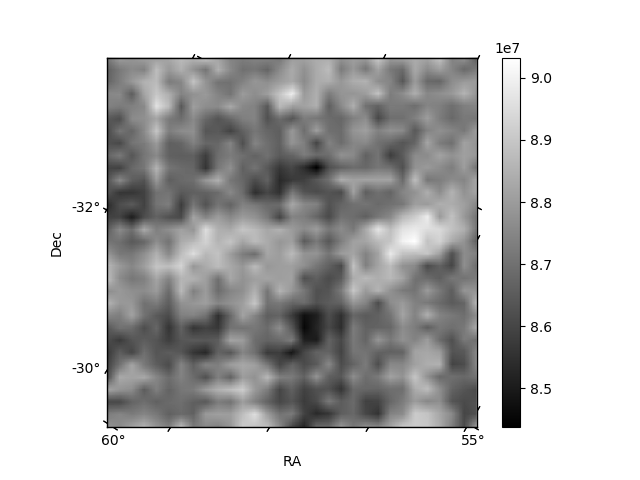
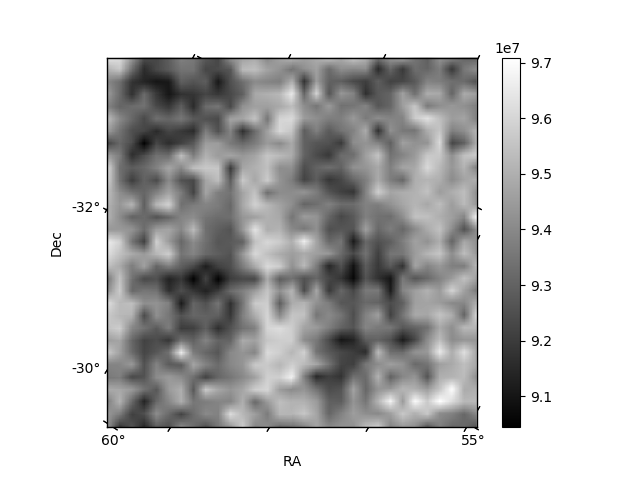
Histogram calculated using DETX and DETY for each event in the final _common_clean file
| Quadrant A | 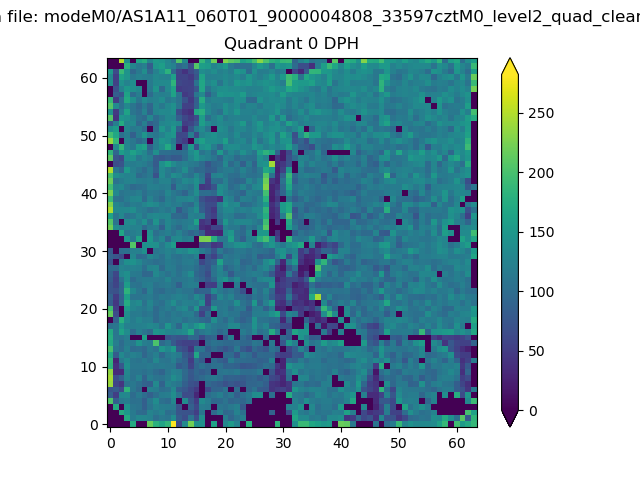 |
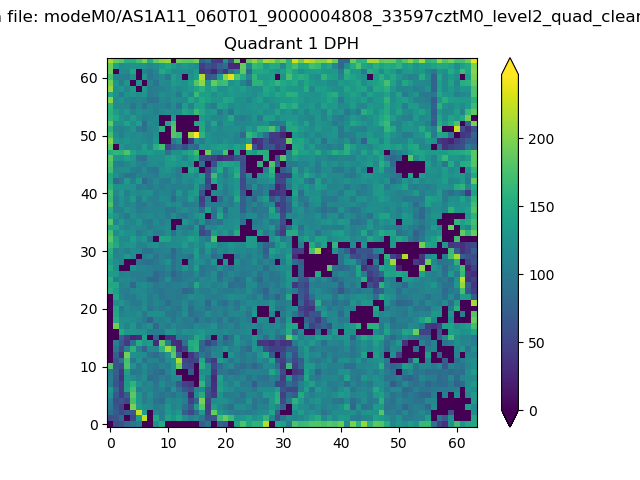 |
Quadrant B |
|---|---|---|---|
| Quadrant D | 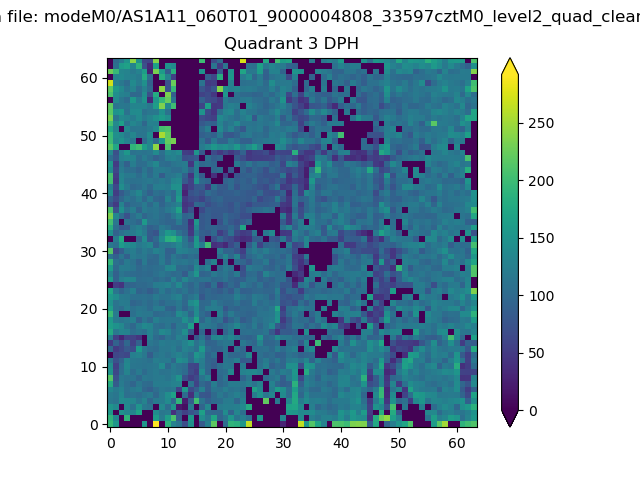 |
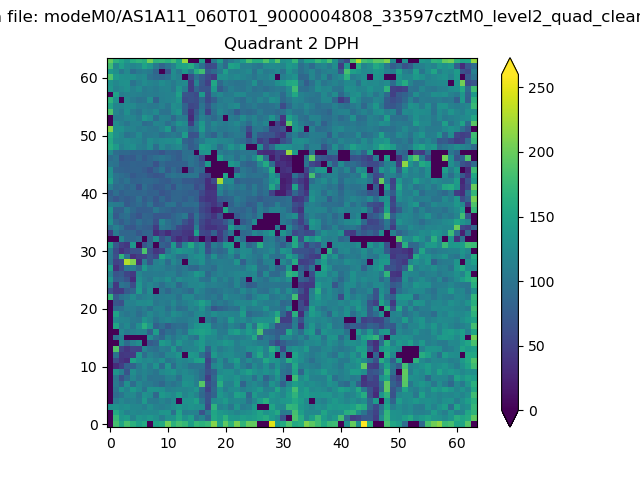 |
Quadrant C |
| Plot type | Count rate plots | Images |
|---|---|---|
| Comparison with Poisson distribution Blue bars denote a histogram of data divided into 1 sec bins. Red curve is a Poisson curve with rate = median count rate of data. |
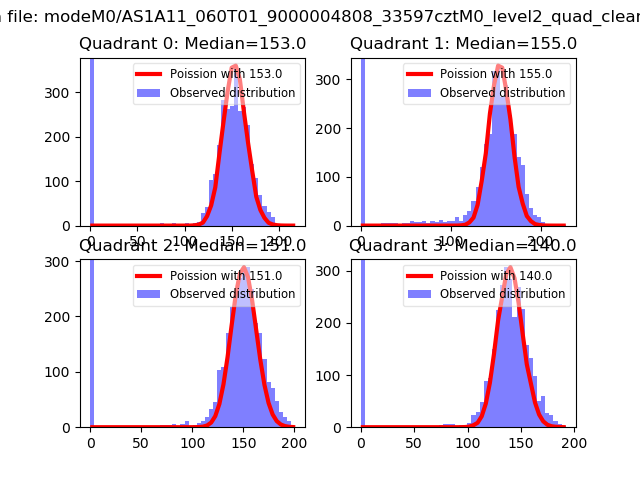 |
 |
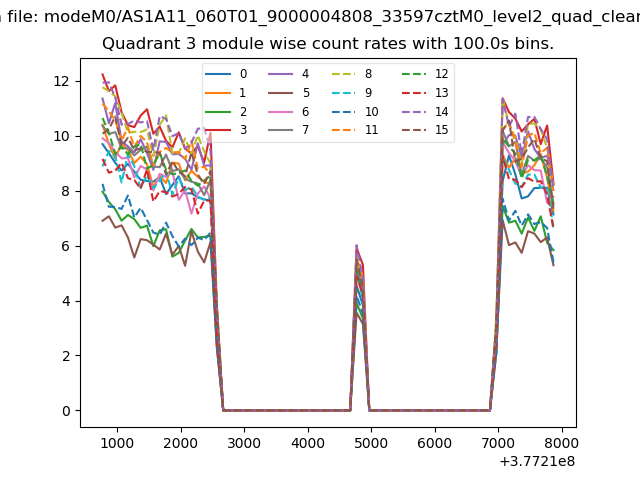
| Quadrant-wise count rates Data is divided into 100 sec bins |
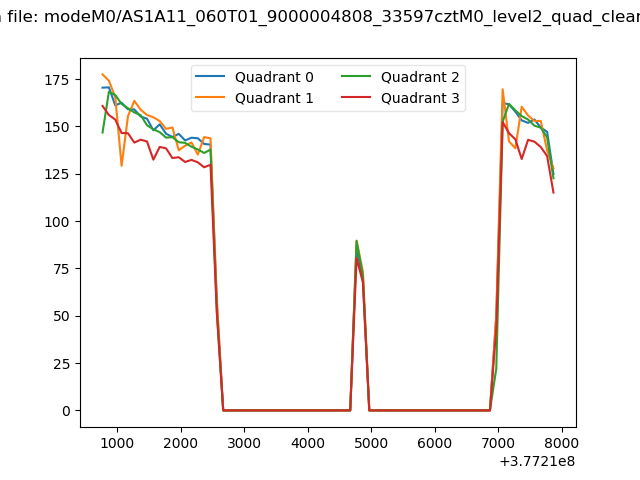 |
|
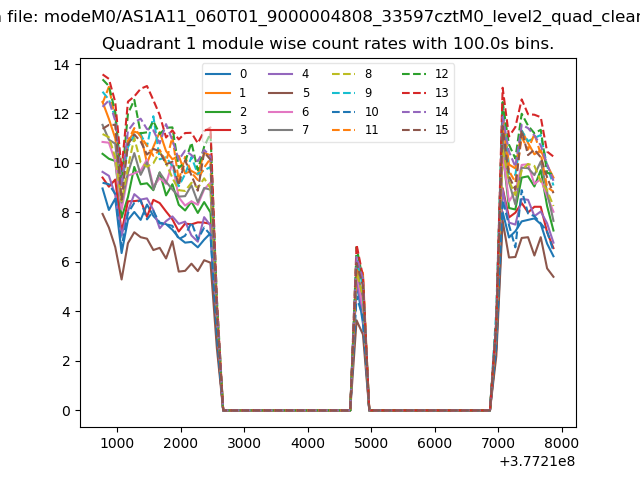
| Module-wise count rates for Quadrant A Data is divided into 100 sec bins |
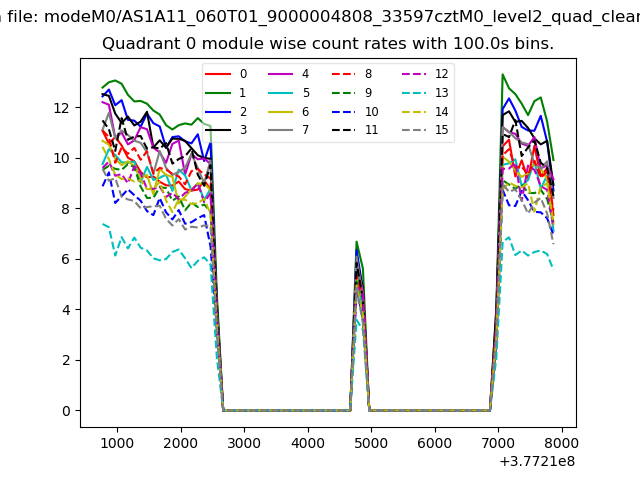 |
 |
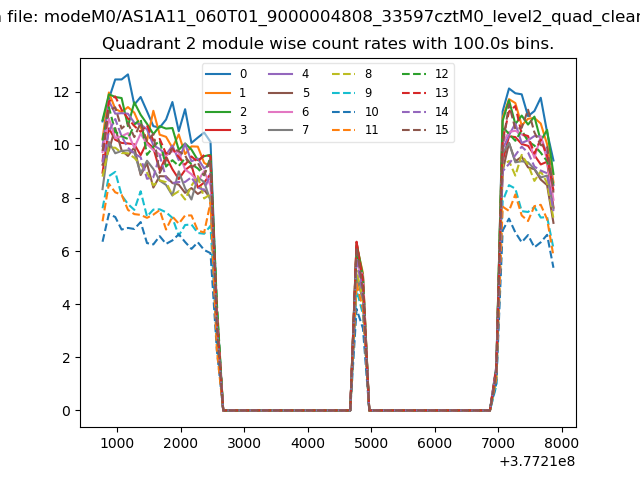
| Module-wise count rates for Quadrant B Data is divided into 100 sec bins |
 |
 |
| Module-wise count rates for Quadrant C Data is divided into 100 sec bins |
 |
 |
| Module-wise count rates for Quadrant D Data is divided into 100 sec bins |
 |
 |
| Parameter | Plot |
|---|---|
| CZT HV Monitor | 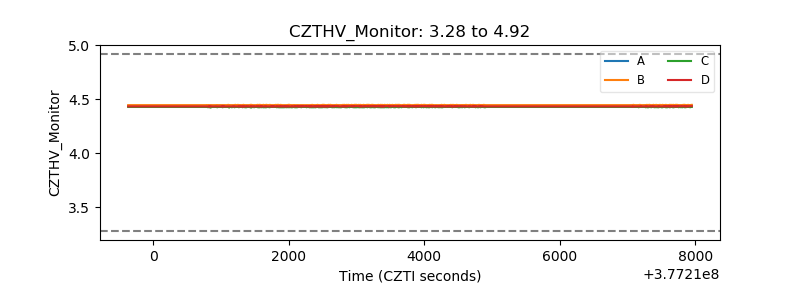 |
| D_VDD | 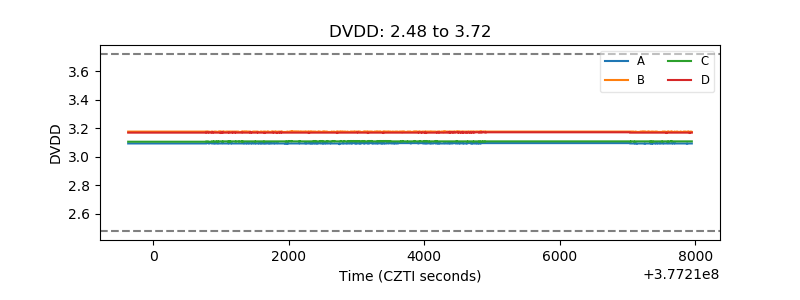 |
| Temperature 1 | 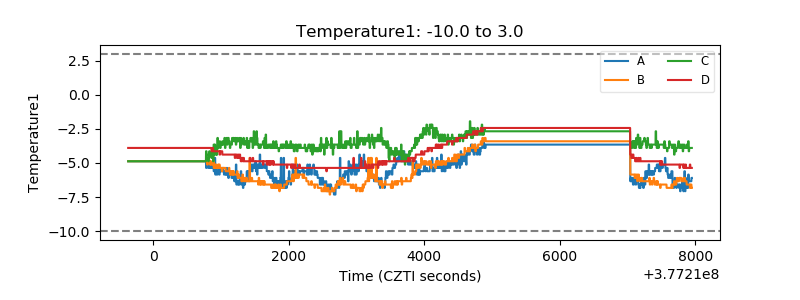 |
| Veto HV Monitor | 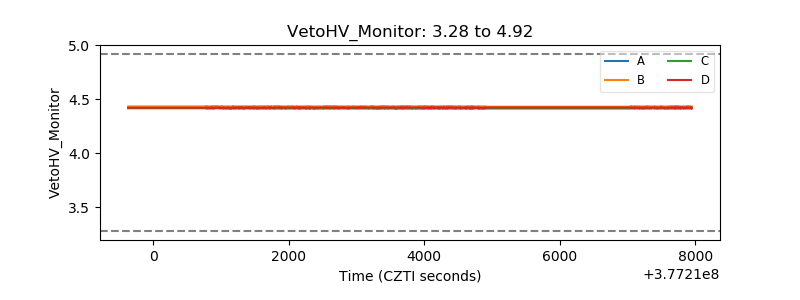 |
| Veto LLD | 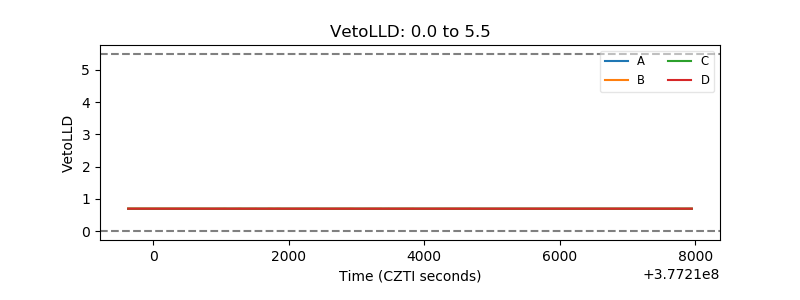 |
| Alpha Counter | 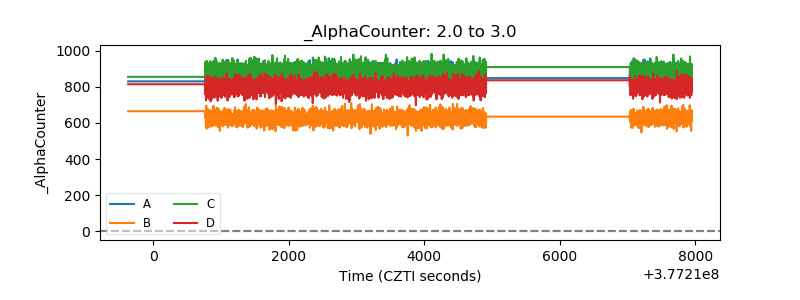 |
| _CPM_Rate | 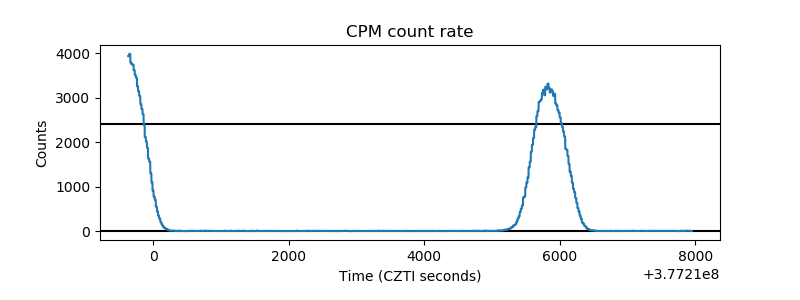 |
| CZT Counter | 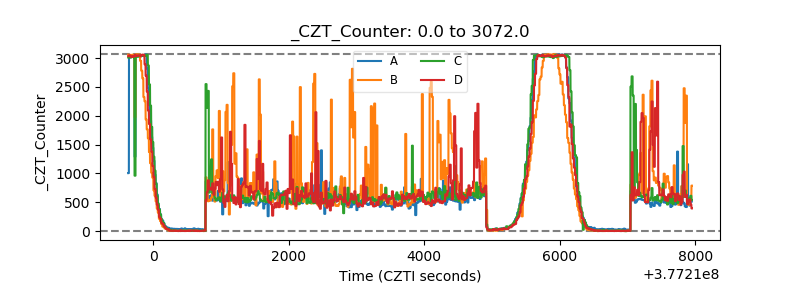 |
| +2.5 Volts monitor |  |
| +5 Volts monitor |  |
| _ROLL_ROT | 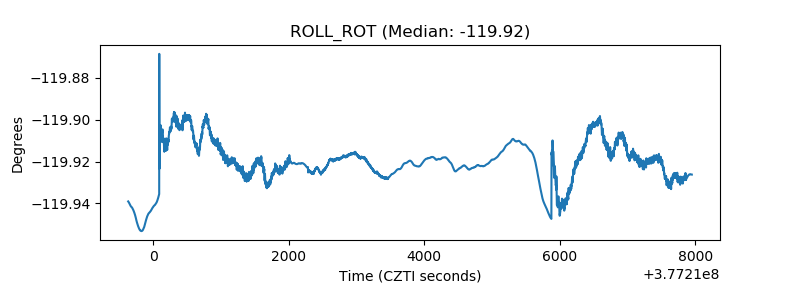 |
| _Roll_DEC | 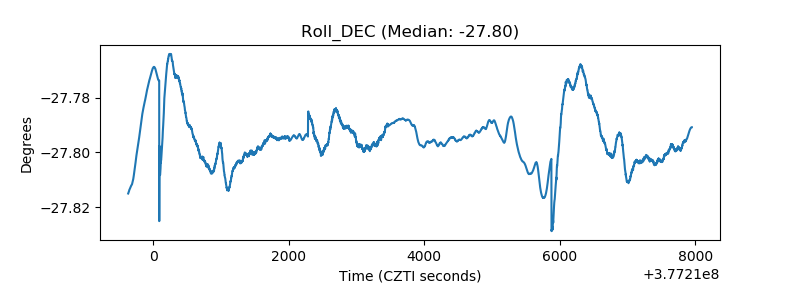 |
| _Roll_RA | 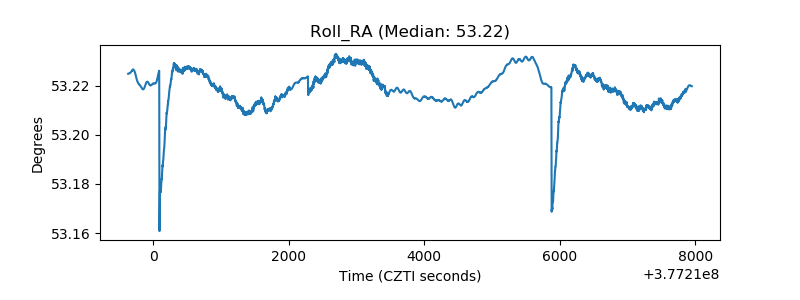 |
| Veto Counter | 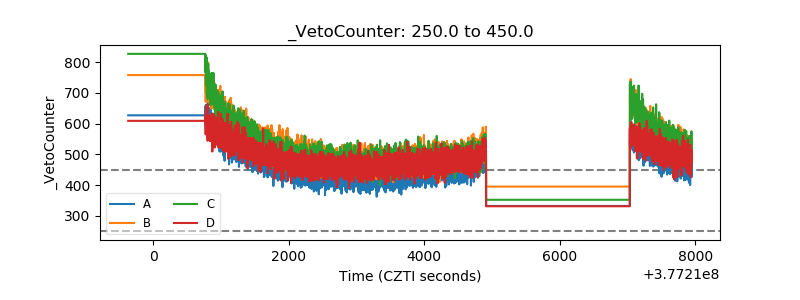 |