| Param | Original file | Final file |
|---|---|---|
| Filename | modeM0/AS1A11_060T01_9000004808_33599cztM0_level2.evt | modeM0/AS1A11_060T01_9000004808_33599cztM0_level2_quad_clean.evt |
| Size (bytes) | 522,604,800 | 56,612,160 |
| Size | 498.4 MB | 54.0 MB |
| Events in quadrant A | 2,431,732 | 361,901 |
| Events in quadrant B | 5,281,763 | 351,342 |
| Events in quadrant C | 4,334,730 | 304,962 |
| Events in quadrant D | 3,431,856 | 336,180 |
| Mode M0 | |||
|---|---|---|---|
| Quadrant | BADHDUFLAG | Total packets | Discarded packets |
| A | 0 | 10408 | 3 |
| B | 0 | 19191 | 2 |
| C | 0 | 15873 | 2 |
| D | 0 | 13885 | 2 |
| Mode M9 | |||
|---|---|---|---|
| Quadrant | BADHDUFLAG | Total packets | Discarded packets |
| A | 0 | 38 | 0 |
| B | 0 | 38 | 0 |
| C | 0 | 38 | 0 |
| D | 0 | 39 | 0 |
| Mode SS | |||
|---|---|---|---|
| Quadrant | BADHDUFLAG | Total packets | Discarded packets |
| A | 0 | 104 | 0 |
| B | 0 | 104 | 0 |
| C | 0 | 104 | 0 |
| D | 0 | 104 | 0 |
| Quadrant | Total seconds | Saturated seconds | Saturation percentage |
|---|---|---|---|
| A | 5126 | 7 | 0.136559% |
| B | 5126 | 532 | 10.378463% |
| C | 5126 | 638 | 12.446352% |
| D | 5126 | 54 | 1.053453% |
Noise dominated data is calculated using 1-second bins in cleaned event files. If a bin has >2000 counts, and if more than 50% of those come from <1% of pixels, then it is considered to be noise-dominated and hence unusable.
| Quadrant | # 1 sec bins | Bins with >0 counts | Bins with >2000 counts | High rate bins dominated by noise | Noise dominated (total time) | Noise dominated (detector-on time) | Marked lightcurve |
|---|---|---|---|---|---|---|---|
| A | 7189 | 5127 | 1 | 1 | 0.01% | 0.02% | 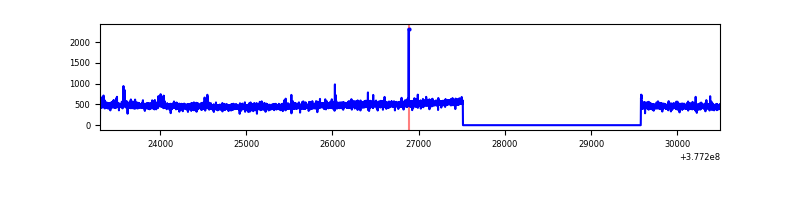 |
| B | 7189 | 5126 | 352 | 352 | 4.90% | 6.87% | 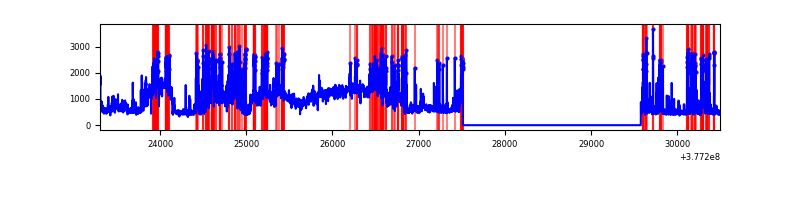 |
| C | 7189 | 5127 | 627 | 627 | 8.72% | 12.23% | 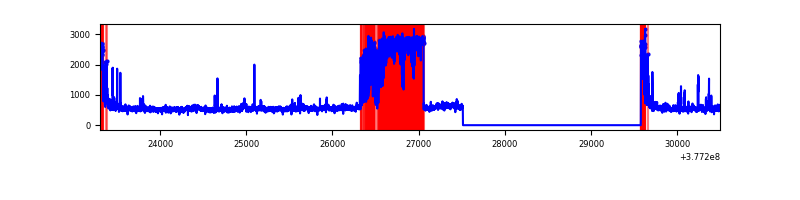 |
| D | 7189 | 5127 | 48 | 48 | 0.67% | 0.94% | 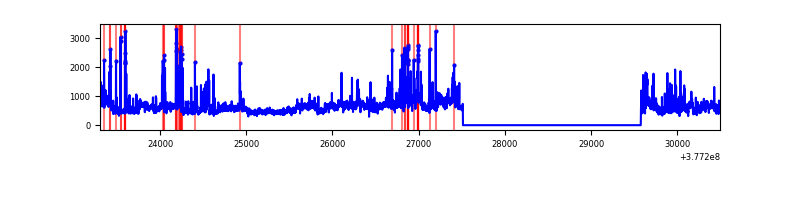 |
Top three noisy pixels from each quadrant. If the there are fewer than three noisy pixels in the level2.evt file, extra rows are filled as -1
| Pixel properties | Quadrant properties | ||||||
|---|---|---|---|---|---|---|---|
| Quadrant | DetID | PixID | Counts | Sigma | Mean | Median | Sigma |
| A | 15 | 169 | 21734 | 171.28 | 622 | 610 | 123.3 |
| A | 13 | 254 | 8809 | 66.48 | 622 | 610 | 123.3 |
| A | 10 | 83 | 6719 | 49.53 | 622 | 610 | 123.3 |
| B | 15 | 222 | 1668609 | 14374.23 | 604 | 589 | 116.0 |
| B | 5 | 172 | 878890 | 7568.79 | 604 | 589 | 116.0 |
| B | 4 | 251 | 130400 | 1118.65 | 604 | 589 | 116.0 |
| C | 4 | 254 | 1431867 | 10855.05 | 573 | 579 | 131.9 |
| C | 0 | 10 | 247480 | 1872.53 | 573 | 579 | 131.9 |
| C | 15 | 214 | 210987 | 1595.76 | 573 | 579 | 131.9 |
| D | 8 | 195 | 617991 | 4160.76 | 606 | 592 | 148.4 |
| D | 13 | 249 | 205473 | 1380.73 | 606 | 592 | 148.4 |
| D | 2 | 250 | 83516 | 558.84 | 606 | 592 | 148.4 |
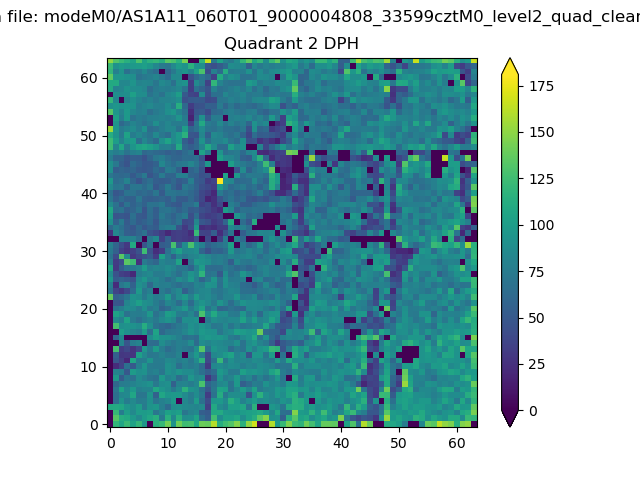
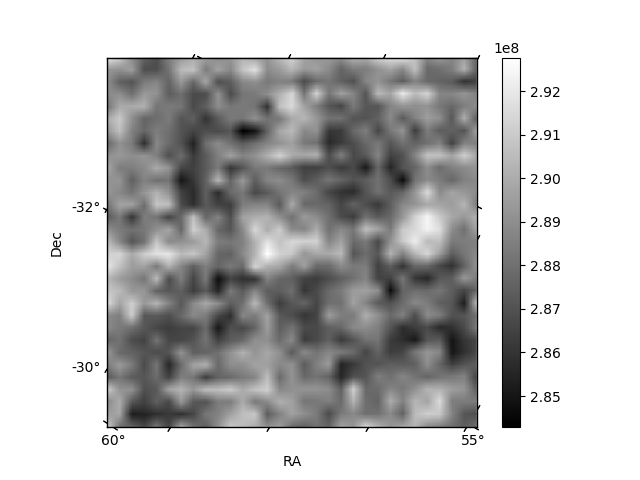
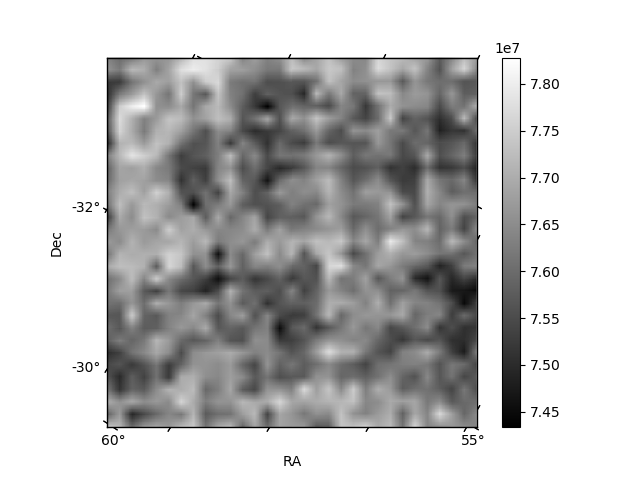
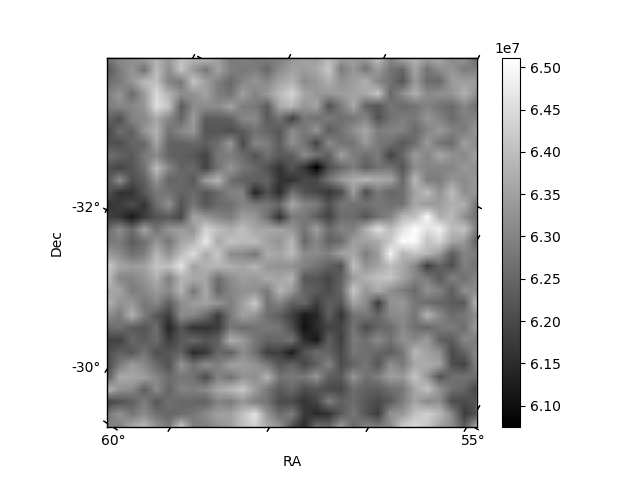
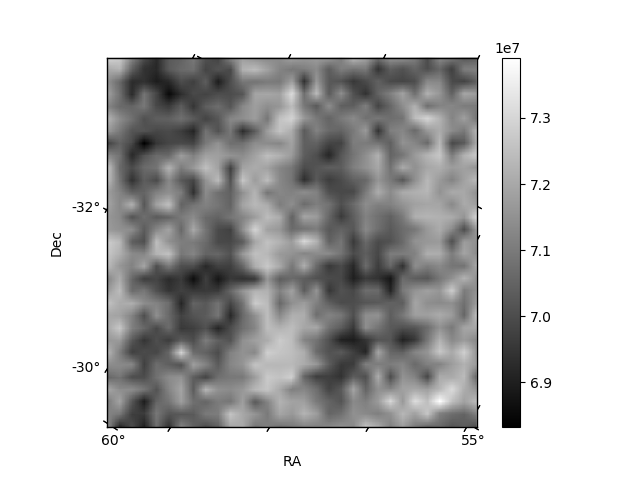
Histogram calculated using DETX and DETY for each event in the final _common_clean file
| Quadrant A | 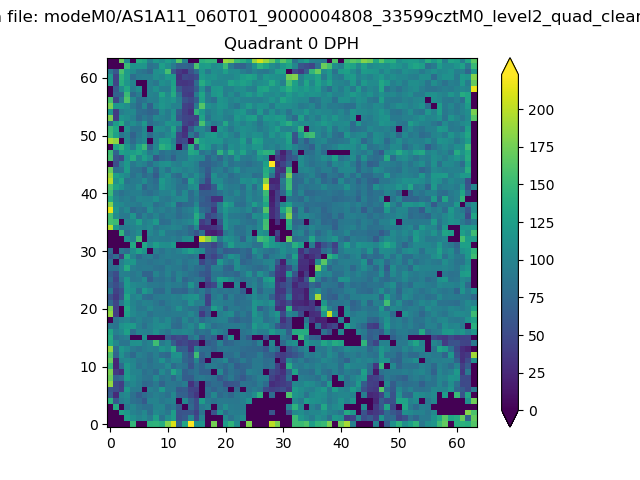 |
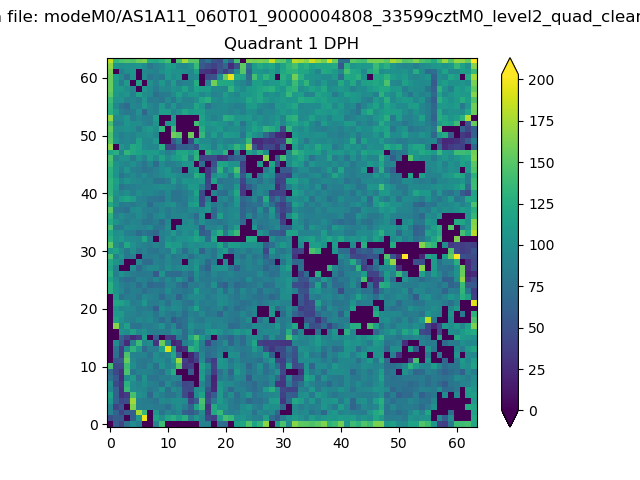 |
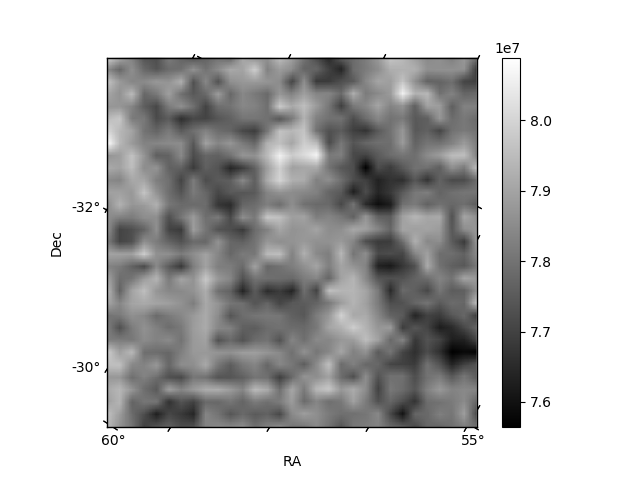
Quadrant B |
|---|---|---|---|
| Quadrant D | 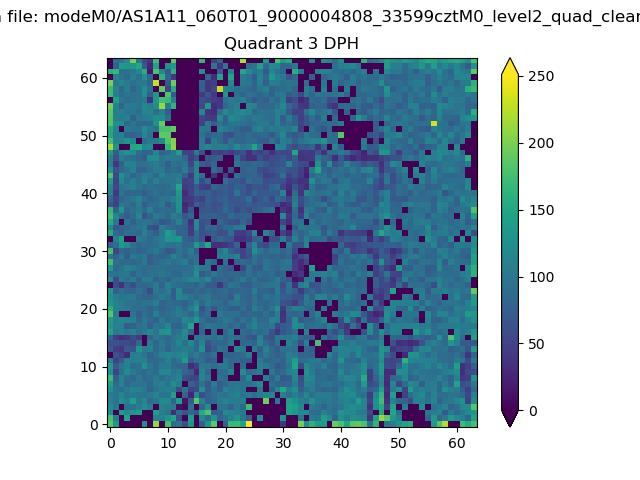 |
 |
Quadrant C |
| Plot type | Count rate plots | Images |
|---|---|---|
| Comparison with Poisson distribution Blue bars denote a histogram of data divided into 1 sec bins. Red curve is a Poisson curve with rate = median count rate of data. |
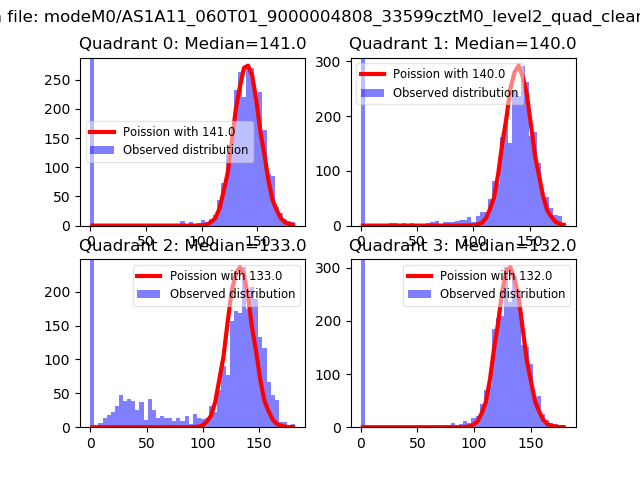 |
 |
| Quadrant-wise count rates Data is divided into 100 sec bins |
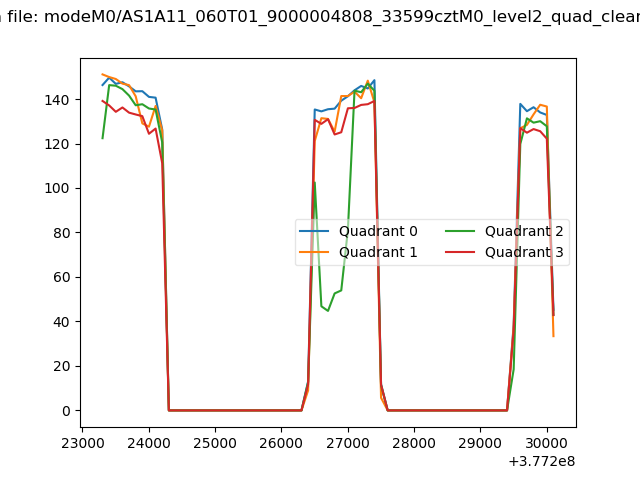 |
|
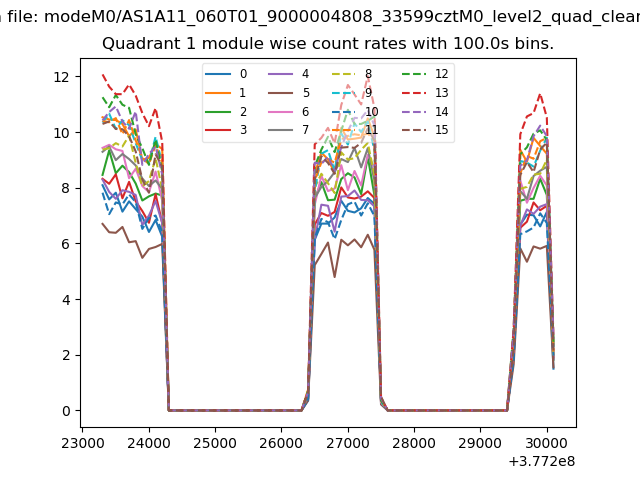
| Module-wise count rates for Quadrant A Data is divided into 100 sec bins |
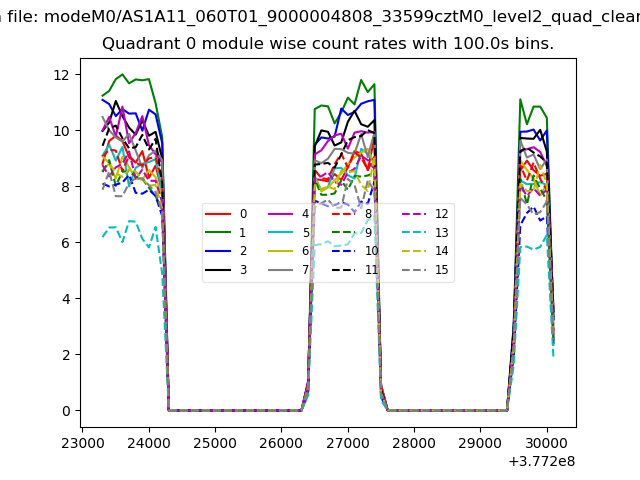 |
 |
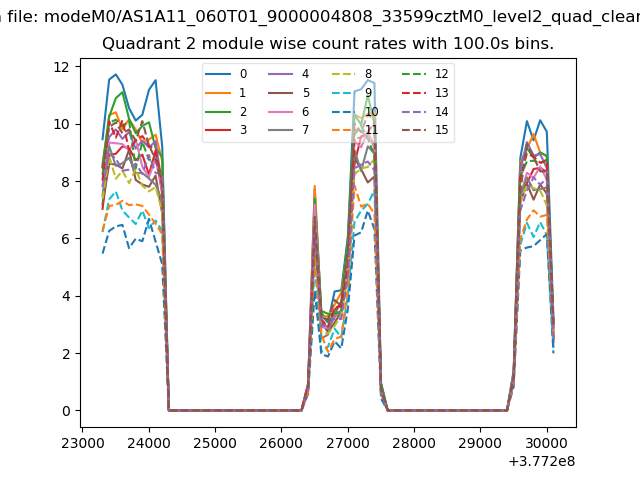
| Module-wise count rates for Quadrant B Data is divided into 100 sec bins |
 |
 |
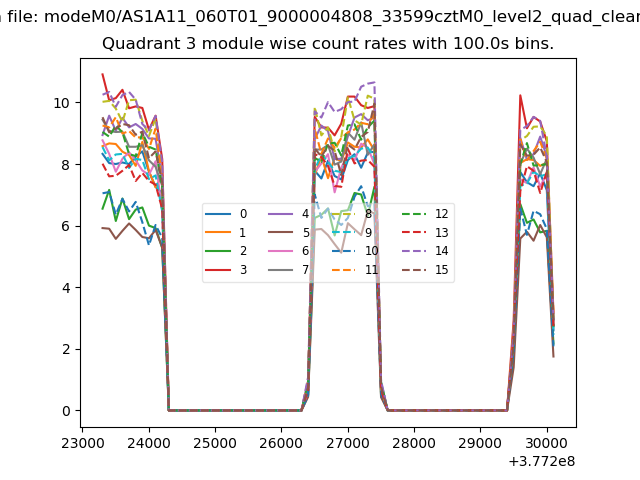
| Module-wise count rates for Quadrant C Data is divided into 100 sec bins |
 |
 |
| Module-wise count rates for Quadrant D Data is divided into 100 sec bins |
 |
 |
| Parameter | Plot |
|---|---|
| CZT HV Monitor | 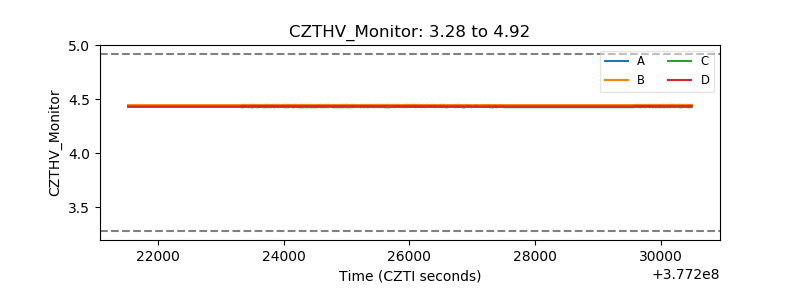 |
| D_VDD | 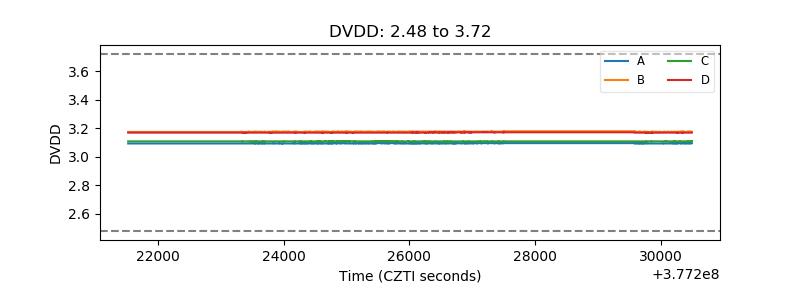 |
| Temperature 1 | 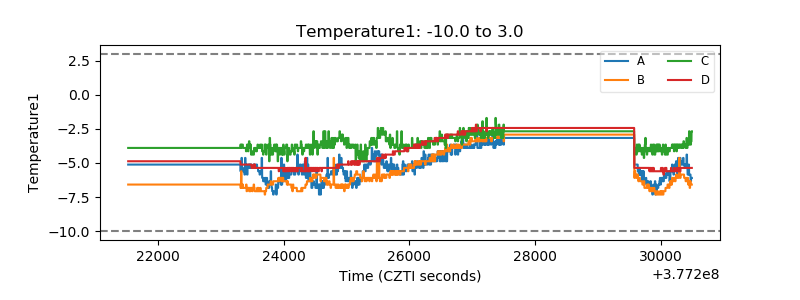 |
| Veto HV Monitor | 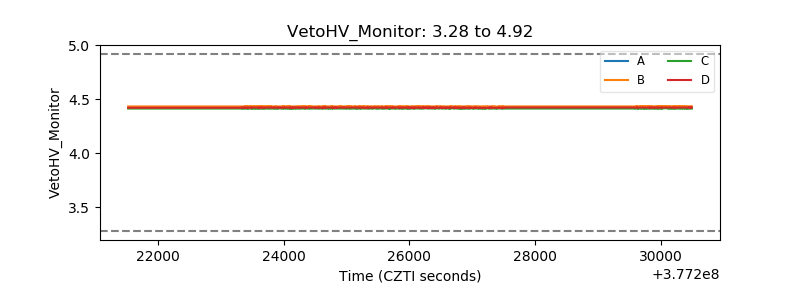 |
| Veto LLD | 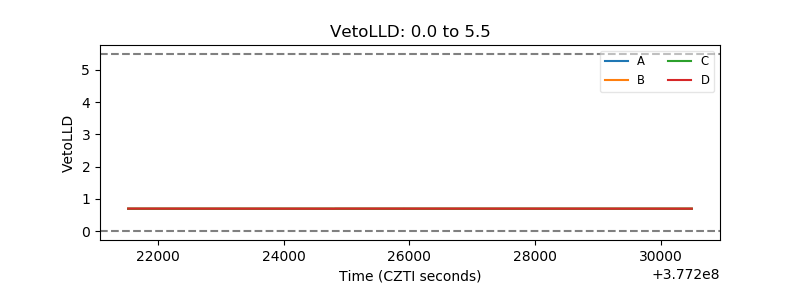 |
| Alpha Counter | 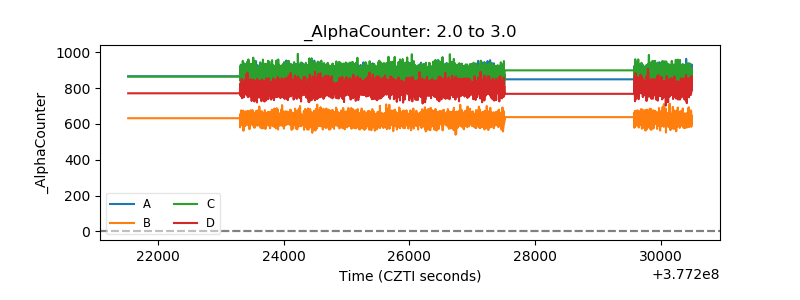 |
| _CPM_Rate | 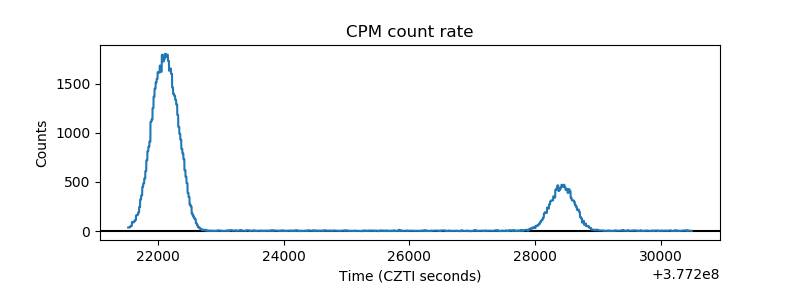 |
| CZT Counter | 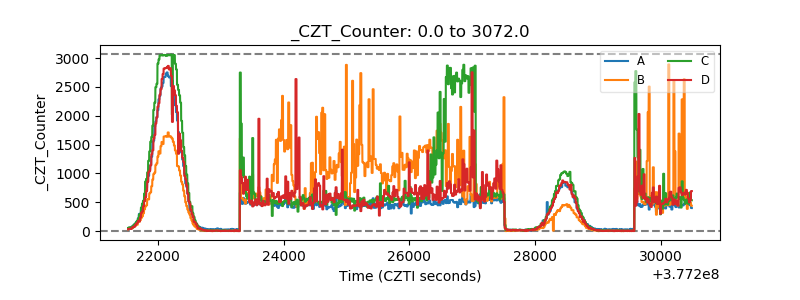 |
| +2.5 Volts monitor |  |
| +5 Volts monitor |  |
| _ROLL_ROT | 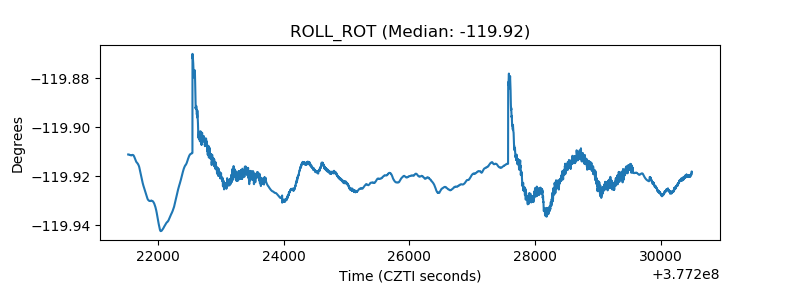 |
| _Roll_DEC | 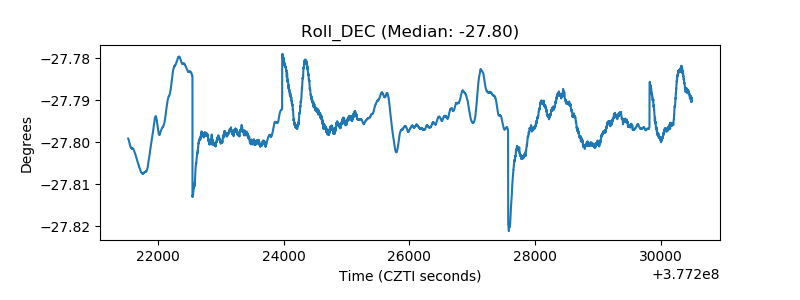 |
| _Roll_RA | 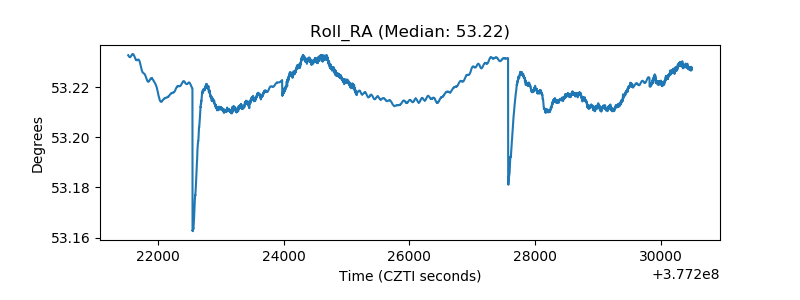 |
| Veto Counter | 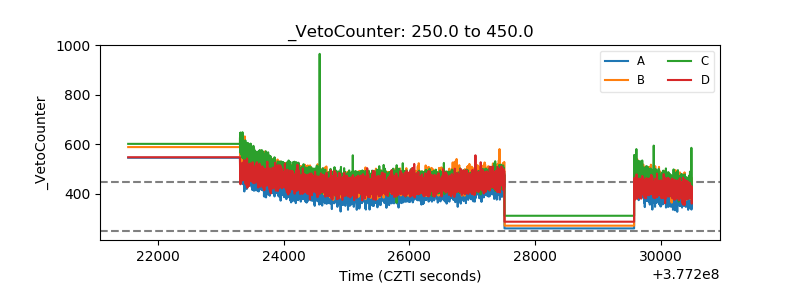 |