| Param | Original file | Final file |
|---|---|---|
| Filename | modeM0/AS1A11_060T01_9000004808_33601cztM0_level2.evt | modeM0/AS1A11_060T01_9000004808_33601cztM0_level2_quad_clean.evt |
| Size (bytes) | 572,016,960 | 68,584,320 |
| Size | 545.5 MB | 65.4 MB |
| Events in quadrant A | 3,230,403 | 422,347 |
| Events in quadrant B | 4,833,466 | 401,933 |
| Events in quadrant C | 3,901,059 | 413,652 |
| Events in quadrant D | 4,930,374 | 396,940 |
| Mode M0 | |||
|---|---|---|---|
| Quadrant | BADHDUFLAG | Total packets | Discarded packets |
| A | 0 | 13665 | 3 |
| B | 0 | 18509 | 2 |
| C | 0 | 15381 | 2 |
| D | 0 | 18893 | 2 |
| Mode M9 | |||
|---|---|---|---|
| Quadrant | BADHDUFLAG | Total packets | Discarded packets |
| A | 0 | 34 | 0 |
| B | 0 | 34 | 0 |
| C | 0 | 34 | 0 |
| D | 0 | 34 | 0 |
| Mode SS | |||
|---|---|---|---|
| Quadrant | BADHDUFLAG | Total packets | Discarded packets |
| A | 0 | 128 | 0 |
| B | 0 | 128 | 0 |
| C | 0 | 128 | 0 |
| D | 0 | 128 | 0 |
| Quadrant | Total seconds | Saturated seconds | Saturation percentage |
|---|---|---|---|
| A | 6336 | 60 | 0.946970% |
| B | 6336 | 558 | 8.806818% |
| C | 6336 | 79 | 1.246843% |
| D | 6336 | 160 | 2.525253% |
Noise dominated data is calculated using 1-second bins in cleaned event files. If a bin has >2000 counts, and if more than 50% of those come from <1% of pixels, then it is considered to be noise-dominated and hence unusable.
| Quadrant | # 1 sec bins | Bins with >0 counts | Bins with >2000 counts | High rate bins dominated by noise | Noise dominated (total time) | Noise dominated (detector-on time) | Marked lightcurve |
|---|---|---|---|---|---|---|---|
| A | 9622 | 6338 | 25 | 25 | 0.26% | 0.39% | 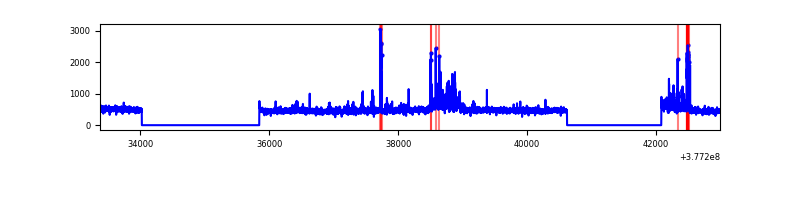 |
| B | 9622 | 6338 | 421 | 421 | 4.38% | 6.64% | 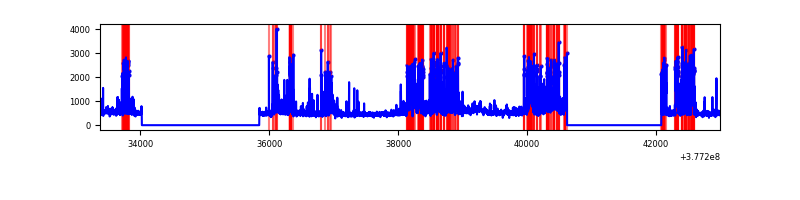 |
| C | 9622 | 6338 | 70 | 70 | 0.73% | 1.10% | 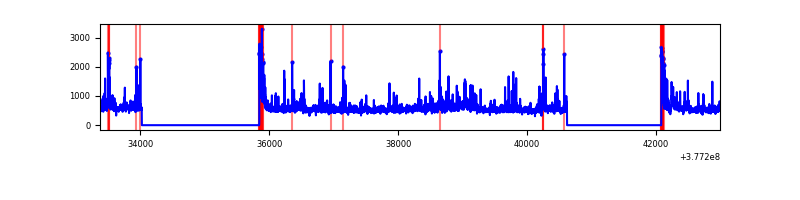 |
| D | 9622 | 6338 | 136 | 136 | 1.41% | 2.15% | 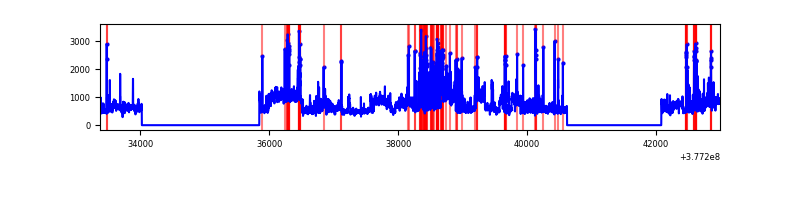 |
Top three noisy pixels from each quadrant. If the there are fewer than three noisy pixels in the level2.evt file, extra rows are filled as -1
| Pixel properties | Quadrant properties | ||||||
|---|---|---|---|---|---|---|---|
| Quadrant | DetID | PixID | Counts | Sigma | Mean | Median | Sigma |
| A | 15 | 169 | 352807 | 2360.87 | 743 | 729 | 149.1 |
| A | 13 | 254 | 9746 | 60.46 | 743 | 729 | 149.1 |
| A | 3 | 137 | 7592 | 46.02 | 743 | 729 | 149.1 |
| B | 5 | 172 | 1440407 | 10266.14 | 718 | 698 | 140.2 |
| B | 15 | 222 | 233712 | 1661.55 | 718 | 698 | 140.2 |
| B | 5 | 255 | 222776 | 1583.57 | 718 | 698 | 140.2 |
| C | 3 | 233 | 422099 | 2501.07 | 723 | 728 | 168.5 |
| C | 0 | 10 | 274230 | 1623.38 | 723 | 728 | 168.5 |
| C | 15 | 214 | 271381 | 1606.47 | 723 | 728 | 168.5 |
| D | 8 | 195 | 1308365 | 7416.05 | 717 | 697 | 176.3 |
| D | 2 | 250 | 292106 | 1652.64 | 717 | 697 | 176.3 |
| D | 2 | 120 | 204781 | 1157.4 | 717 | 697 | 176.3 |
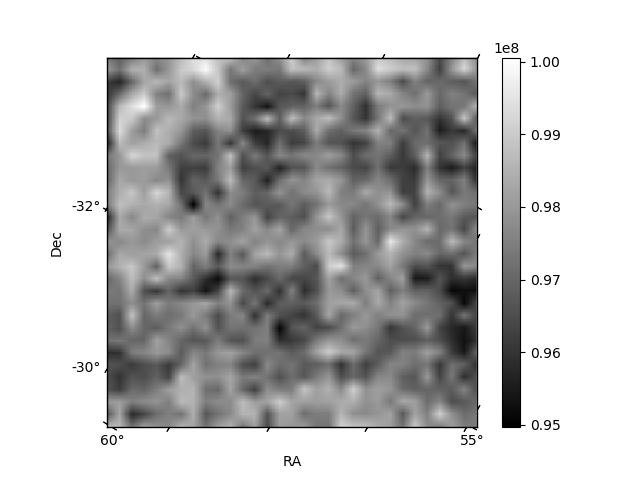
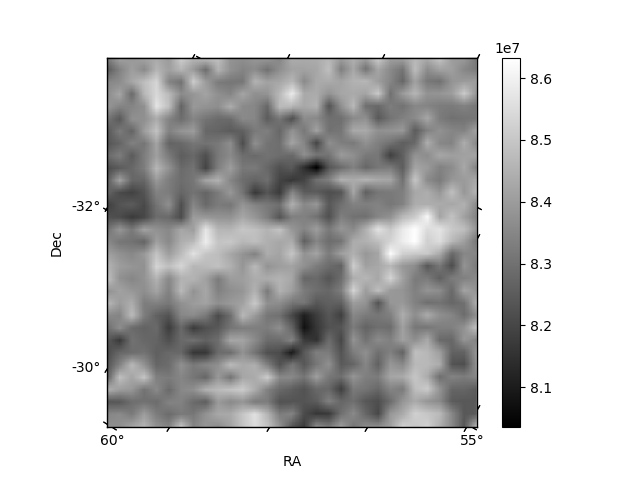
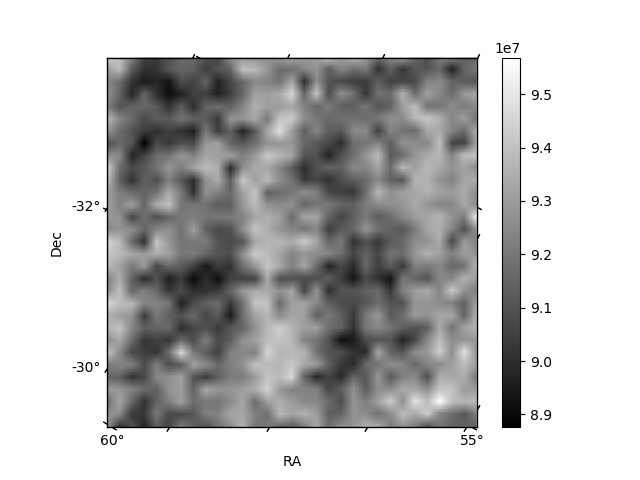
Histogram calculated using DETX and DETY for each event in the final _common_clean file
| Quadrant A | 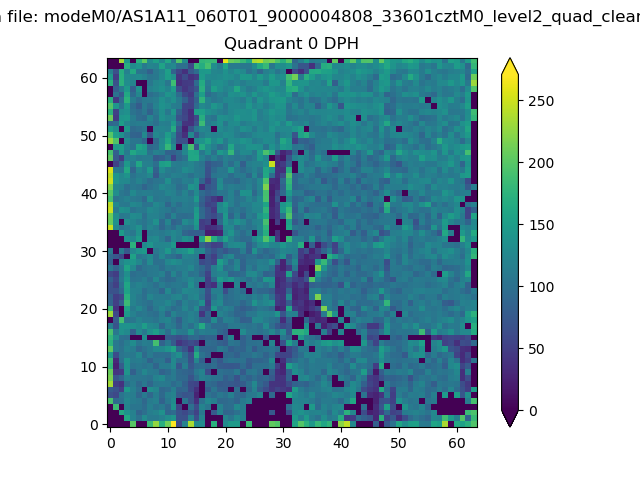 |
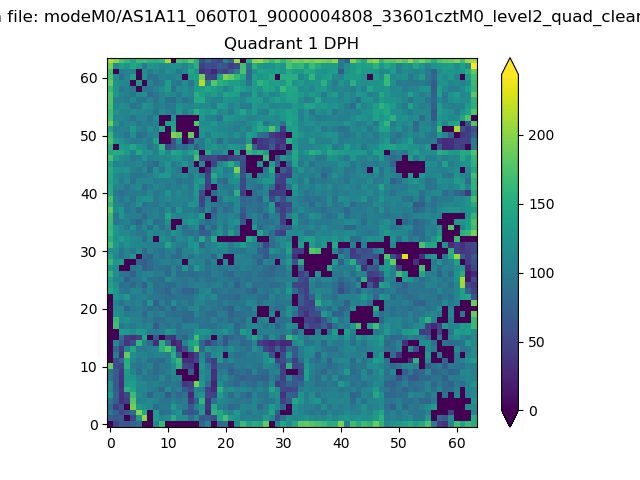 |
Quadrant B |
|---|---|---|---|
| Quadrant D | 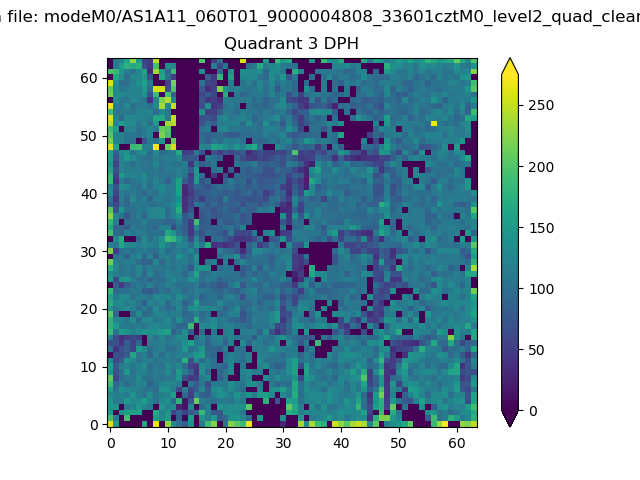 |
 |
Quadrant C |
| Plot type | Count rate plots | Images |
|---|---|---|
| Comparison with Poisson distribution Blue bars denote a histogram of data divided into 1 sec bins. Red curve is a Poisson curve with rate = median count rate of data. |
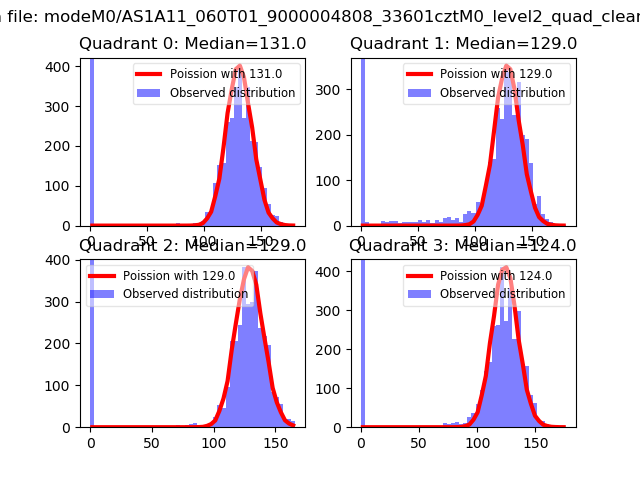 |
 |
| Quadrant-wise count rates Data is divided into 100 sec bins |
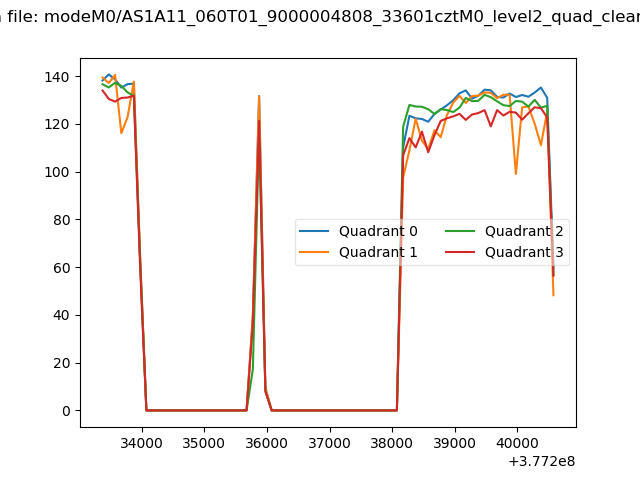 |
|
| Module-wise count rates for Quadrant A Data is divided into 100 sec bins |
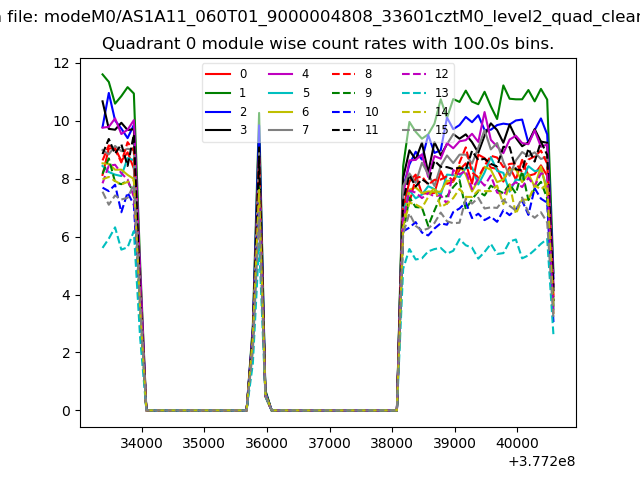 |
 |
| Module-wise count rates for Quadrant B Data is divided into 100 sec bins |
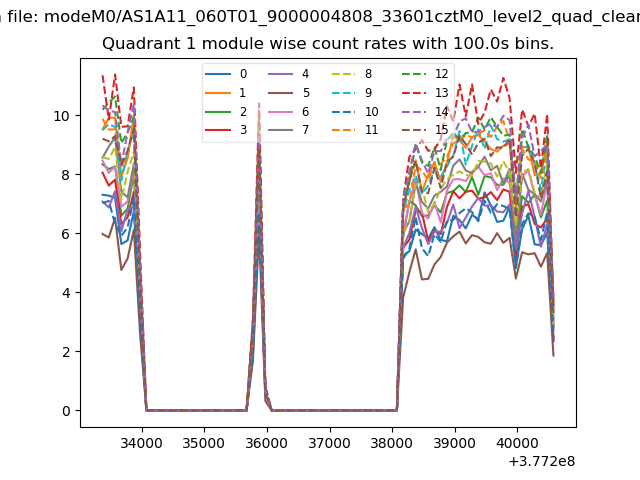 |
 |
| Module-wise count rates for Quadrant C Data is divided into 100 sec bins |
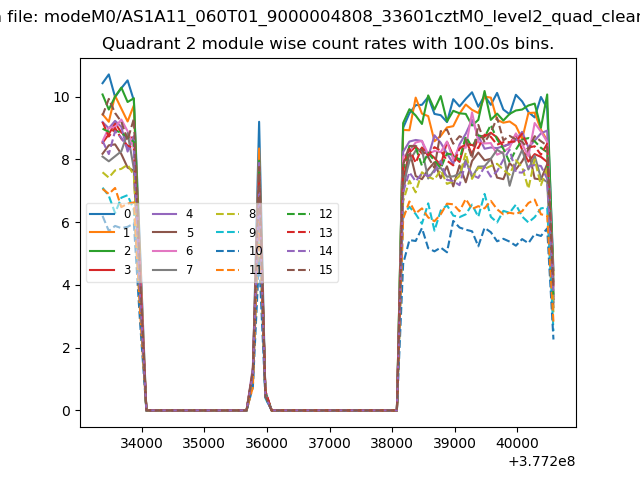 |
 |
| Module-wise count rates for Quadrant D Data is divided into 100 sec bins |
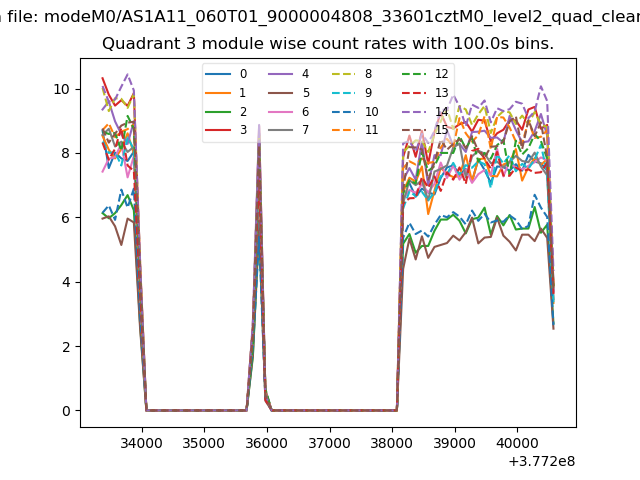 |
 |
| Parameter | Plot |
|---|---|
| CZT HV Monitor | 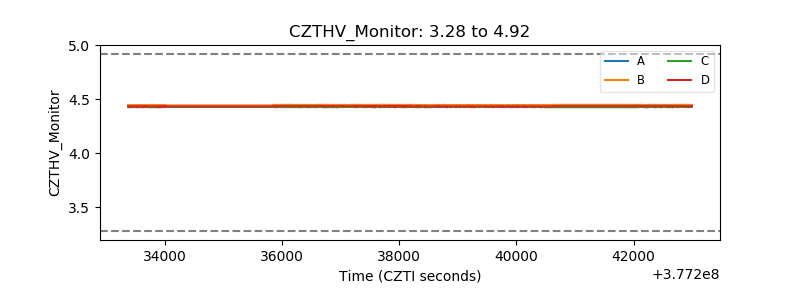 |
| D_VDD | 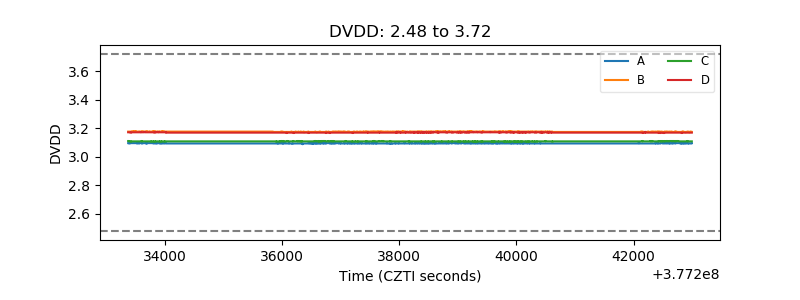 |
| Temperature 1 | 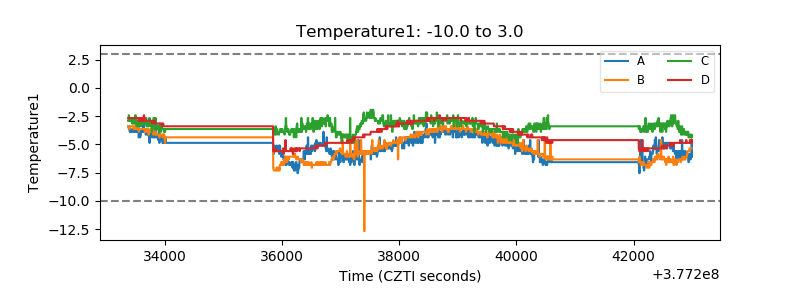 |
| Veto HV Monitor | 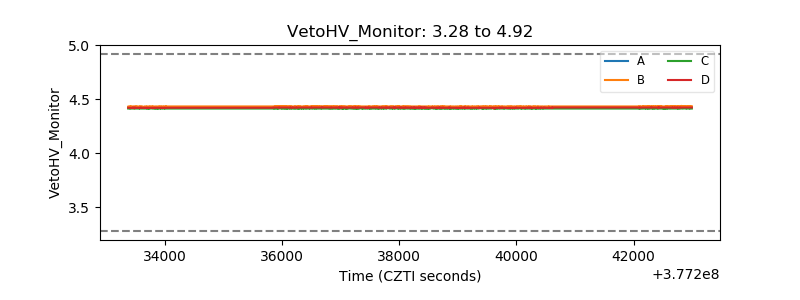 |
| Veto LLD | 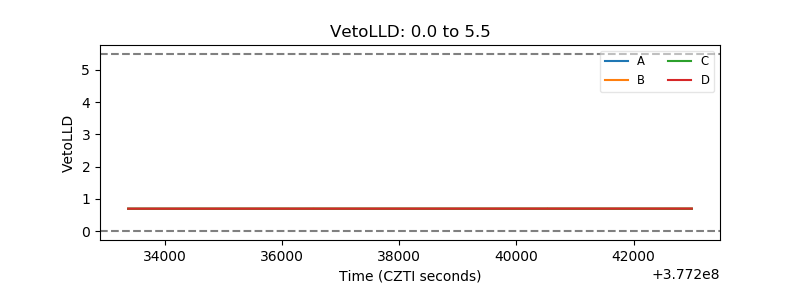 |
| Alpha Counter | 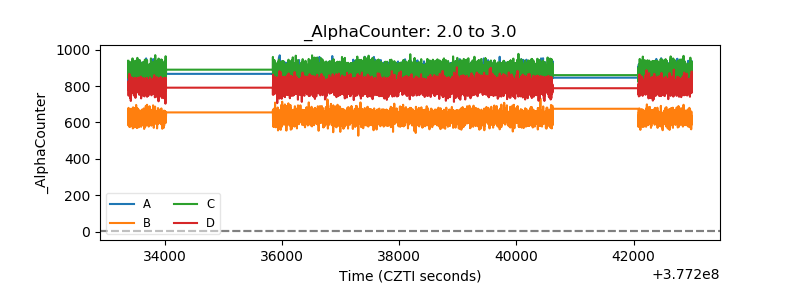 |
| _CPM_Rate | 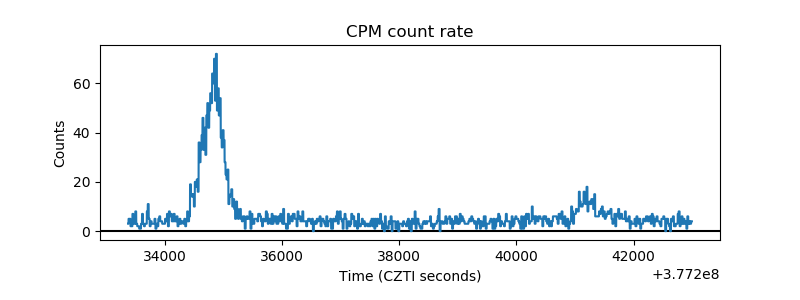 |
| CZT Counter | 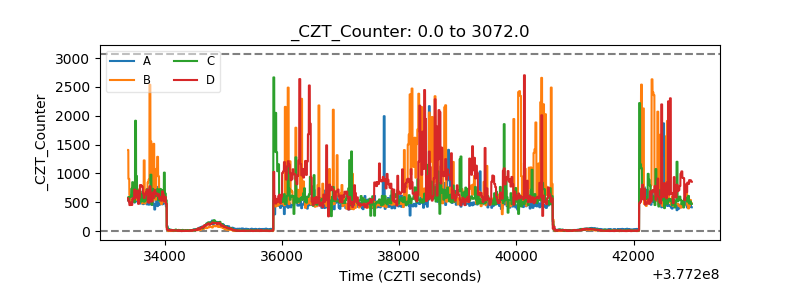 |
| +2.5 Volts monitor |  |
| +5 Volts monitor |  |
| _ROLL_ROT | 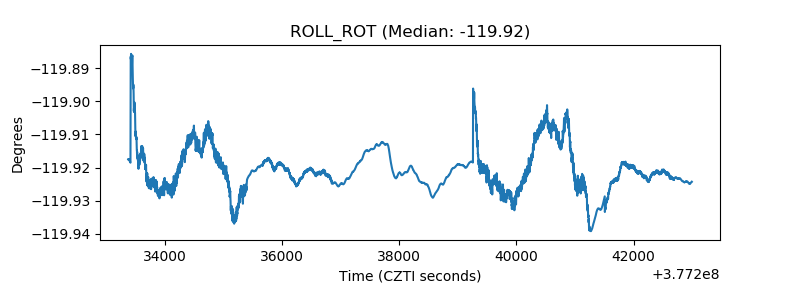 |
| _Roll_DEC | 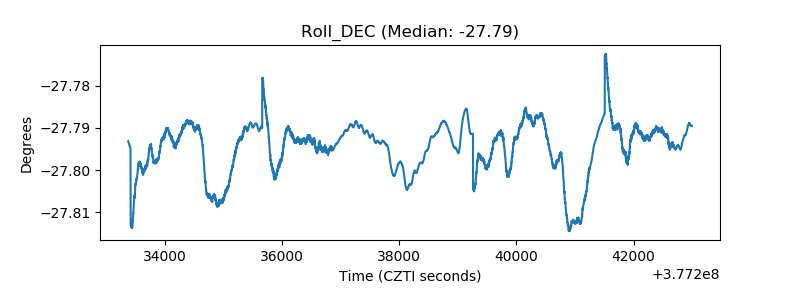 |
| _Roll_RA | 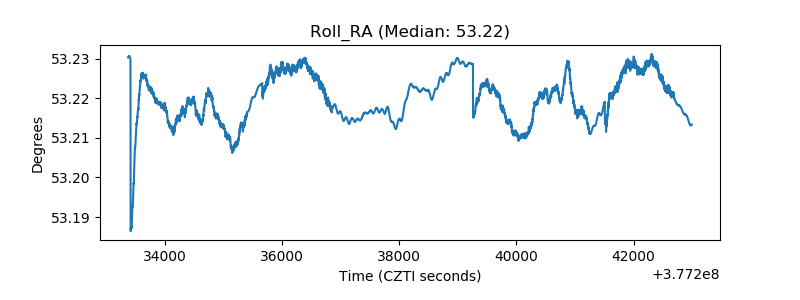 |
| Veto Counter | 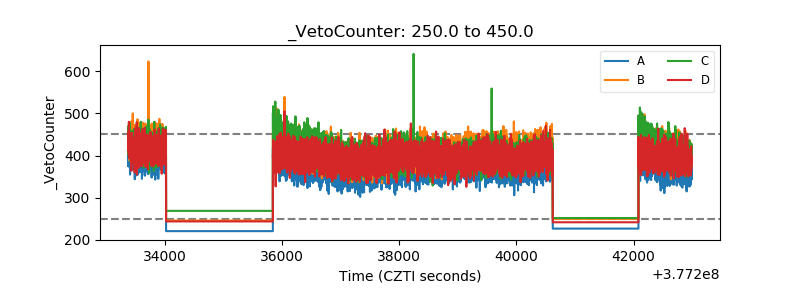 |