| Param | Original file | Final file |
|---|---|---|
| Filename | modeM0/AS1A11_060T01_9000004808_33602cztM0_level2.evt | modeM0/AS1A11_060T01_9000004808_33602cztM0_level2_quad_clean.evt |
| Size (bytes) | 547,139,520 | 66,363,840 |
| Size | 521.8 MB | 63.3 MB |
| Events in quadrant A | 3,706,565 | 395,762 |
| Events in quadrant B | 4,749,371 | 394,512 |
| Events in quadrant C | 3,490,297 | 403,475 |
| Events in quadrant D | 4,210,870 | 389,468 |
| Mode M0 | |||
|---|---|---|---|
| Quadrant | BADHDUFLAG | Total packets | Discarded packets |
| A | 0 | 15030 | 3 |
| B | 0 | 18069 | 2 |
| C | 0 | 13915 | 2 |
| D | 0 | 16617 | 2 |
| Mode M9 | |||
|---|---|---|---|
| Quadrant | BADHDUFLAG | Total packets | Discarded packets |
| A | 0 | 28 | 0 |
| B | 0 | 28 | 0 |
| C | 0 | 28 | 0 |
| D | 0 | 28 | 0 |
| Mode SS | |||
|---|---|---|---|
| Quadrant | BADHDUFLAG | Total packets | Discarded packets |
| A | 0 | 124 | 0 |
| B | 0 | 124 | 0 |
| C | 0 | 124 | 0 |
| D | 0 | 124 | 0 |
| Quadrant | Total seconds | Saturated seconds | Saturation percentage |
|---|---|---|---|
| A | 6106 | 202 | 3.308221% |
| B | 6106 | 542 | 8.876515% |
| C | 6106 | 64 | 1.048149% |
| D | 6106 | 90 | 1.473960% |
Noise dominated data is calculated using 1-second bins in cleaned event files. If a bin has >2000 counts, and if more than 50% of those come from <1% of pixels, then it is considered to be noise-dominated and hence unusable.
| Quadrant | # 1 sec bins | Bins with >0 counts | Bins with >2000 counts | High rate bins dominated by noise | Noise dominated (total time) | Noise dominated (detector-on time) | Marked lightcurve |
|---|---|---|---|---|---|---|---|
| A | 8882 | 6108 | 135 | 135 | 1.52% | 2.21% | 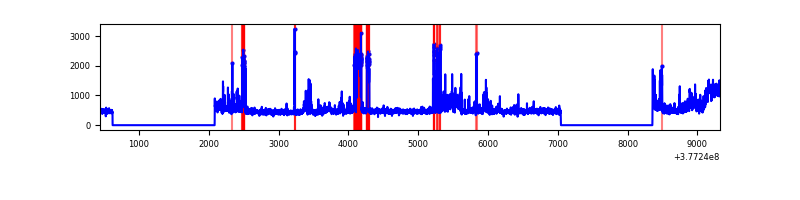 |
| B | 8882 | 6108 | 413 | 413 | 4.65% | 6.76% | 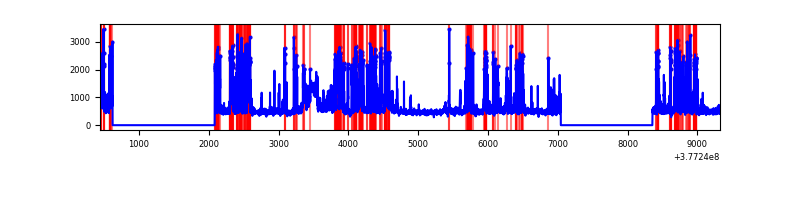 |
| C | 8882 | 6108 | 55 | 55 | 0.62% | 0.90% | 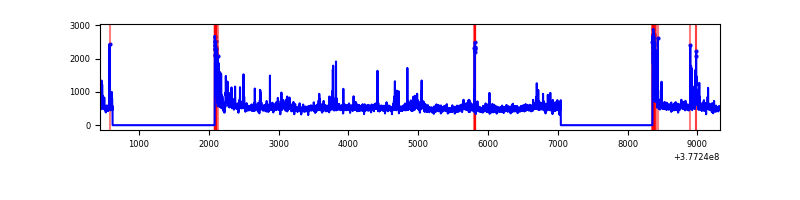 |
| D | 8882 | 6108 | 75 | 75 | 0.84% | 1.23% | 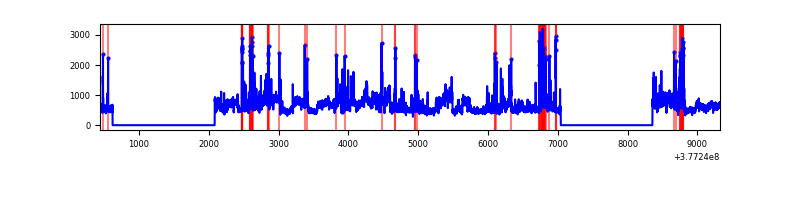 |
Top three noisy pixels from each quadrant. If the there are fewer than three noisy pixels in the level2.evt file, extra rows are filled as -1
| Pixel properties | Quadrant properties | ||||||
|---|---|---|---|---|---|---|---|
| Quadrant | DetID | PixID | Counts | Sigma | Mean | Median | Sigma |
| A | 15 | 169 | 1003773 | 7221.04 | 694 | 680 | 138.9 |
| A | 7 | 191 | 13572 | 92.81 | 694 | 680 | 138.9 |
| A | 13 | 254 | 9277 | 61.89 | 694 | 680 | 138.9 |
| B | 5 | 172 | 1763949 | 13273.11 | 682 | 663 | 132.8 |
| B | 4 | 251 | 103345 | 772.94 | 682 | 663 | 132.8 |
| B | 15 | 222 | 68042 | 507.19 | 682 | 663 | 132.8 |
| C | 3 | 233 | 327429 | 2024.14 | 690 | 693 | 161.4 |
| C | 15 | 214 | 262030 | 1618.99 | 690 | 693 | 161.4 |
| C | 0 | 10 | 195120 | 1204.48 | 690 | 693 | 161.4 |
| D | 8 | 195 | 986159 | 5794.31 | 688 | 668 | 170.1 |
| D | 2 | 250 | 194292 | 1138.43 | 688 | 668 | 170.1 |
| D | 2 | 120 | 160415 | 939.25 | 688 | 668 | 170.1 |
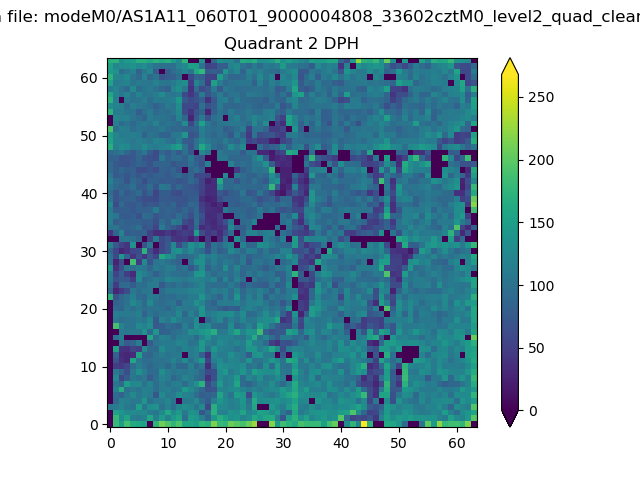
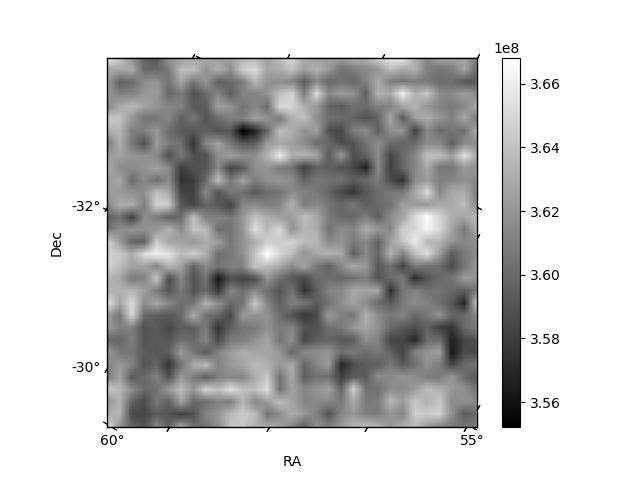
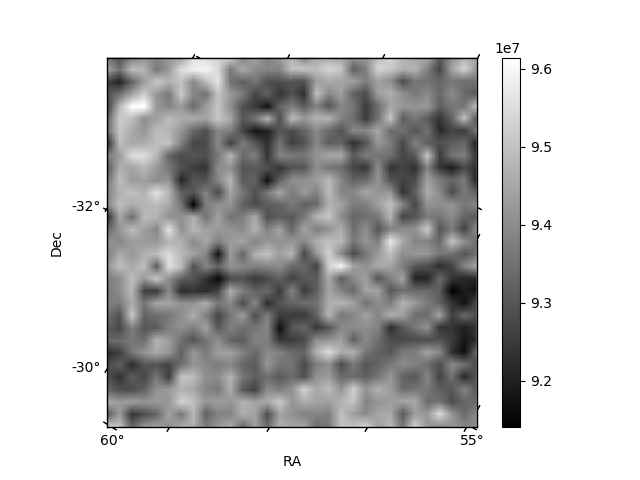
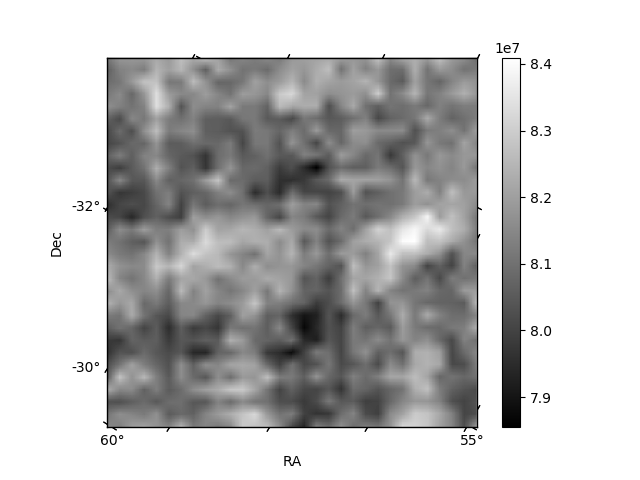
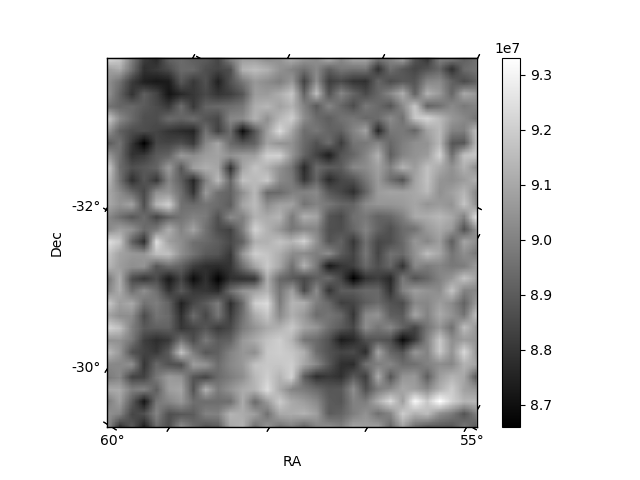
Histogram calculated using DETX and DETY for each event in the final _common_clean file
| Quadrant A | 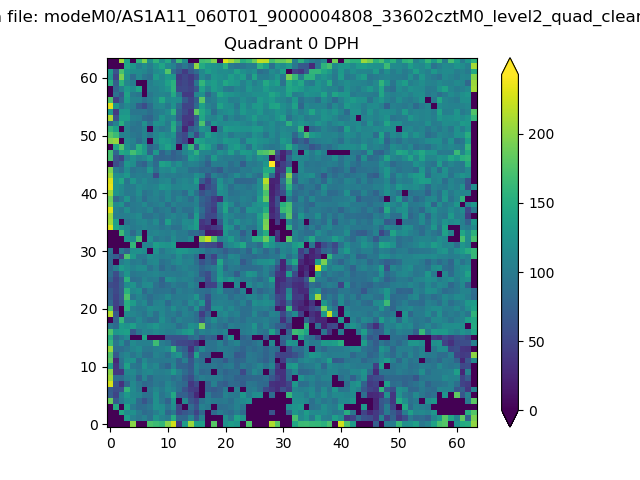 |
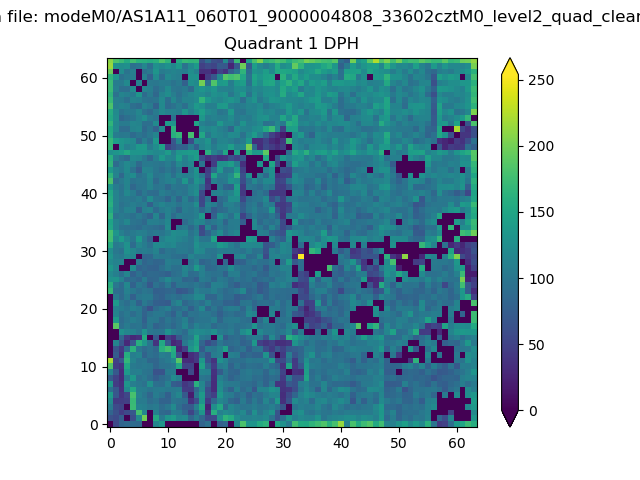 |
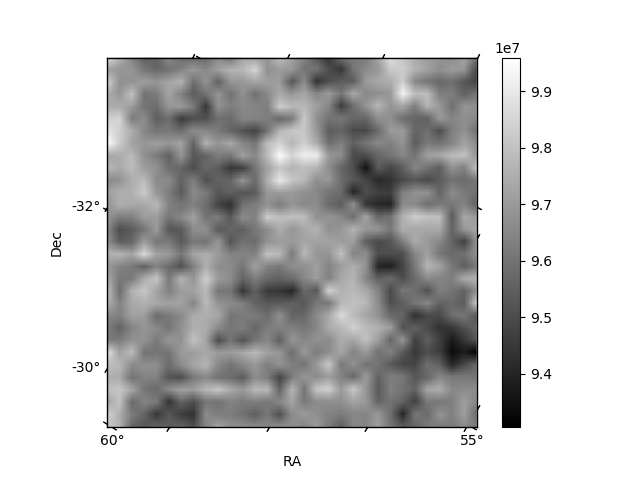
Quadrant B |
|---|---|---|---|
| Quadrant D | 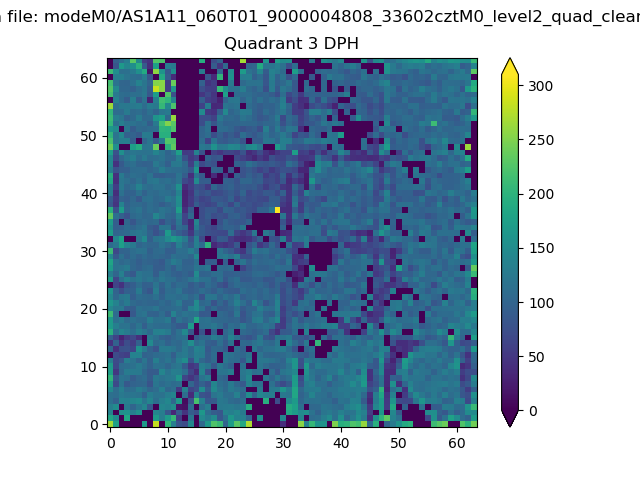 |
 |
Quadrant C |
| Plot type | Count rate plots | Images |
|---|---|---|
| Comparison with Poisson distribution Blue bars denote a histogram of data divided into 1 sec bins. Red curve is a Poisson curve with rate = median count rate of data. |
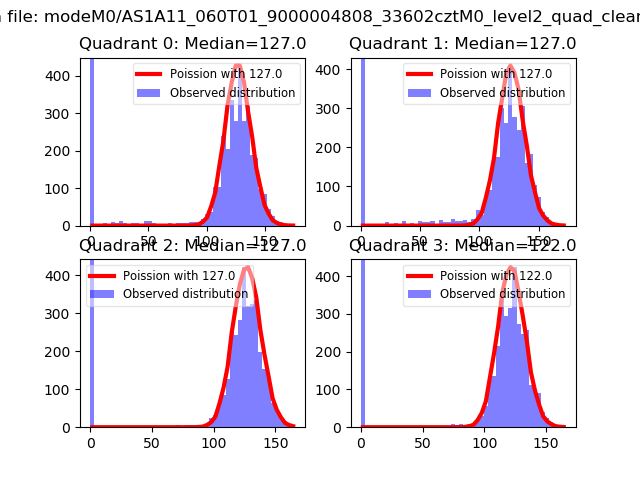 |
 |
| Quadrant-wise count rates Data is divided into 100 sec bins |
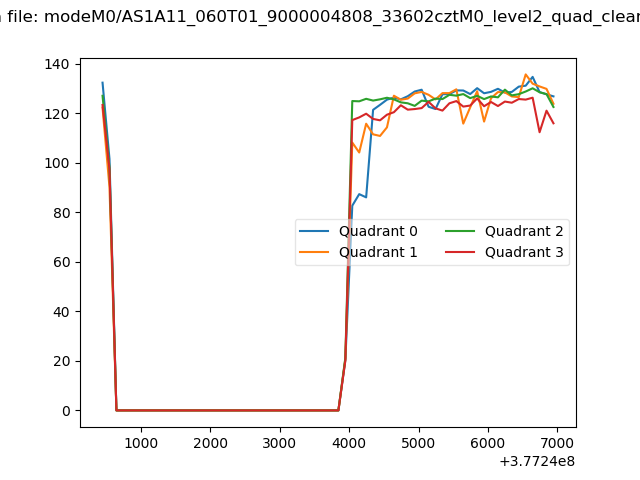 |
|
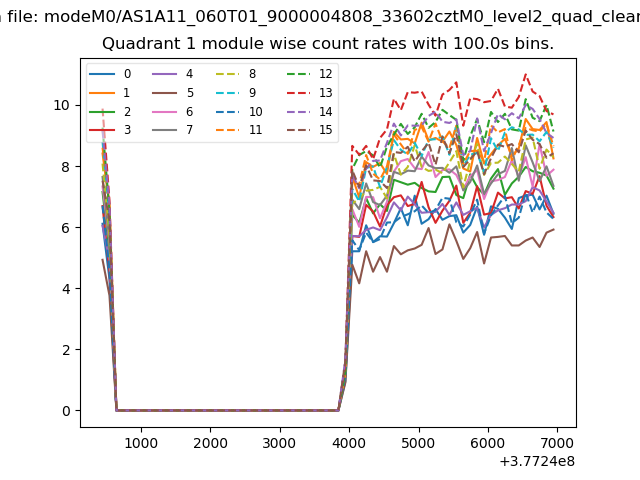
| Module-wise count rates for Quadrant A Data is divided into 100 sec bins |
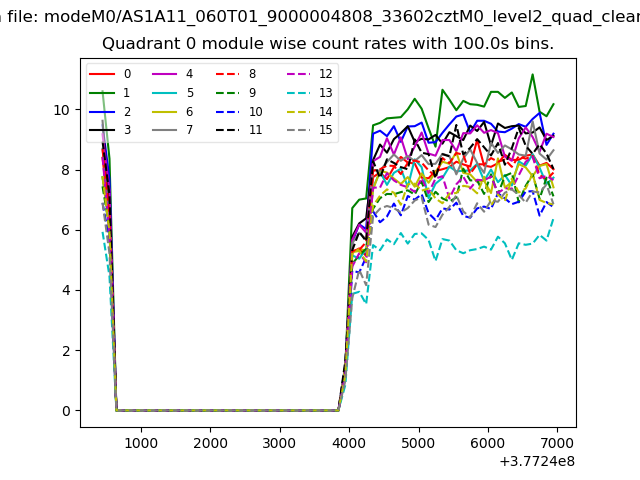 |
 |
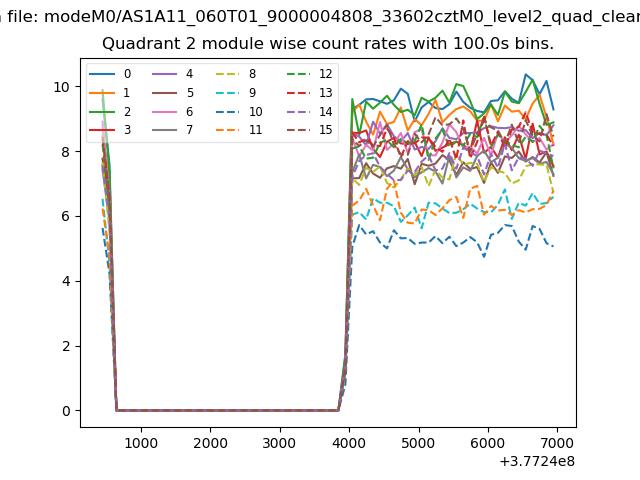
| Module-wise count rates for Quadrant B Data is divided into 100 sec bins |
 |
 |
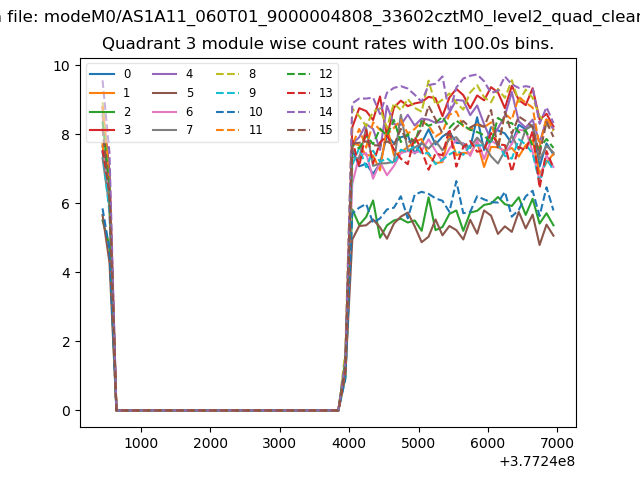
| Module-wise count rates for Quadrant C Data is divided into 100 sec bins |
 |
 |
| Module-wise count rates for Quadrant D Data is divided into 100 sec bins |
 |
 |
| Parameter | Plot |
|---|---|
| CZT HV Monitor | 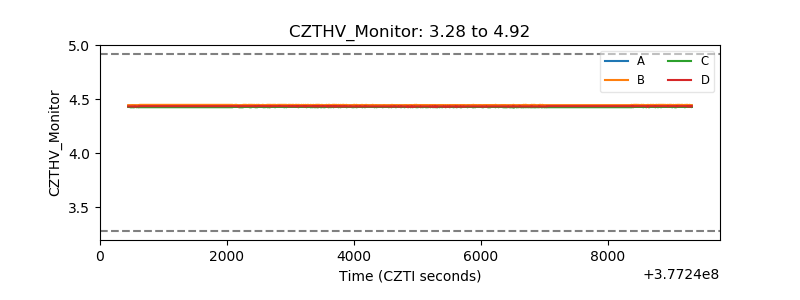 |
| D_VDD | 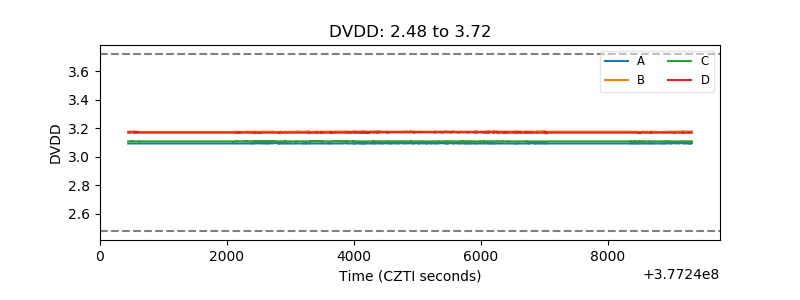 |
| Temperature 1 | 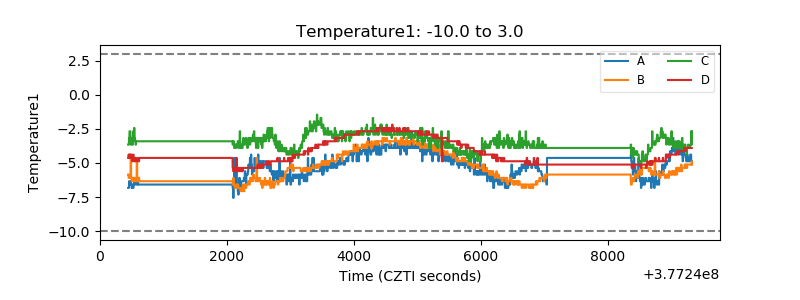 |
| Veto HV Monitor | 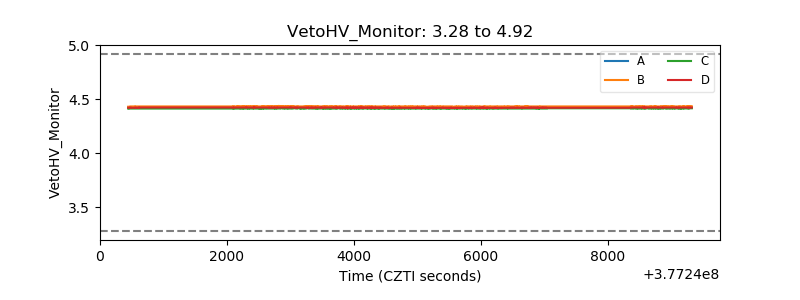 |
| Veto LLD | 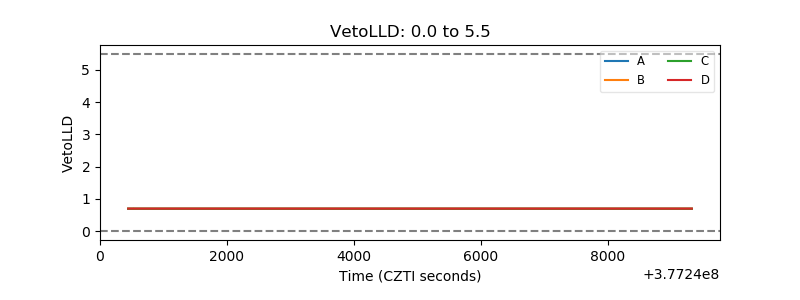 |
| Alpha Counter | 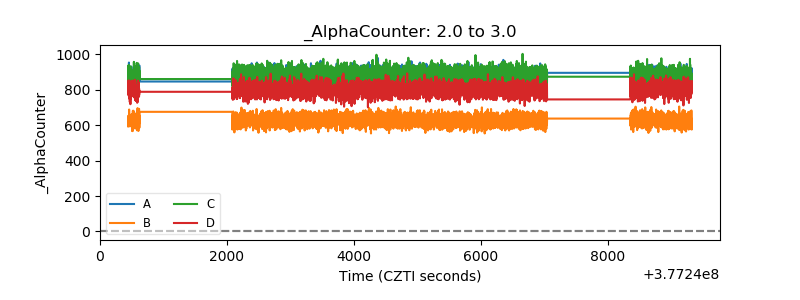 |
| _CPM_Rate | 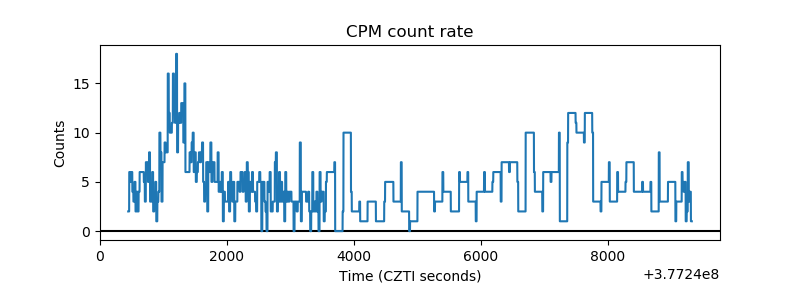 |
| CZT Counter | 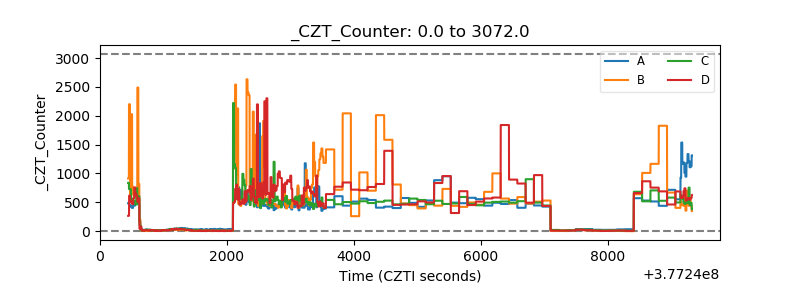 |
| +2.5 Volts monitor |  |
| +5 Volts monitor |  |
| _ROLL_ROT | 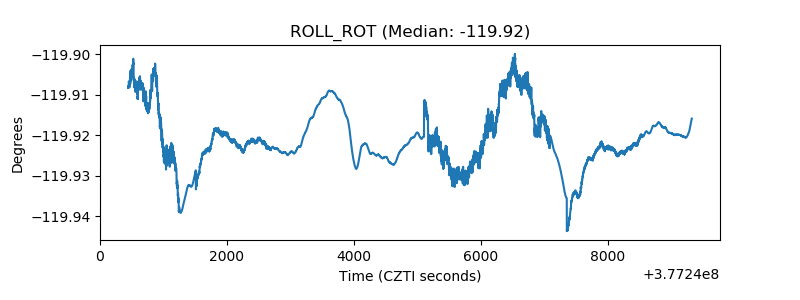 |
| _Roll_DEC | 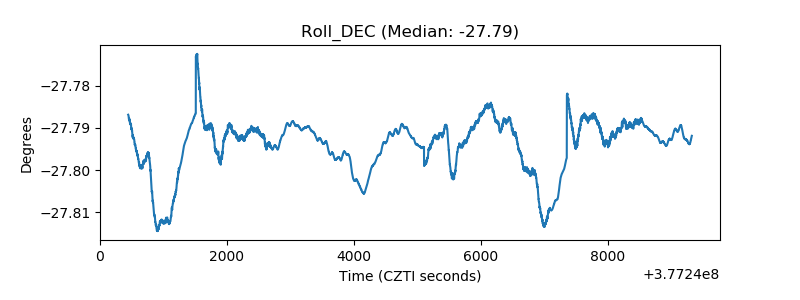 |
| _Roll_RA | 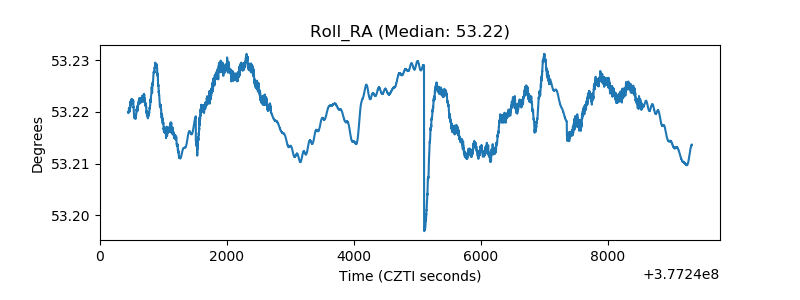 |
| Veto Counter | 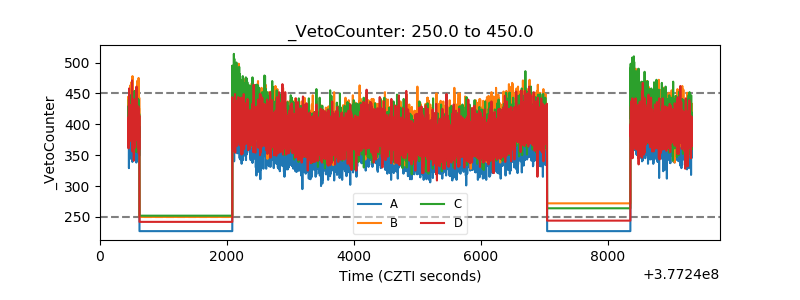 |