| Param | Original file | Final file |
|---|---|---|
| Filename | modeM0/AS1A11_060T01_9000004808_33603cztM0_level2.evt | modeM0/AS1A11_060T01_9000004808_33603cztM0_level2_quad_clean.evt |
| Size (bytes) | 340,876,800 | 43,240,320 |
| Size | 325.1 MB | 41.2 MB |
| Events in quadrant A | 2,035,794 | 272,823 |
| Events in quadrant B | 3,340,229 | 247,432 |
| Events in quadrant C | 2,016,242 | 270,044 |
| Events in quadrant D | 2,678,893 | 256,493 |
| Mode M0 | |||
|---|---|---|---|
| Quadrant | BADHDUFLAG | Total packets | Discarded packets |
| A | 0 | 8556 | 1 |
| B | 0 | 12326 | 1 |
| C | 0 | 8156 | 1 |
| D | 0 | 10574 | 1 |
| Mode M9 | |||
|---|---|---|---|
| Quadrant | BADHDUFLAG | Total packets | Discarded packets |
| A | 0 | 6 | 0 |
| B | 0 | 6 | 0 |
| C | 0 | 6 | 0 |
| D | 0 | 7 | 0 |
| Mode SS | |||
|---|---|---|---|
| Quadrant | BADHDUFLAG | Total packets | Discarded packets |
| A | 0 | 74 | 0 |
| B | 0 | 74 | 0 |
| C | 0 | 74 | 0 |
| D | 0 | 74 | 0 |
| Quadrant | Total seconds | Saturated seconds | Saturation percentage |
|---|---|---|---|
| A | 3703 | 10 | 0.270051% |
| B | 3703 | 612 | 16.527140% |
| C | 3703 | 33 | 0.891169% |
| D | 3703 | 63 | 1.701323% |
Noise dominated data is calculated using 1-second bins in cleaned event files. If a bin has >2000 counts, and if more than 50% of those come from <1% of pixels, then it is considered to be noise-dominated and hence unusable.
| Quadrant | # 1 sec bins | Bins with >0 counts | Bins with >2000 counts | High rate bins dominated by noise | Noise dominated (total time) | Noise dominated (detector-on time) | Marked lightcurve |
|---|---|---|---|---|---|---|---|
| A | 3703 | 3703 | 3 | 3 | 0.08% | 0.08% | 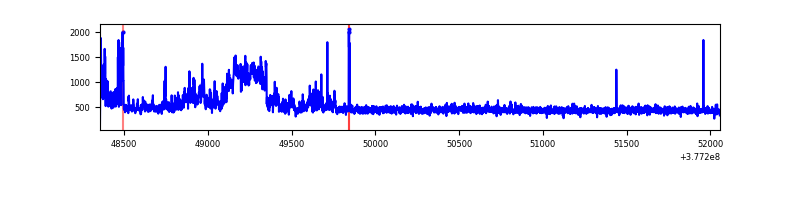 |
| B | 3703 | 3703 | 499 | 499 | 13.48% | 13.48% | 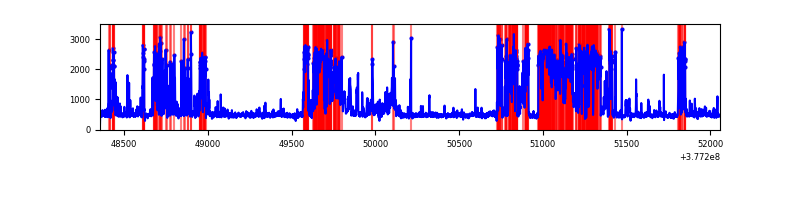 |
| C | 3703 | 3703 | 25 | 25 | 0.68% | 0.68% | 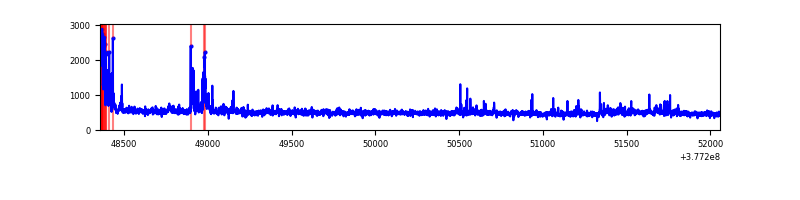 |
| D | 3703 | 3703 | 59 | 59 | 1.59% | 1.59% |  |
Top three noisy pixels from each quadrant. If the there are fewer than three noisy pixels in the level2.evt file, extra rows are filled as -1
| Pixel properties | Quadrant properties | ||||||
|---|---|---|---|---|---|---|---|
| Quadrant | DetID | PixID | Counts | Sigma | Mean | Median | Sigma |
| A | 15 | 169 | 387209 | 4461.1 | 425 | 416 | 86.7 |
| A | 13 | 254 | 5838 | 62.53 | 425 | 416 | 86.7 |
| A | 3 | 137 | 4297 | 44.76 | 425 | 416 | 86.7 |
| B | 5 | 172 | 1615873 | 20930.86 | 392 | 382 | 77.2 |
| B | 4 | 251 | 94949 | 1225.24 | 392 | 382 | 77.2 |
| B | 15 | 222 | 29469 | 376.86 | 392 | 382 | 77.2 |
| C | 3 | 233 | 159968 | 1645.97 | 410 | 412 | 96.9 |
| C | 15 | 214 | 158018 | 1625.85 | 410 | 412 | 96.9 |
| C | 0 | 10 | 95189 | 977.71 | 410 | 412 | 96.9 |
| D | 8 | 195 | 738970 | 7215.77 | 411 | 398 | 102.4 |
| D | 2 | 250 | 131712 | 1282.92 | 411 | 398 | 102.4 |
| D | 14 | 52 | 67309 | 653.71 | 411 | 398 | 102.4 |
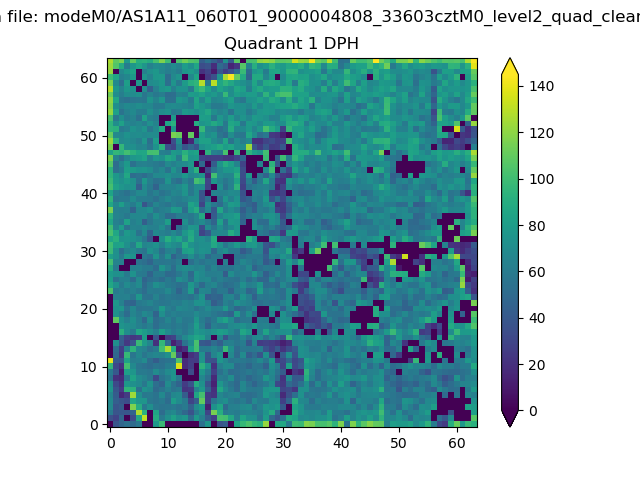
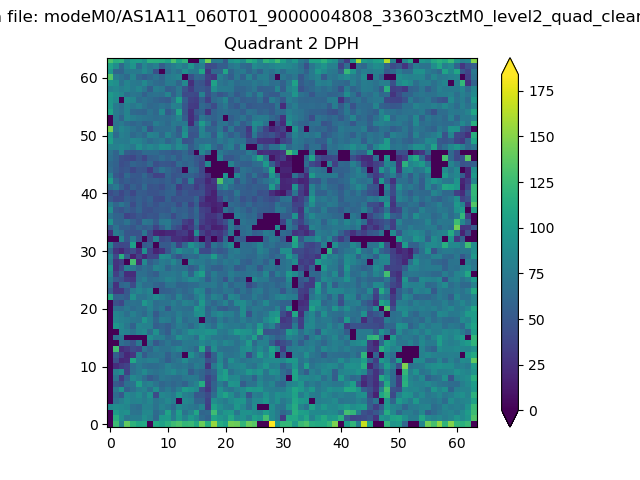
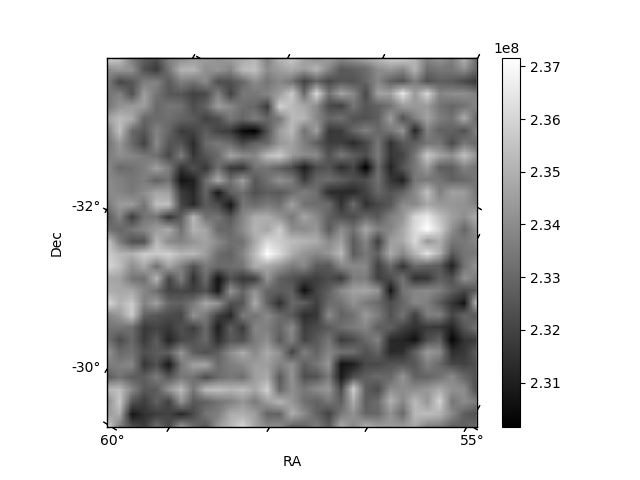
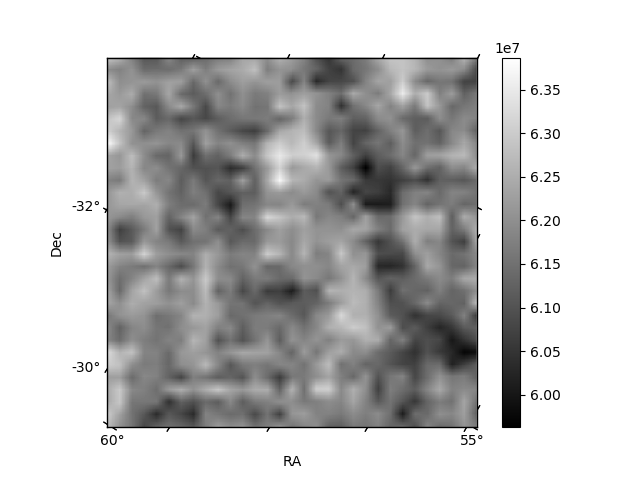
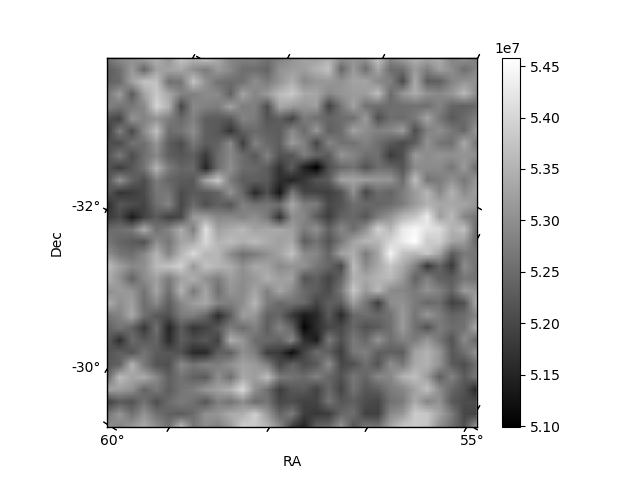
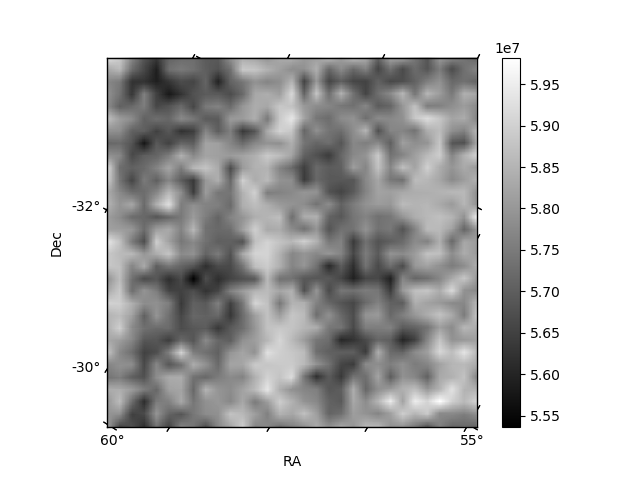
Histogram calculated using DETX and DETY for each event in the final _common_clean file
| Quadrant A | 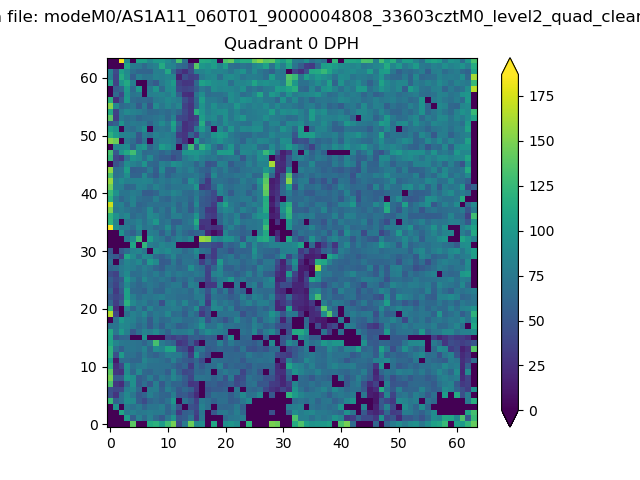 |
 |
Quadrant B |
|---|---|---|---|
| Quadrant D | 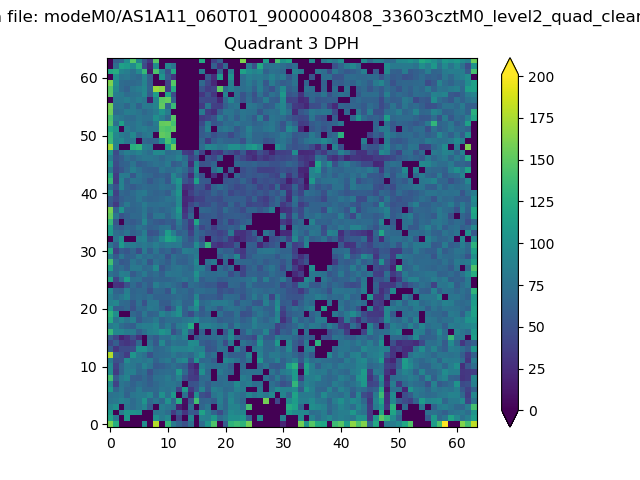 |
 |
Quadrant C |
| Plot type | Count rate plots | Images |
|---|---|---|
| Comparison with Poisson distribution Blue bars denote a histogram of data divided into 1 sec bins. Red curve is a Poisson curve with rate = median count rate of data. |
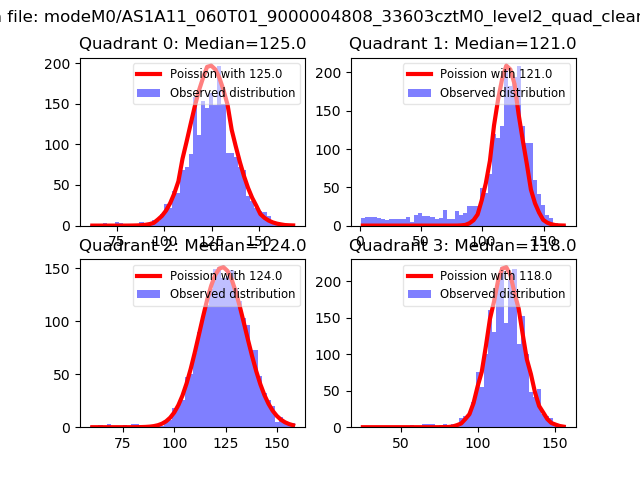 |
 |
| Quadrant-wise count rates Data is divided into 100 sec bins |
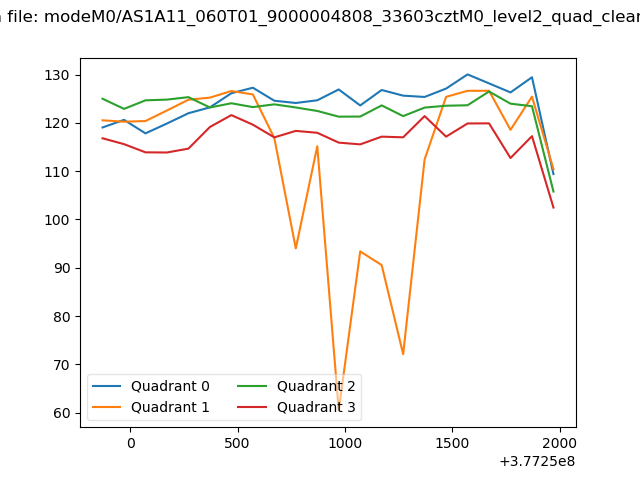 |
|
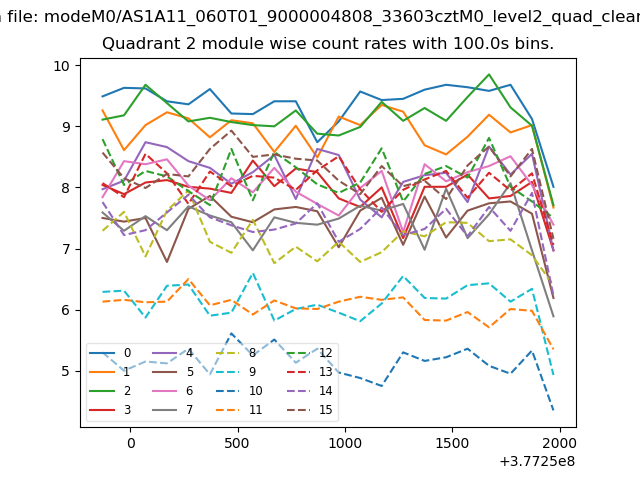
| Module-wise count rates for Quadrant A Data is divided into 100 sec bins |
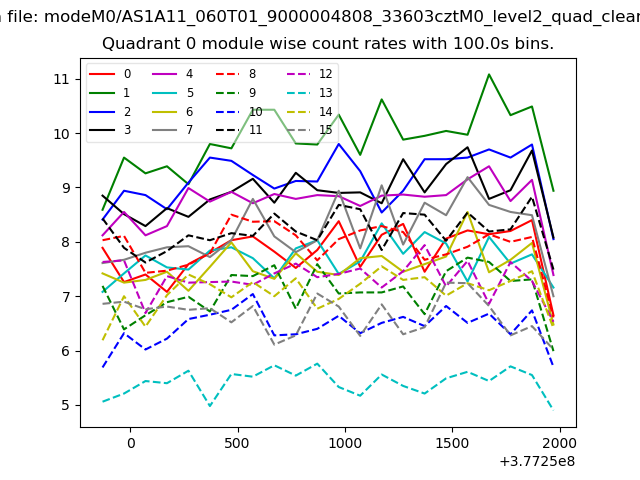 |
 |
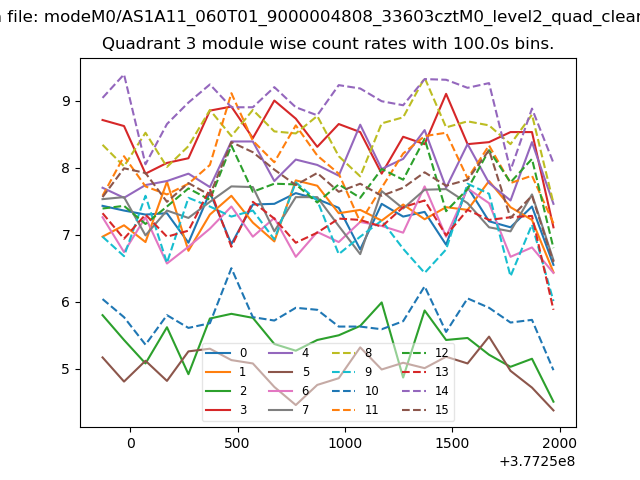
| Module-wise count rates for Quadrant B Data is divided into 100 sec bins |
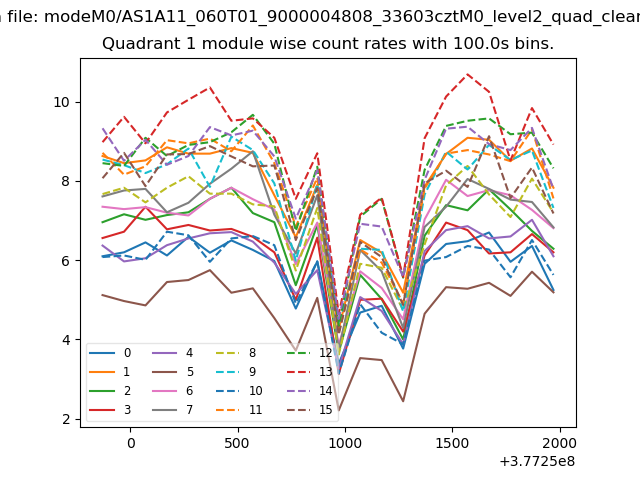 |
 |
| Module-wise count rates for Quadrant C Data is divided into 100 sec bins |
 |
 |
| Module-wise count rates for Quadrant D Data is divided into 100 sec bins |
 |
 |
| Parameter | Plot |
|---|---|
| CZT HV Monitor | 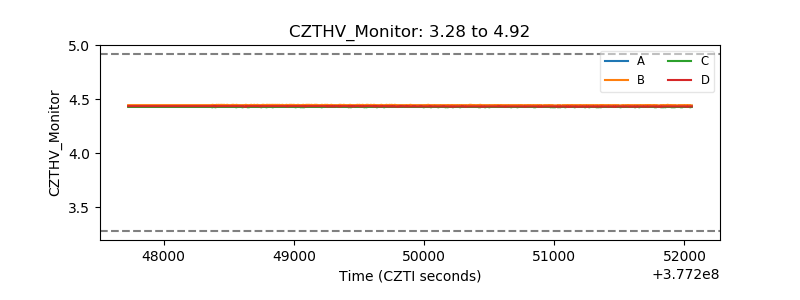 |
| D_VDD | 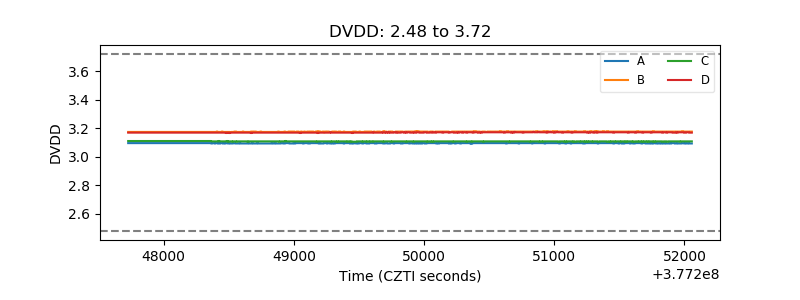 |
| Temperature 1 | 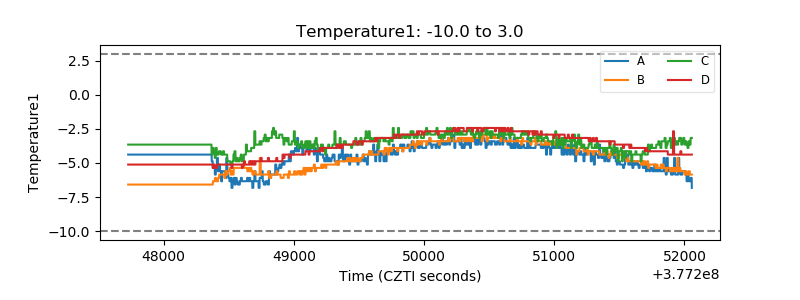 |
| Veto HV Monitor |  |
| Veto LLD | 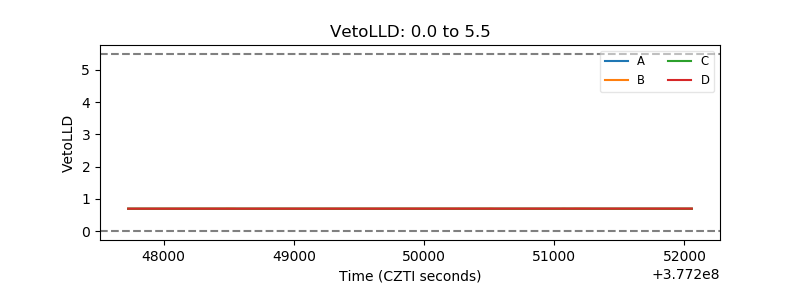 |
| Alpha Counter | 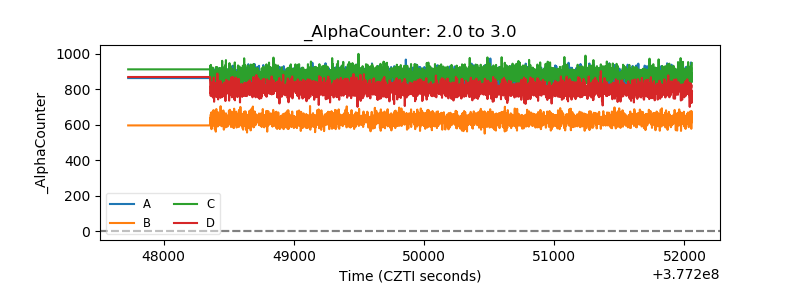 |
| _CPM_Rate | 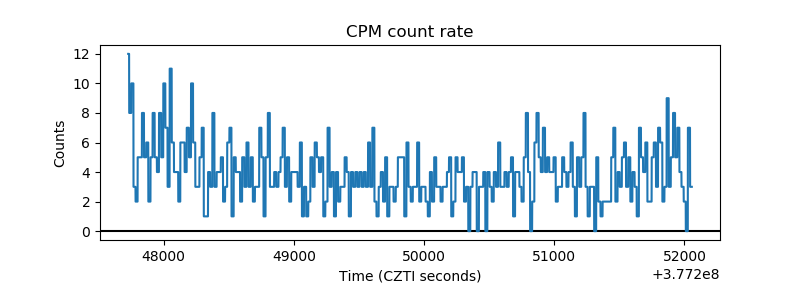 |
| CZT Counter | 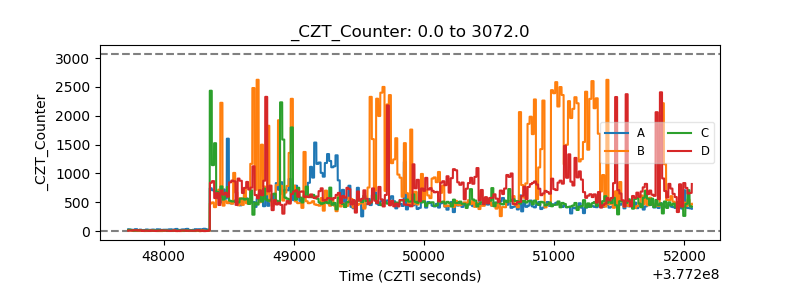 |
| +2.5 Volts monitor |  |
| +5 Volts monitor |  |
| _ROLL_ROT | 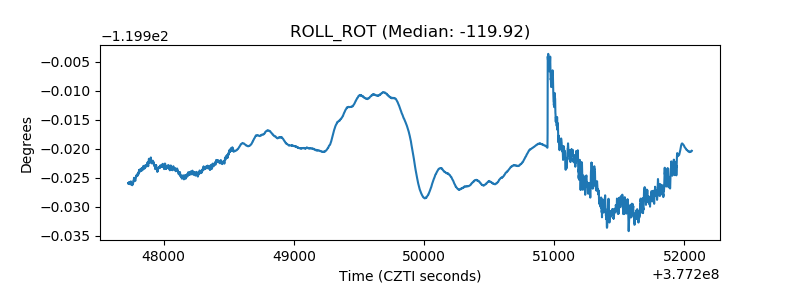 |
| _Roll_DEC | 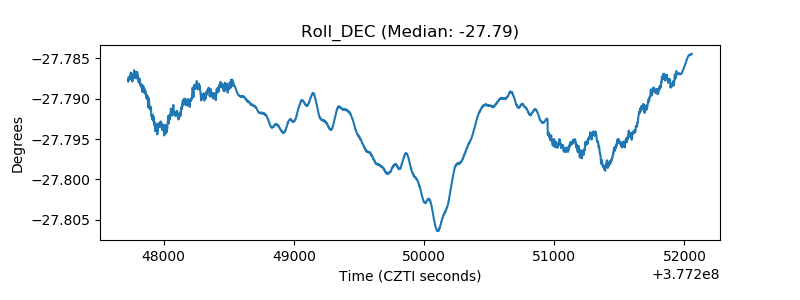 |
| _Roll_RA | 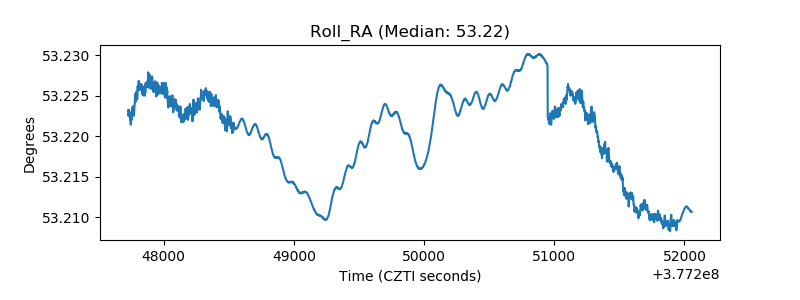 |
| Veto Counter | 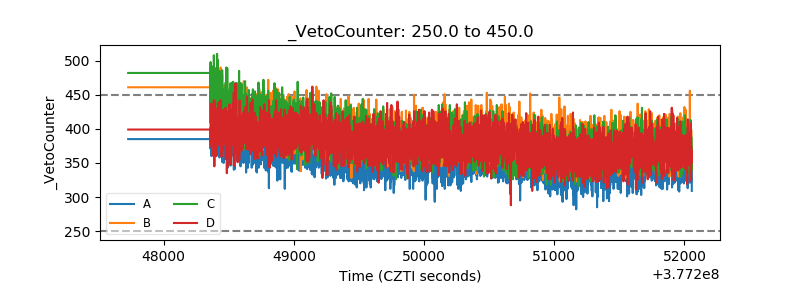 |