| Param | Original file | Final file |
|---|---|---|
| Filename | modeM0/AS1T04_076T01_9000004810cztM0_level2.fits | modeM0/AS1T04_076T01_9000004810cztM0_level2_quad_clean.evt |
| Size (bytes) | 493,162,560 | 448,084,800 |
| Size | 470.3 MB | 427.3 MB |
| Events in quadrant A | 3,101,698 | 2,695,896 |
| Events in quadrant B | 2,817,816 | 2,603,649 |
| Events in quadrant C | 3,045,758 | 2,592,456 |
| Events in quadrant D | 2,517,758 | 2,227,573 |
| Mode SS | |||
|---|---|---|---|
| Quadrant | BADHDUFLAG | Total packets | Discarded packets |
| A | 0 | 1026 | 0 |
| B | 0 | 1026 | 0 |
| C | 0 | 1026 | 0 |
| D | 0 | 1026 | 0 |
| Mode M9 | |||
|---|---|---|---|
| Quadrant | BADHDUFLAG | Total packets | Discarded packets |
| A | 0 | 210 | 0 |
| B | 0 | 210 | 0 |
| C | 0 | 210 | 0 |
| D | 0 | 210 | 0 |
| Mode M0 | |||
|---|---|---|---|
| Quadrant | BADHDUFLAG | Total packets | Discarded packets |
| A | 0 | 109188 | 0 |
| B | 0 | 154529 | 0 |
| C | 0 | 115586 | 0 |
| D | 0 | 172529 | 0 |
| Quadrant | Total seconds | Saturated seconds | Saturation percentage |
|---|---|---|---|
| A | 50266 | 362 | 0.720169% |
| B | 50266 | 5274 | 10.492182% |
| C | 50266 | 633 | 1.259301% |
| D | 50266 | 4044 | 8.045200% |
Noise dominated data is calculated using 1-second bins in cleaned event files. If a bin has >2000 counts, and if more than 50% of those come from <1% of pixels, then it is considered to be noise-dominated and hence unusable.
| Quadrant | # 1 sec bins | Bins with >0 counts | Bins with >2000 counts | High rate bins dominated by noise | Noise dominated (total time) | Noise dominated (detector-on time) | Marked lightcurve |
|---|---|---|---|---|---|---|---|
| A | 70048 | 50257 | 0 | 0 | 0.00% | 0.00% | 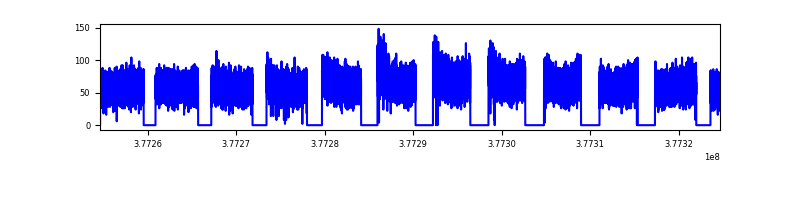 |
| B | 70048 | 50191 | 0 | 0 | 0.00% | 0.00% | 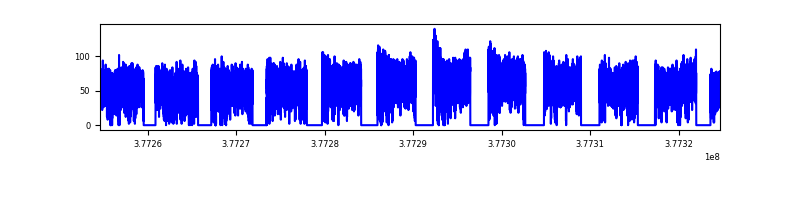 |
| C | 70048 | 50258 | 0 | 0 | 0.00% | 0.00% | 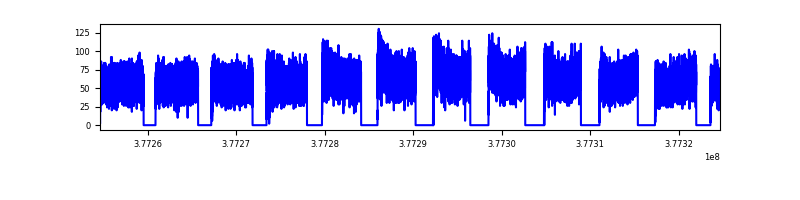 |
| D | 70048 | 50219 | 0 | 0 | 0.00% | 0.00% | 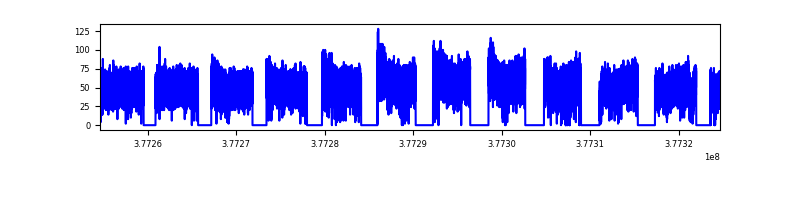 |
Top three noisy pixels from each quadrant. If the there are fewer than three noisy pixels in the level2.evt file, extra rows are filled as -1
| Pixel properties | Quadrant properties | ||||||
|---|---|---|---|---|---|---|---|
| Quadrant | DetID | PixID | Counts | Sigma | Mean | Median | Sigma |
| A | 7 | 110 | 2484 | 8.62 | 810 | 762 | 199.8 |
| A | 0 | 29 | 2456 | 8.48 | 810 | 762 | 199.8 |
| A | 9 | 19 | 2416 | 8.28 | 810 | 762 | 199.8 |
| B | 2 | 9 | 2375 | 11.2 | 748 | 715 | 148.3 |
| B | 3 | 80 | 2286 | 10.6 | 748 | 715 | 148.3 |
| B | 5 | 128 | 1923 | 8.15 | 748 | 715 | 148.3 |
| C | 3 | 202 | 2282 | 7.47 | 806 | 762 | 203.5 |
| C | 3 | 203 | 2260 | 7.36 | 806 | 762 | 203.5 |
| C | 3 | 187 | 2085 | 6.5 | 806 | 762 | 203.5 |
| D | 4 | 160 | 1863 | 6.25 | 722 | 662 | 192.1 |
| D | 7 | 3 | 1849 | 6.18 | 722 | 662 | 192.1 |
| D | 10 | 113 | 1813 | 5.99 | 722 | 662 | 192.1 |
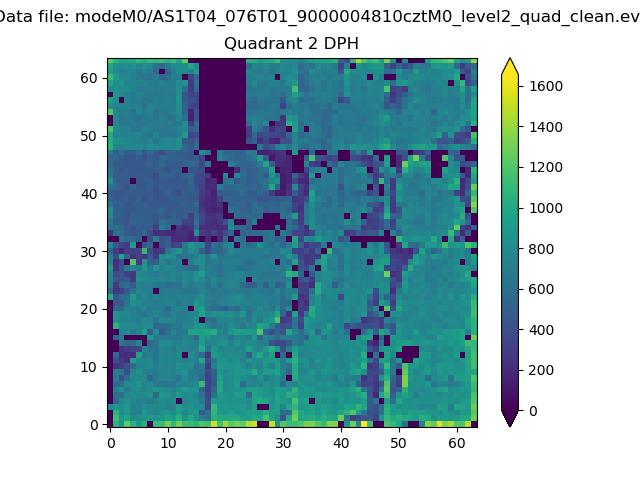
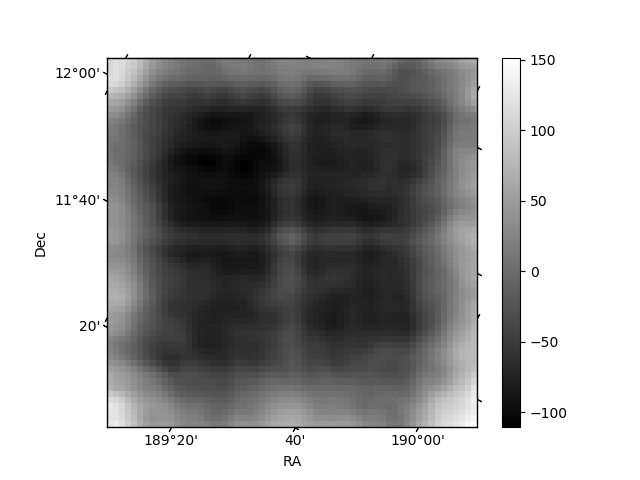
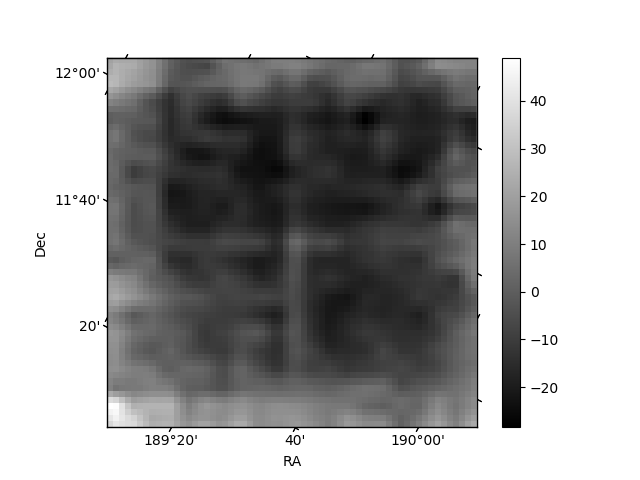
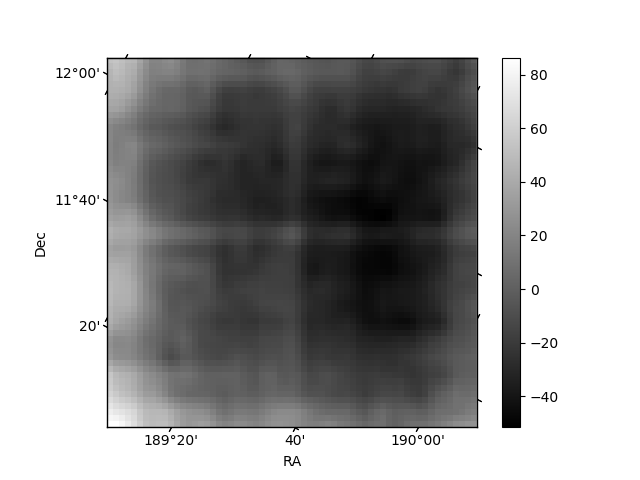
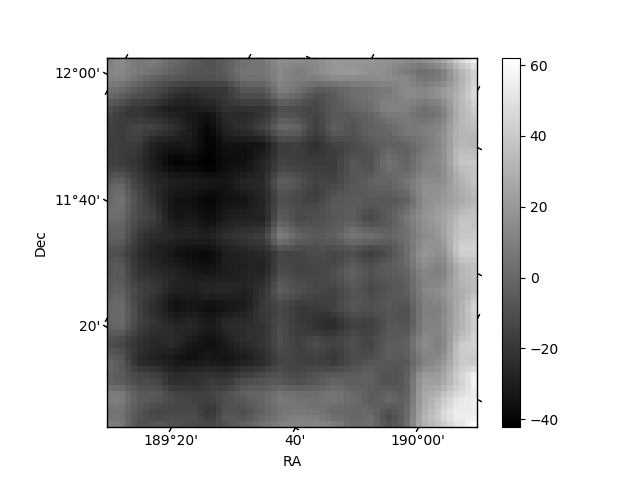
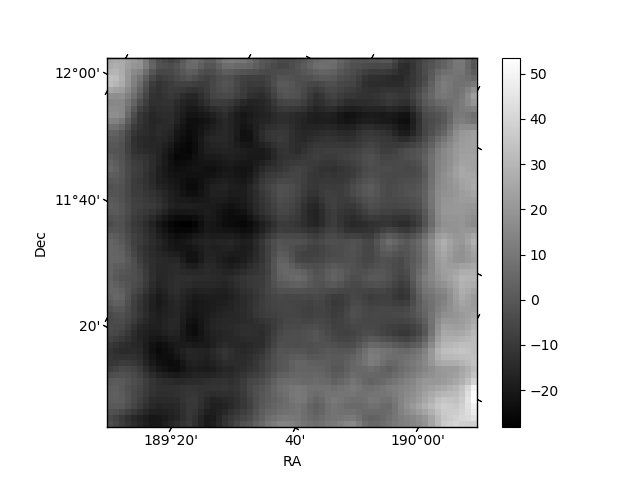
Histogram calculated using DETX and DETY for each event in the final _common_clean file
| Quadrant A | 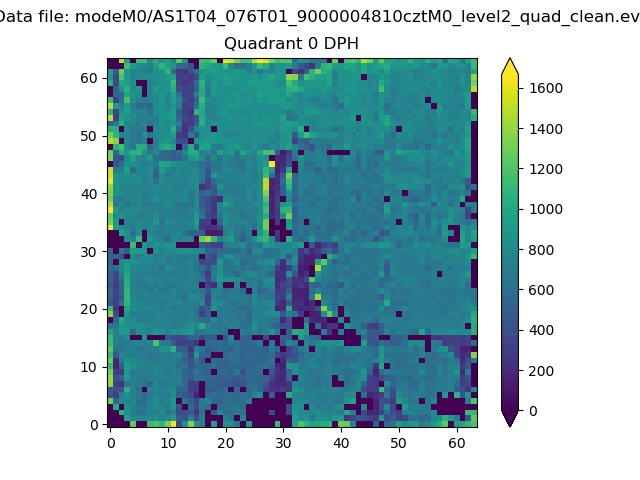 |
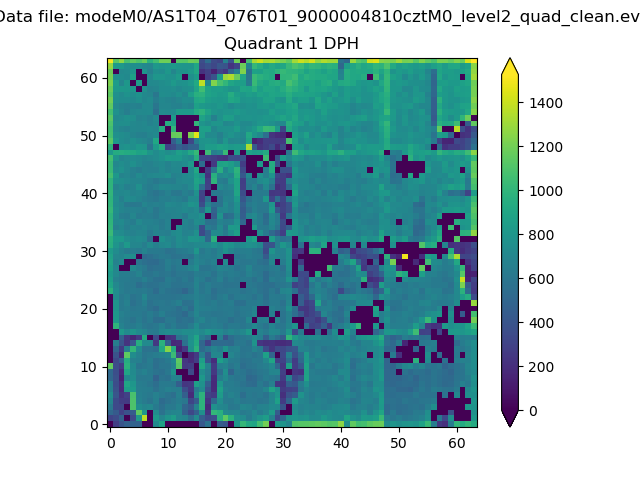 |
Quadrant B |
|---|---|---|---|
| Quadrant D | 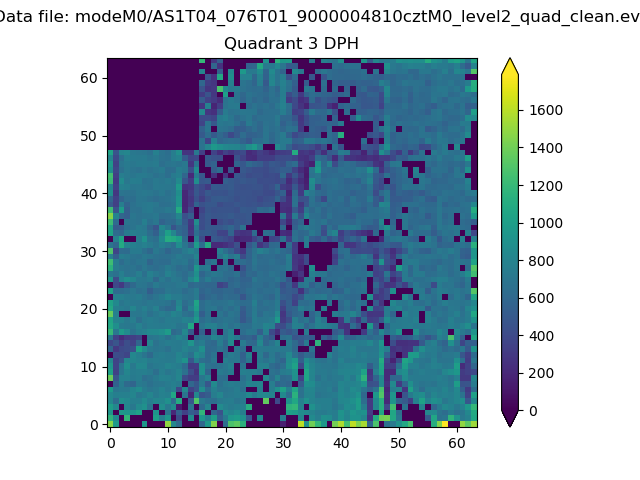 |
 |
Quadrant C |
| Plot type | Count rate plots | Images |
|---|---|---|
| Comparison with Poisson distribution Blue bars denote a histogram of data divided into 1 sec bins. Red curve is a Poisson curve with rate = median count rate of data. |
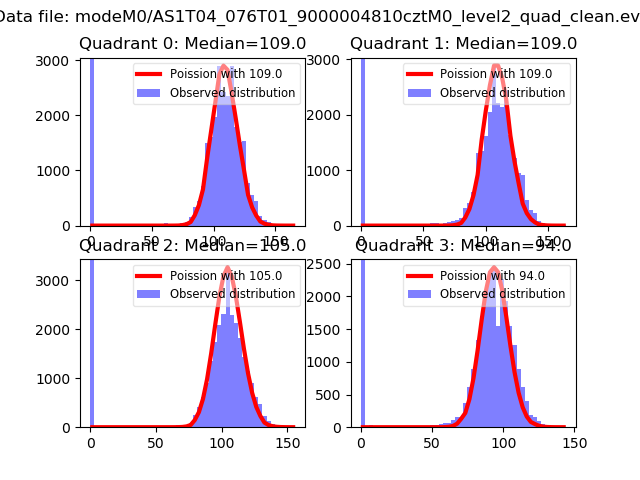 |
 |
| Quadrant-wise count rates Data is divided into 100 sec bins |
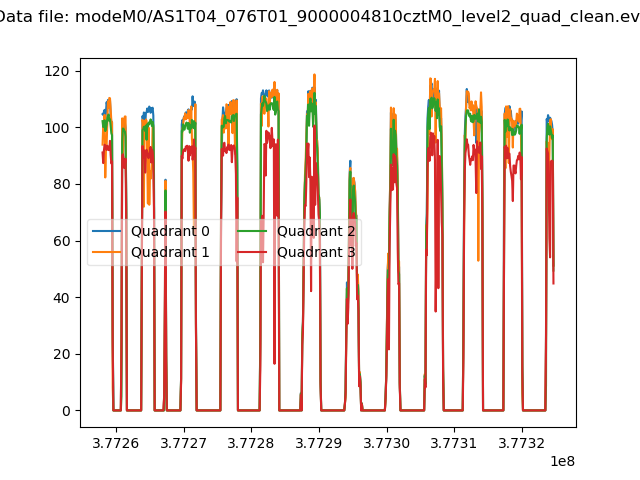 |
|
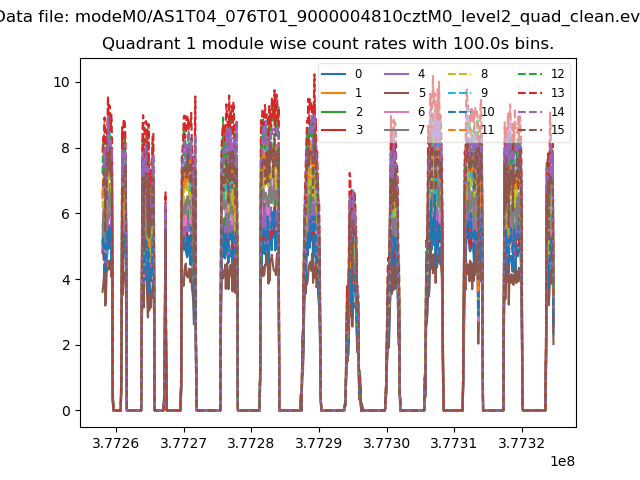
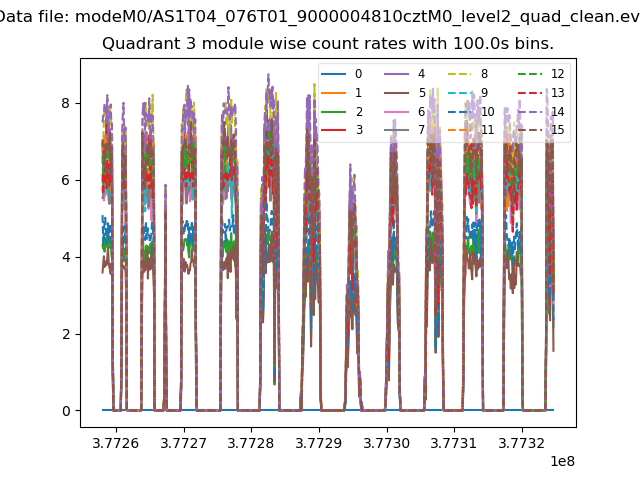
| Module-wise count rates for Quadrant A Data is divided into 100 sec bins |
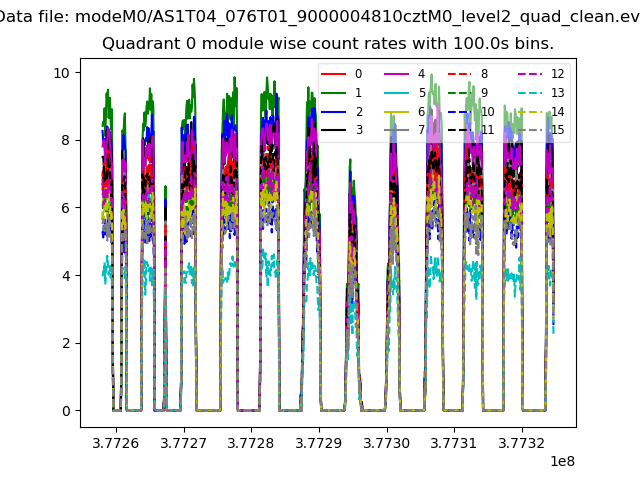 |
 |
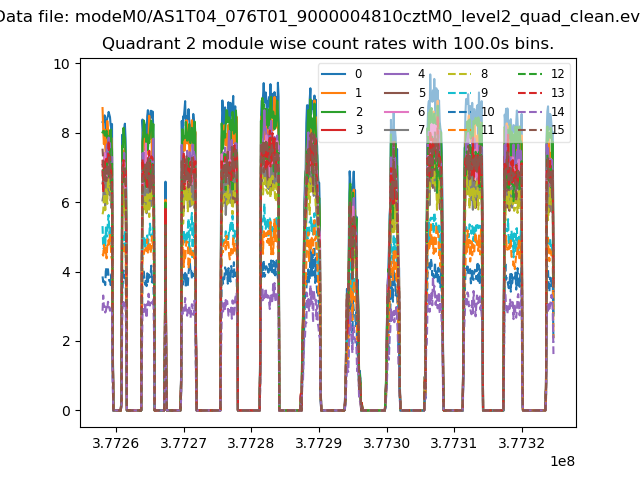
| Module-wise count rates for Quadrant B Data is divided into 100 sec bins |
 |
 |
| Module-wise count rates for Quadrant C Data is divided into 100 sec bins |
 |
 |
| Module-wise count rates for Quadrant D Data is divided into 100 sec bins |
 |
 |
| Parameter | Plot |
|---|---|
| CZT HV Monitor | 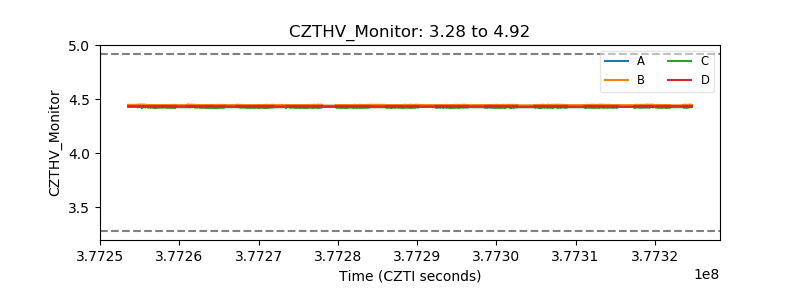 |
| D_VDD | 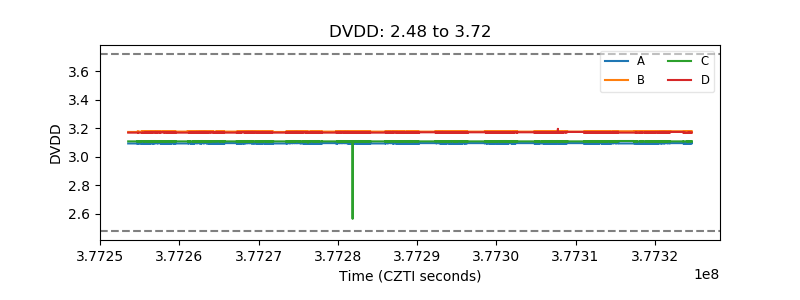 |
| Temperature 1 | 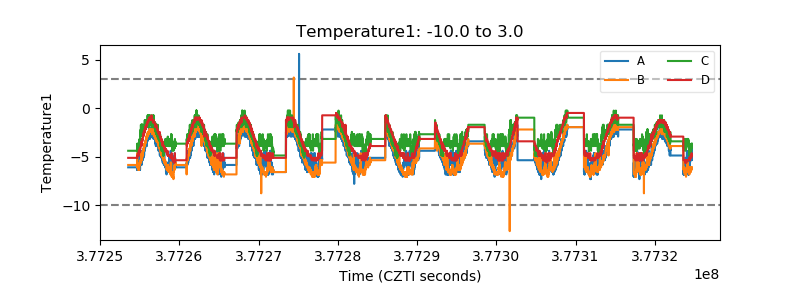 |
| Veto HV Monitor | 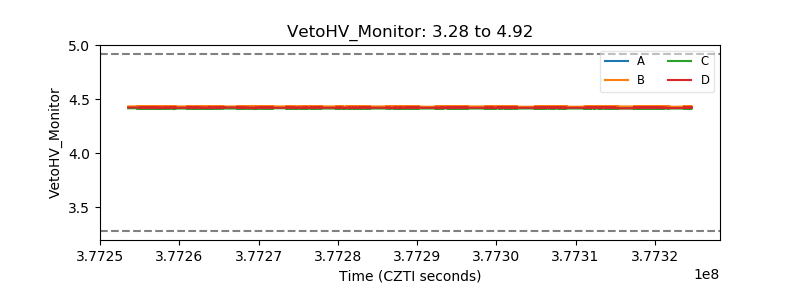 |
| Veto LLD | 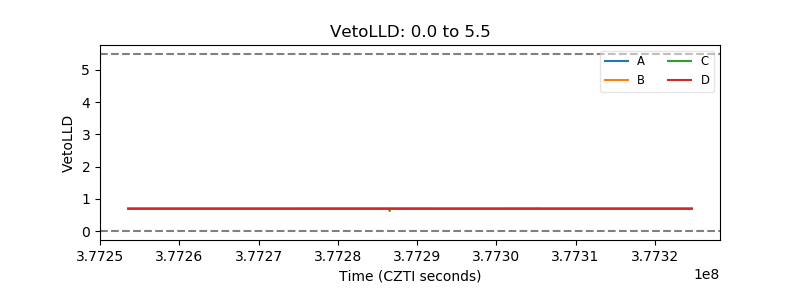 |
| Alpha Counter | 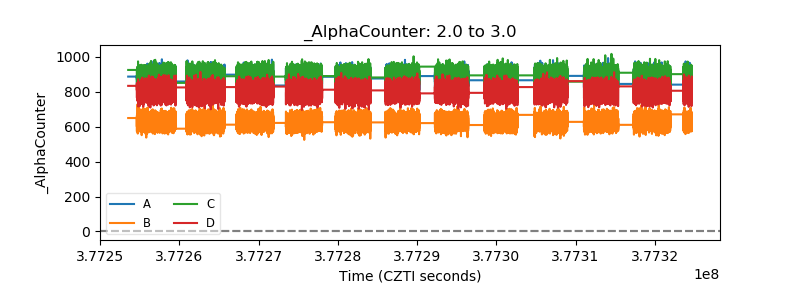 |
| _CPM_Rate | 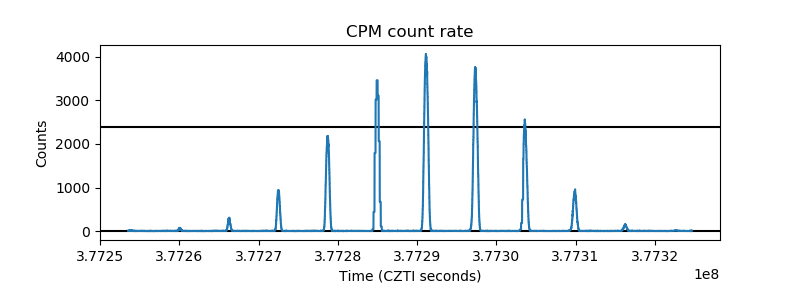 |
| CZT Counter | 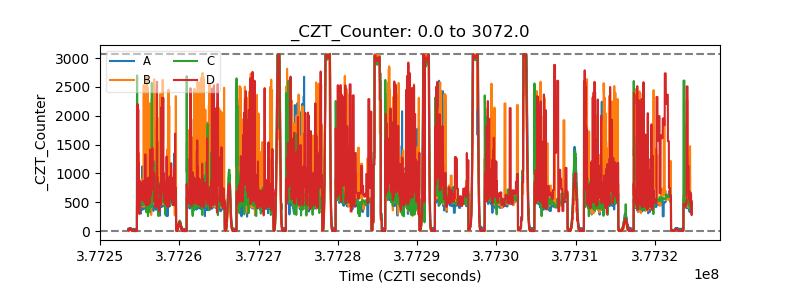 |
| +2.5 Volts monitor | 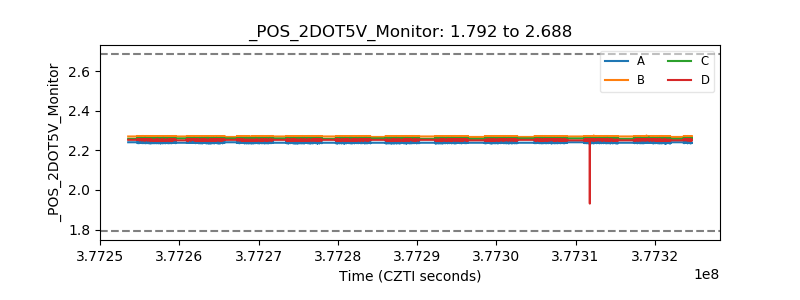 |
| +5 Volts monitor | 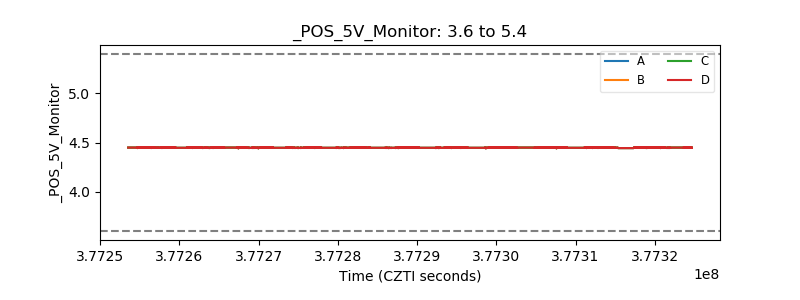 |
| _ROLL_ROT | 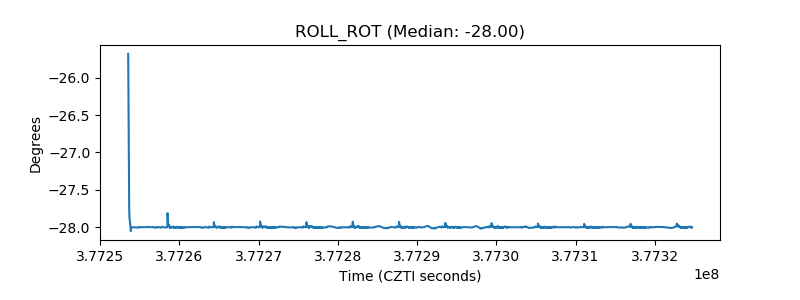 |
| _Roll_DEC | 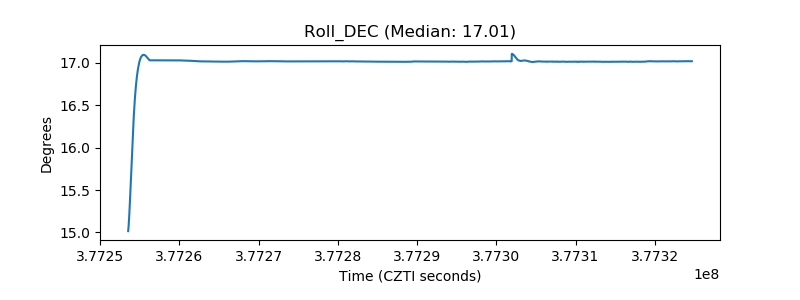 |
| _Roll_RA |  |
| Veto Counter | 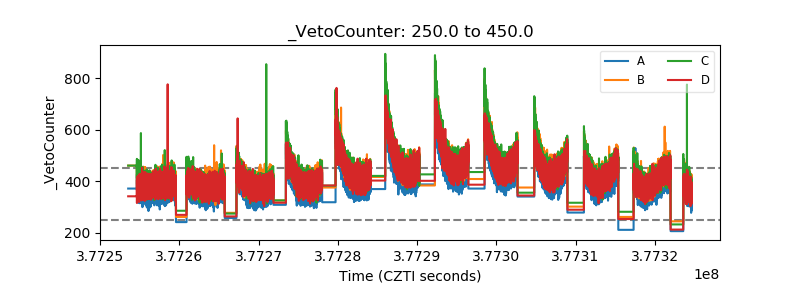 |