| Param | Original file | Final file |
|---|---|---|
| Filename | modeM0/AS1T04_076T01_9000004810_33603cztM0_level2.evt | modeM0/AS1T04_076T01_9000004810_33603cztM0_level2_quad_clean.evt |
| Size (bytes) | 82,926,720 | 18,990,720 |
| Size | 79.1 MB | 18.1 MB |
| Events in quadrant A | 475,285 | 125,044 |
| Events in quadrant B | 539,361 | 128,317 |
| Events in quadrant C | 638,359 | 123,921 |
| Events in quadrant D | 785,085 | 117,926 |
| Mode SS | |||
|---|---|---|---|
| Quadrant | BADHDUFLAG | Total packets | Discarded packets |
| A | 0 | 20 | 0 |
| B | 0 | 20 | 0 |
| C | 0 | 20 | 0 |
| D | 0 | 20 | 0 |
| Mode M9 | |||
|---|---|---|---|
| Quadrant | BADHDUFLAG | Total packets | Discarded packets |
| A | 0 | 12 | 0 |
| B | 0 | 12 | 0 |
| C | 0 | 12 | 0 |
| D | 0 | 12 | 0 |
| Mode M0 | |||
|---|---|---|---|
| Quadrant | BADHDUFLAG | Total packets | Discarded packets |
| A | 0 | 2128 | 1 |
| B | 0 | 2271 | 0 |
| C | 0 | 2495 | 0 |
| D | 0 | 3077 | 0 |
| Quadrant | Total seconds | Saturated seconds | Saturation percentage |
|---|---|---|---|
| A | 1036 | 6 | 0.579151% |
| B | 1036 | 16 | 1.544402% |
| C | 1036 | 30 | 2.895753% |
| D | 1036 | 34 | 3.281853% |
Noise dominated data is calculated using 1-second bins in cleaned event files. If a bin has >2000 counts, and if more than 50% of those come from <1% of pixels, then it is considered to be noise-dominated and hence unusable.
| Quadrant | # 1 sec bins | Bins with >0 counts | Bins with >2000 counts | High rate bins dominated by noise | Noise dominated (total time) | Noise dominated (detector-on time) | Marked lightcurve |
|---|---|---|---|---|---|---|---|
| A | 1036 | 1036 | 3 | 3 | 0.29% | 0.29% | 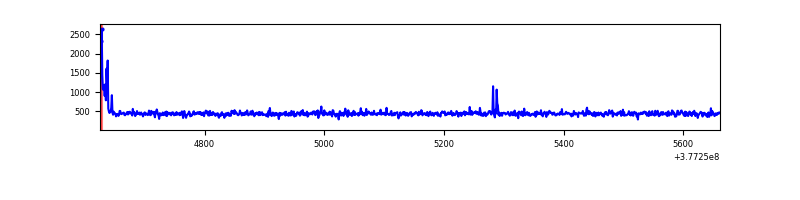 |
| B | 1036 | 1036 | 14 | 14 | 1.35% | 1.35% | 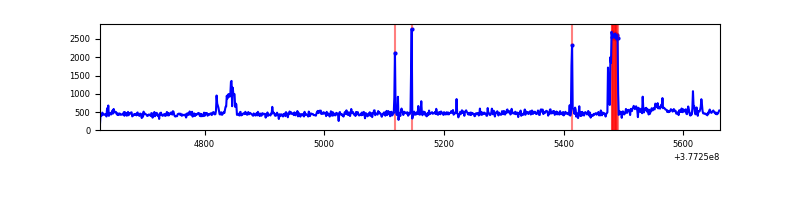 |
| C | 1036 | 1036 | 31 | 31 | 2.99% | 2.99% | 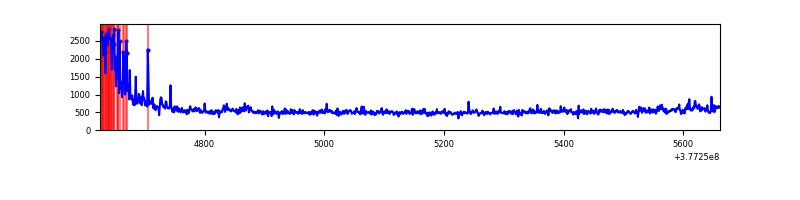 |
| D | 1036 | 1036 | 32 | 32 | 3.09% | 3.09% | 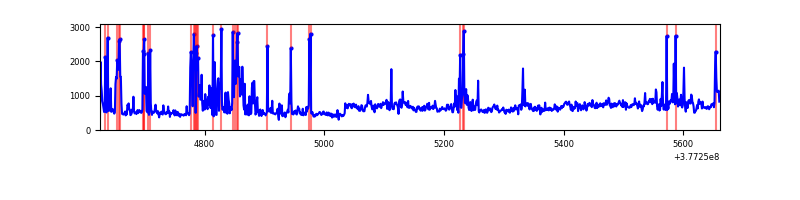 |
Top three noisy pixels from each quadrant. If the there are fewer than three noisy pixels in the level2.evt file, extra rows are filled as -1
| Pixel properties | Quadrant properties | ||||||
|---|---|---|---|---|---|---|---|
| Quadrant | DetID | PixID | Counts | Sigma | Mean | Median | Sigma |
| A | 15 | 169 | 16890 | 654.98 | 117 | 115 | 25.6 |
| A | 10 | 83 | 2733 | 102.22 | 117 | 115 | 25.6 |
| A | 13 | 254 | 1283 | 45.6 | 117 | 115 | 25.6 |
| B | 5 | 172 | 54512 | 2176.81 | 115 | 112 | 25.0 |
| B | 15 | 222 | 19630 | 781.01 | 115 | 112 | 25.0 |
| B | 0 | 246 | 6477 | 254.69 | 115 | 112 | 25.0 |
| C | 0 | 10 | 86107 | 3094.77 | 112 | 112 | 27.8 |
| C | 3 | 233 | 63987 | 2298.72 | 112 | 112 | 27.8 |
| C | 15 | 214 | 48152 | 1728.85 | 112 | 112 | 27.8 |
| D | 8 | 195 | 158056 | 5313.47 | 112 | 109 | 29.7 |
| D | 2 | 250 | 110853 | 3725.52 | 112 | 109 | 29.7 |
| D | 2 | 120 | 35149 | 1178.78 | 112 | 109 | 29.7 |
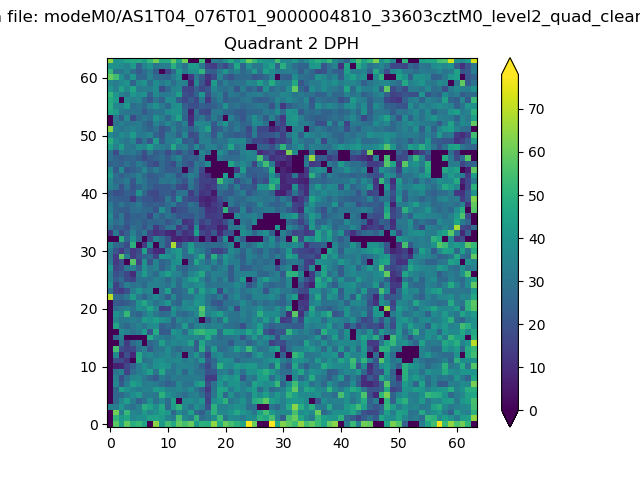
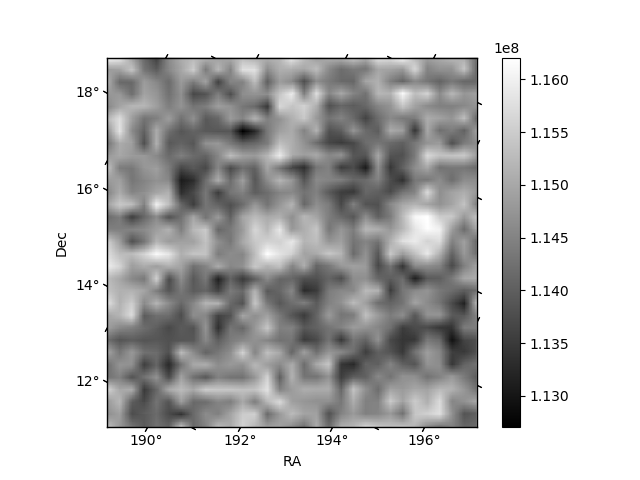
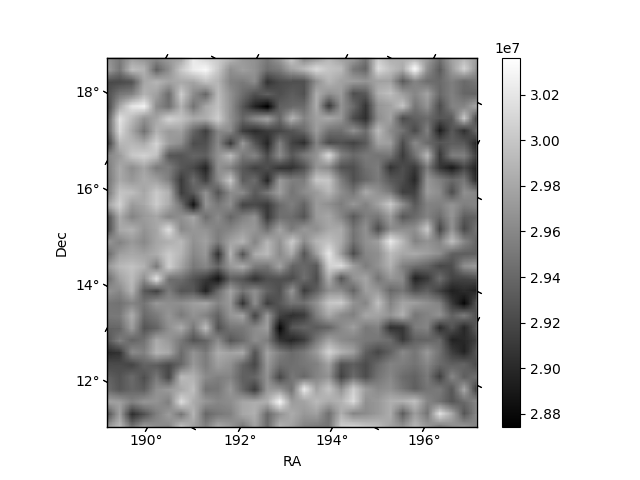
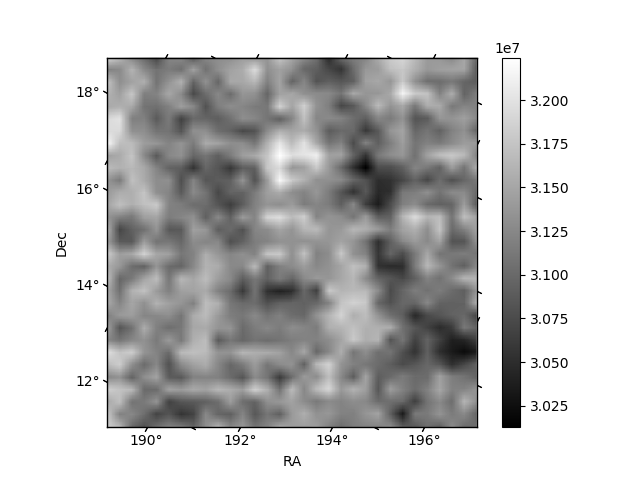
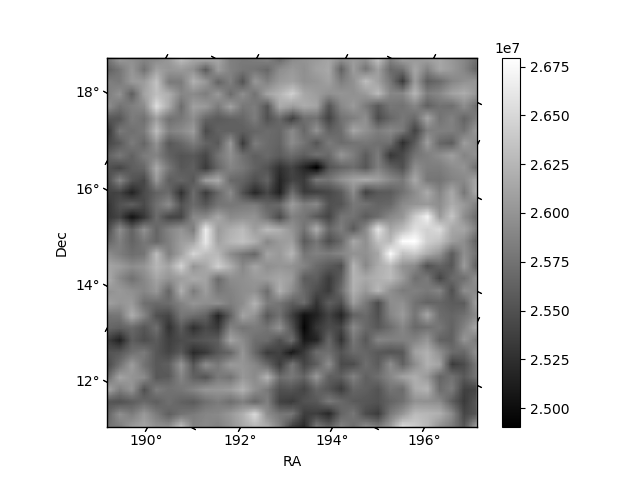
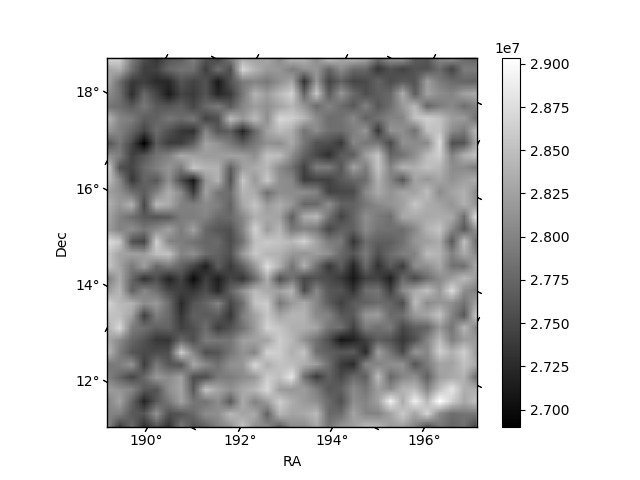
Histogram calculated using DETX and DETY for each event in the final _common_clean file
| Quadrant A | 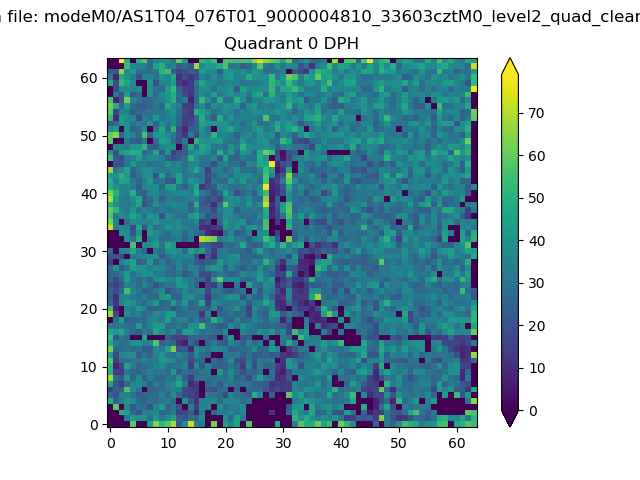 |
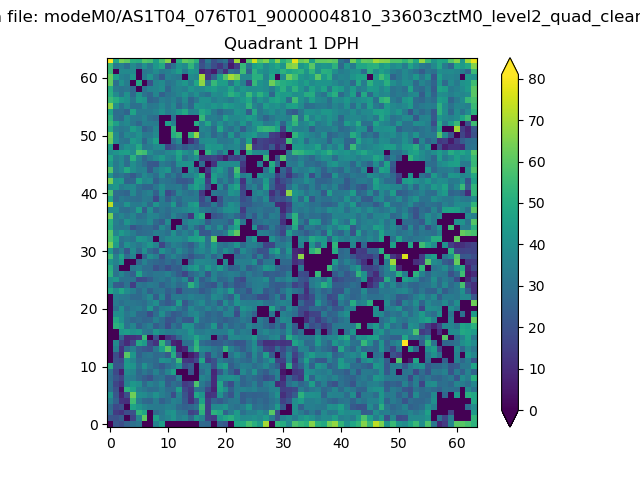 |
Quadrant B |
|---|---|---|---|
| Quadrant D | 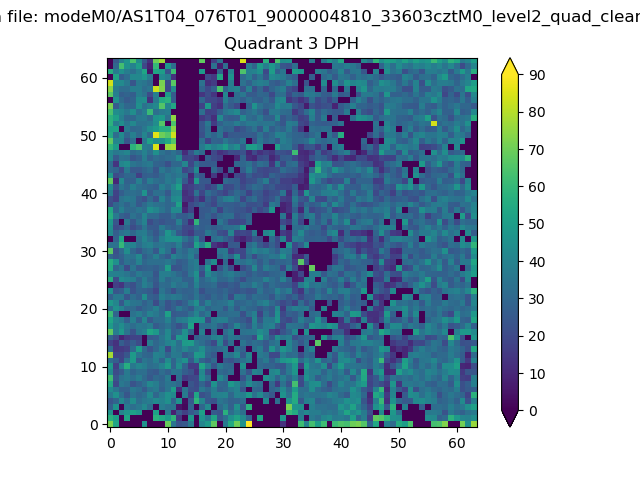 |
 |
Quadrant C |
| Plot type | Count rate plots | Images |
|---|---|---|
| Comparison with Poisson distribution Blue bars denote a histogram of data divided into 1 sec bins. Red curve is a Poisson curve with rate = median count rate of data. |
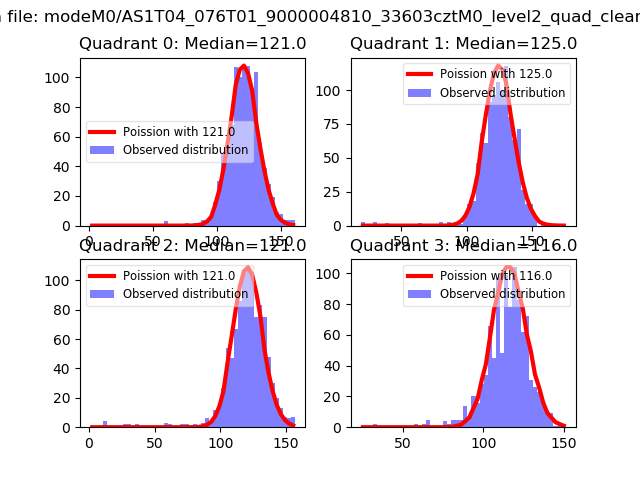 |
 |
| Quadrant-wise count rates Data is divided into 100 sec bins |
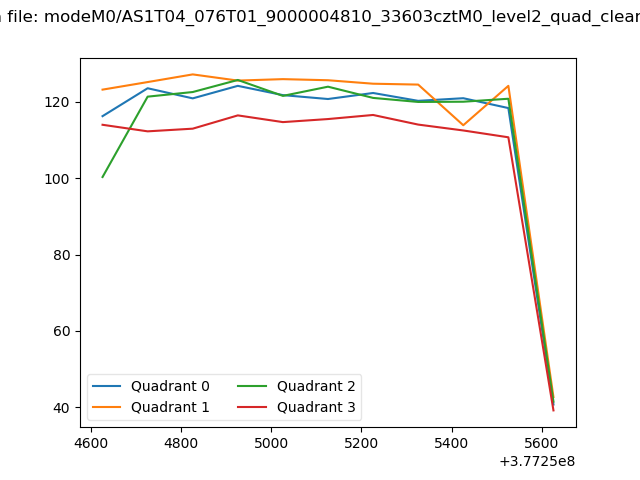 |
|
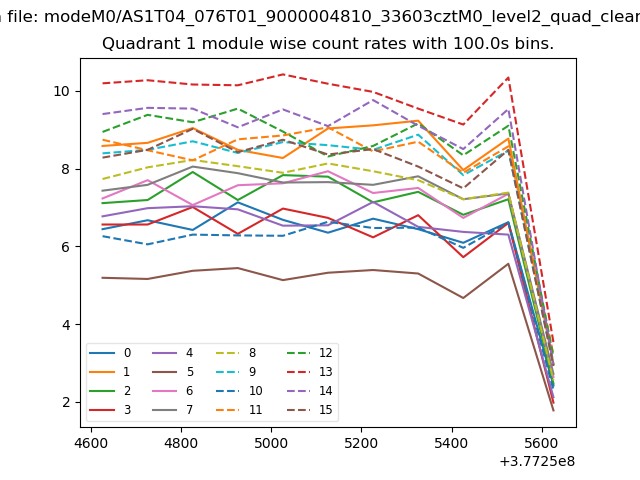
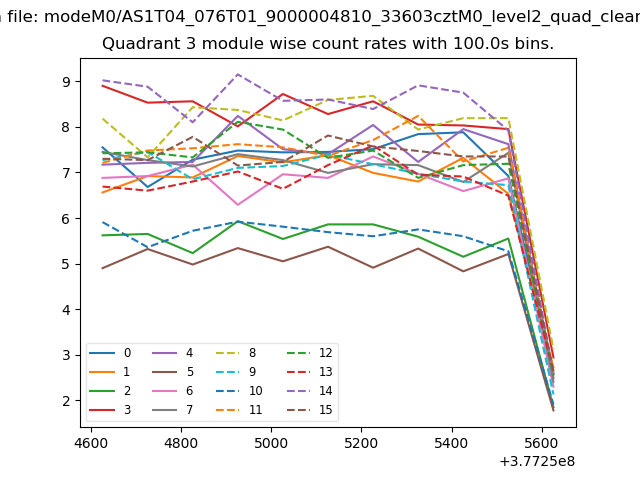
| Module-wise count rates for Quadrant A Data is divided into 100 sec bins |
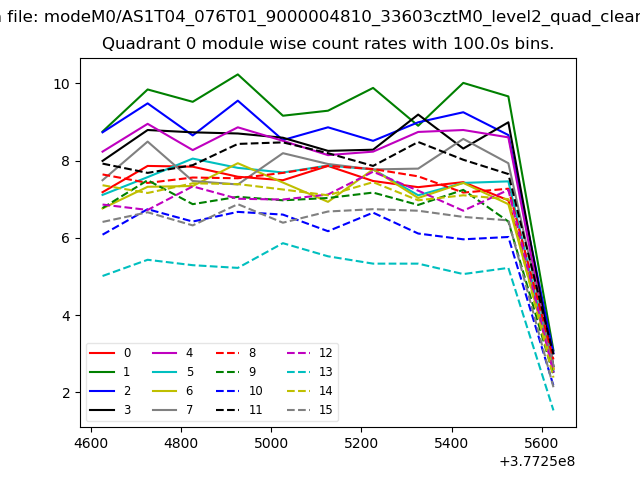 |
 |
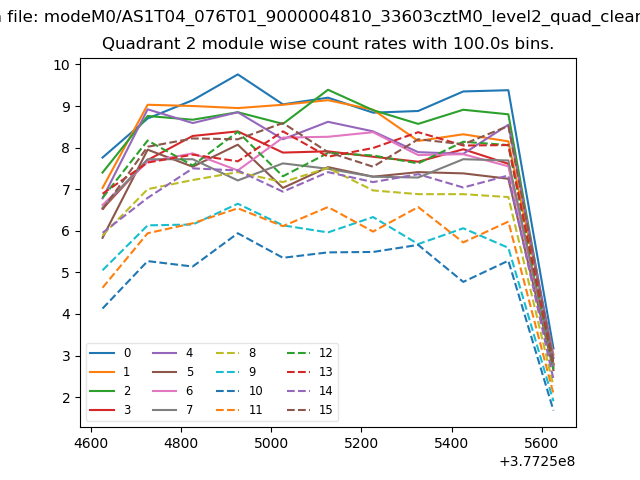
| Module-wise count rates for Quadrant B Data is divided into 100 sec bins |
 |
 |
| Module-wise count rates for Quadrant C Data is divided into 100 sec bins |
 |
 |
| Module-wise count rates for Quadrant D Data is divided into 100 sec bins |
 |
 |
| Parameter | Plot |
|---|---|
| CZT HV Monitor | 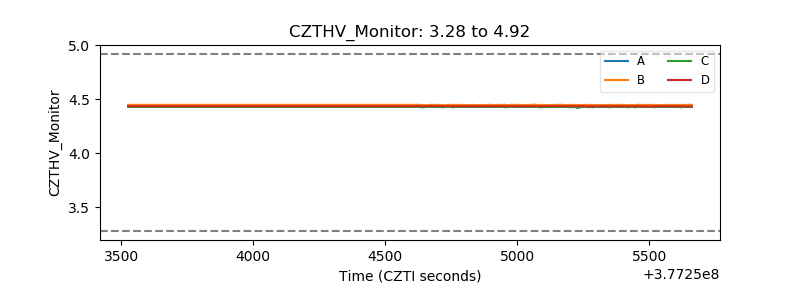 |
| D_VDD | 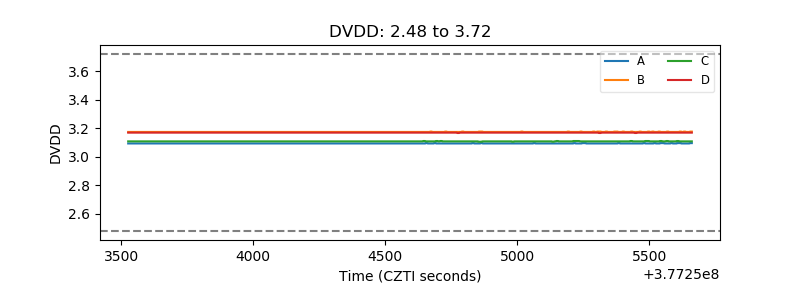 |
| Temperature 1 | 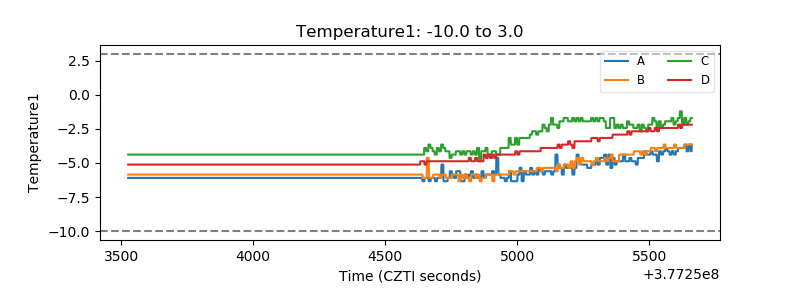 |
| Veto HV Monitor | 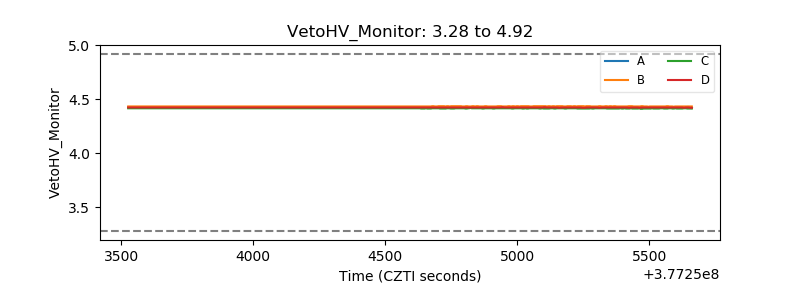 |
| Veto LLD | 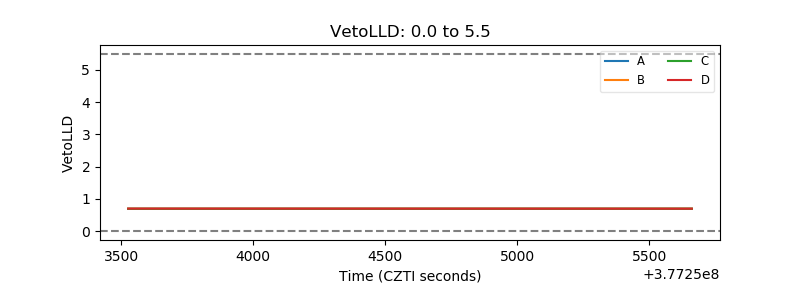 |
| Alpha Counter | 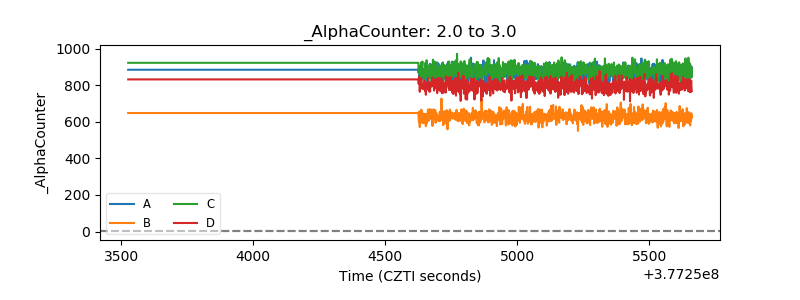 |
| _CPM_Rate | 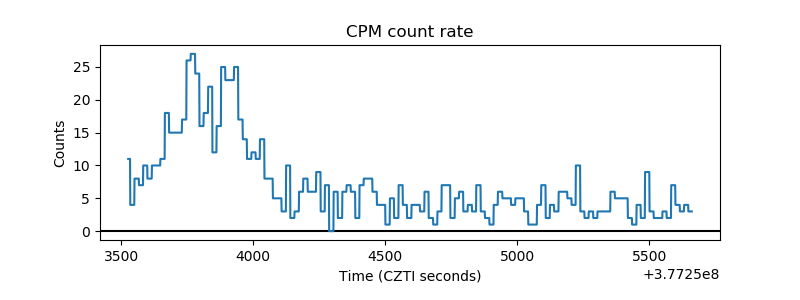 |
| CZT Counter | 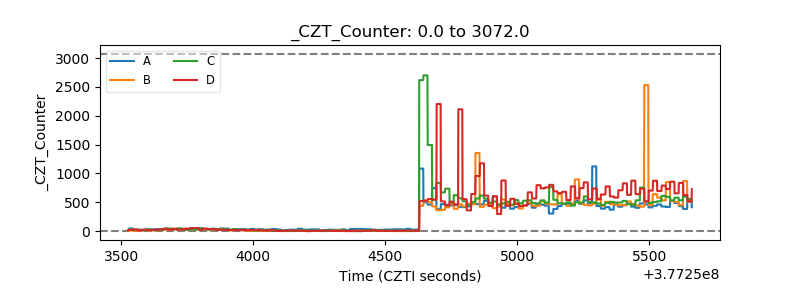 |
| +2.5 Volts monitor | 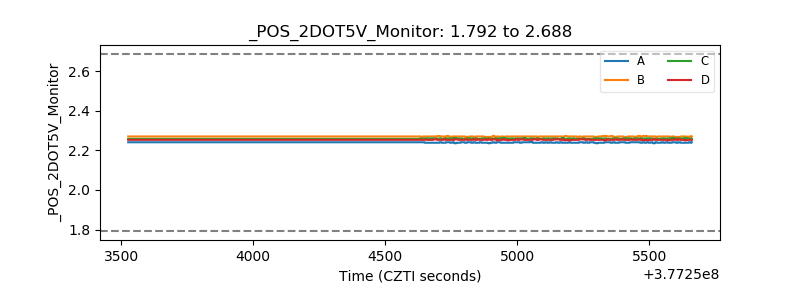 |
| +5 Volts monitor | 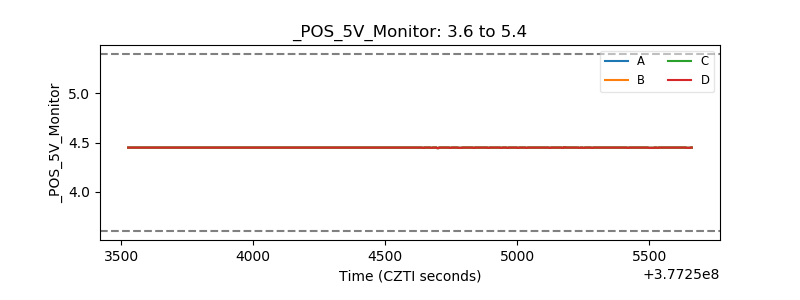 |
| _ROLL_ROT | 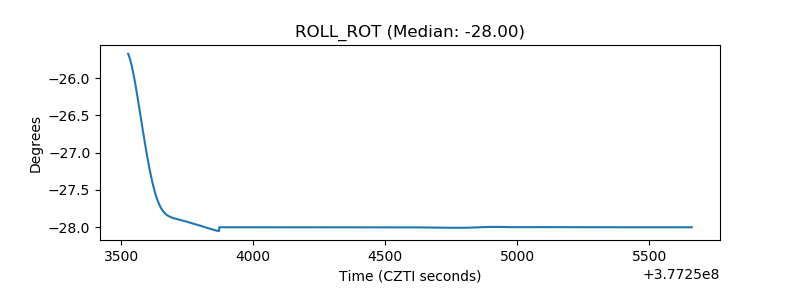 |
| _Roll_DEC | 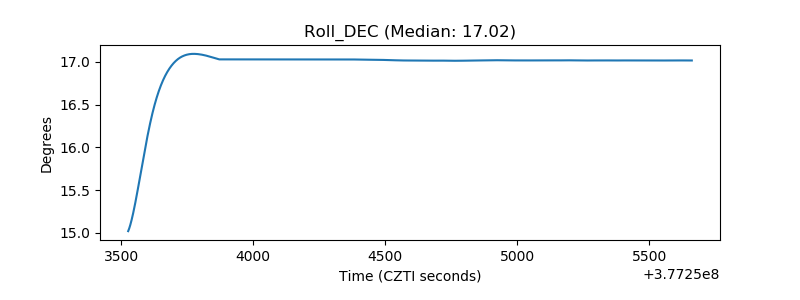 |
| _Roll_RA | 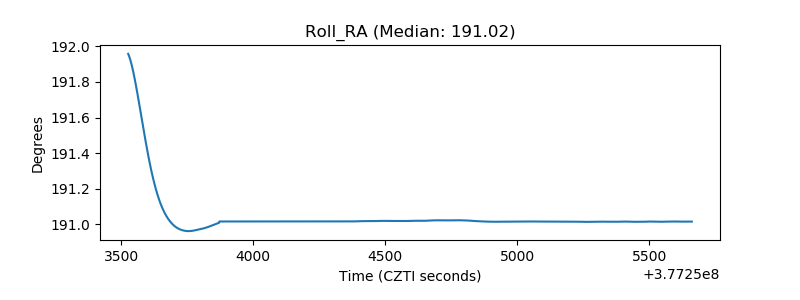 |
| Veto Counter | 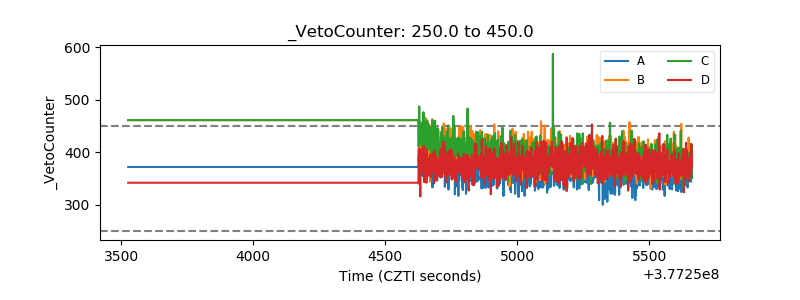 |