| Param | Original file | Final file |
|---|---|---|
| Filename | modeM0/AS1T04_076T01_9000004810_33605cztM0_level2.evt | modeM0/AS1T04_076T01_9000004810_33605cztM0_level2_quad_clean.evt |
| Size (bytes) | 1,002,389,760 | 113,080,320 |
| Size | 956.0 MB | 107.8 MB |
| Events in quadrant A | 5,208,617 | 684,540 |
| Events in quadrant B | 9,987,282 | 668,545 |
| Events in quadrant C | 6,288,603 | 679,083 |
| Events in quadrant D | 8,147,656 | 647,591 |
| Mode SS | |||
|---|---|---|---|
| Quadrant | BADHDUFLAG | Total packets | Discarded packets |
| A | 0 | 218 | 0 |
| B | 0 | 218 | 0 |
| C | 0 | 218 | 0 |
| D | 0 | 218 | 0 |
| Mode M9 | |||
|---|---|---|---|
| Quadrant | BADHDUFLAG | Total packets | Discarded packets |
| A | 0 | 30 | 0 |
| B | 0 | 30 | 0 |
| C | 0 | 30 | 0 |
| D | 0 | 31 | 0 |
| Mode M0 | |||
|---|---|---|---|
| Quadrant | BADHDUFLAG | Total packets | Discarded packets |
| A | 0 | 22359 | 3 |
| B | 0 | 36608 | 2 |
| C | 0 | 24836 | 2 |
| D | 0 | 31513 | 2 |
| Quadrant | Total seconds | Saturated seconds | Saturation percentage |
|---|---|---|---|
| A | 10755 | 29 | 0.269642% |
| B | 10755 | 1662 | 15.453278% |
| C | 10755 | 144 | 1.338912% |
| D | 10755 | 270 | 2.510460% |
Noise dominated data is calculated using 1-second bins in cleaned event files. If a bin has >2000 counts, and if more than 50% of those come from <1% of pixels, then it is considered to be noise-dominated and hence unusable.
| Quadrant | # 1 sec bins | Bins with >0 counts | Bins with >2000 counts | High rate bins dominated by noise | Noise dominated (total time) | Noise dominated (detector-on time) | Marked lightcurve |
|---|---|---|---|---|---|---|---|
| A | 13592 | 10757 | 15 | 15 | 0.11% | 0.14% |  |
| B | 13592 | 10757 | 1352 | 1352 | 9.95% | 12.57% | 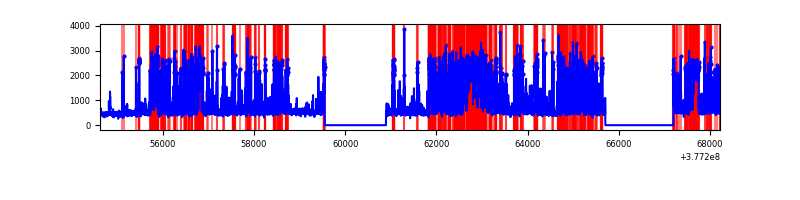 |
| C | 13592 | 10757 | 127 | 127 | 0.93% | 1.18% | 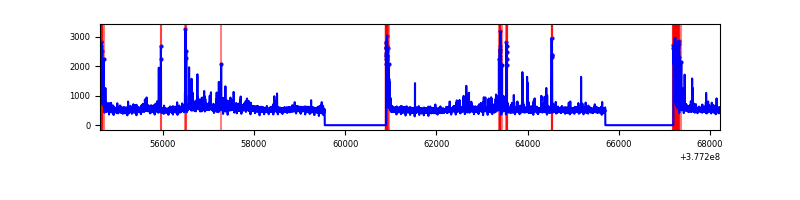 |
| D | 13592 | 10757 | 235 | 235 | 1.73% | 2.18% |  |
Top three noisy pixels from each quadrant. If the there are fewer than three noisy pixels in the level2.evt file, extra rows are filled as -1
| Pixel properties | Quadrant properties | ||||||
|---|---|---|---|---|---|---|---|
| Quadrant | DetID | PixID | Counts | Sigma | Mean | Median | Sigma |
| A | 15 | 169 | 249580 | 970.39 | 1276 | 1249 | 255.9 |
| A | 13 | 254 | 17705 | 64.3 | 1276 | 1249 | 255.9 |
| A | 7 | 191 | 16897 | 61.15 | 1276 | 1249 | 255.9 |
| B | 5 | 172 | 3412768 | 14794.26 | 1191 | 1159 | 230.6 |
| B | 5 | 255 | 1052305 | 4558.24 | 1191 | 1159 | 230.6 |
| B | 0 | 213 | 269924 | 1165.48 | 1191 | 1159 | 230.6 |
| C | 3 | 233 | 541210 | 1864.99 | 1239 | 1249 | 289.5 |
| C | 15 | 214 | 457914 | 1577.29 | 1239 | 1249 | 289.5 |
| C | 0 | 10 | 391373 | 1347.46 | 1239 | 1249 | 289.5 |
| D | 8 | 195 | 1624186 | 4927.26 | 1225 | 1199 | 329.4 |
| D | 2 | 250 | 362957 | 1098.27 | 1225 | 1199 | 329.4 |
| D | 12 | 235 | 299327 | 905.09 | 1225 | 1199 | 329.4 |
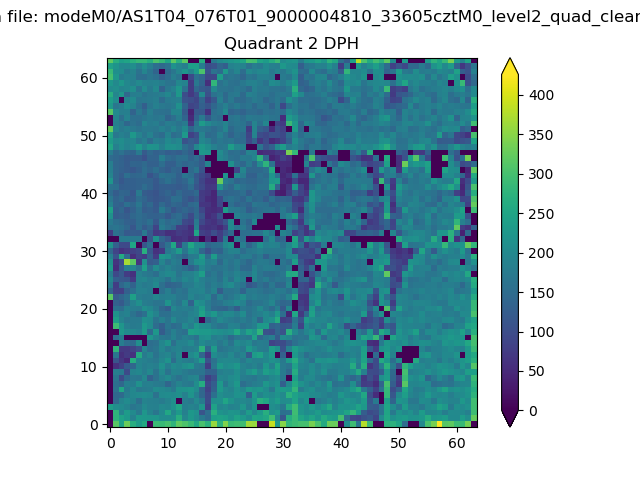
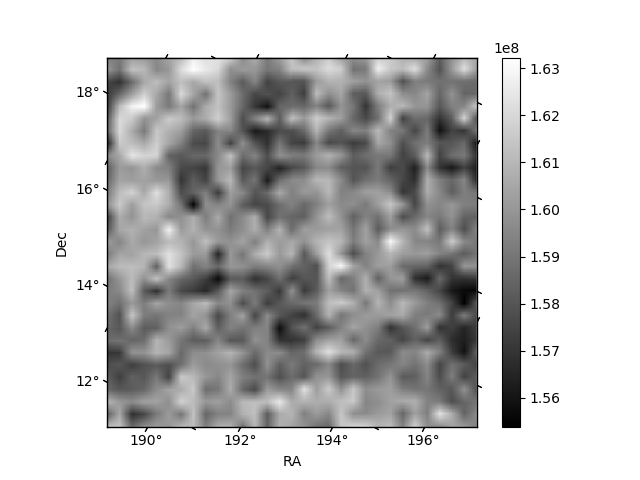
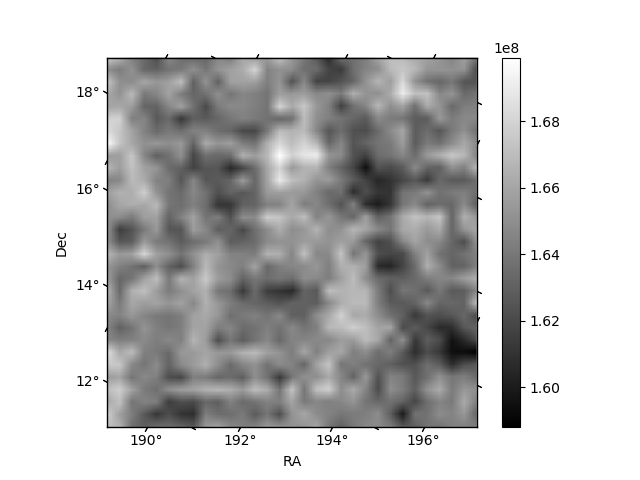
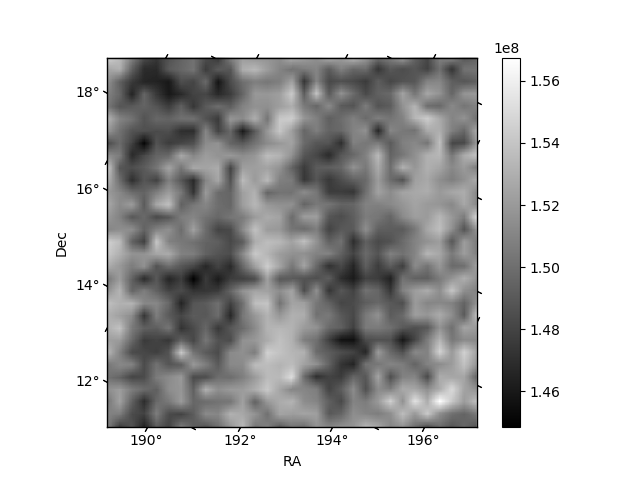
Histogram calculated using DETX and DETY for each event in the final _common_clean file
| Quadrant A | 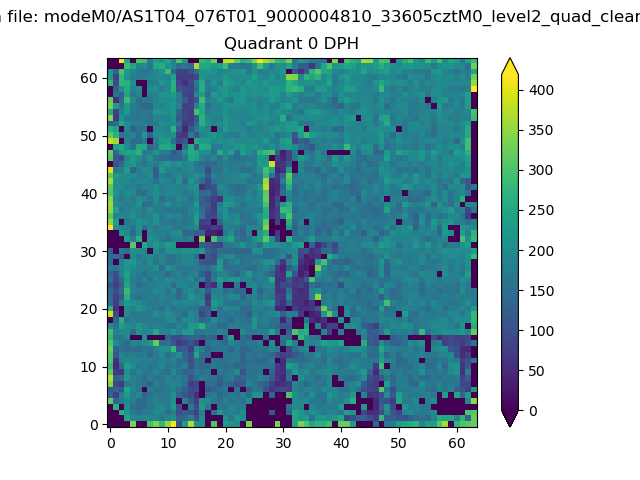 |
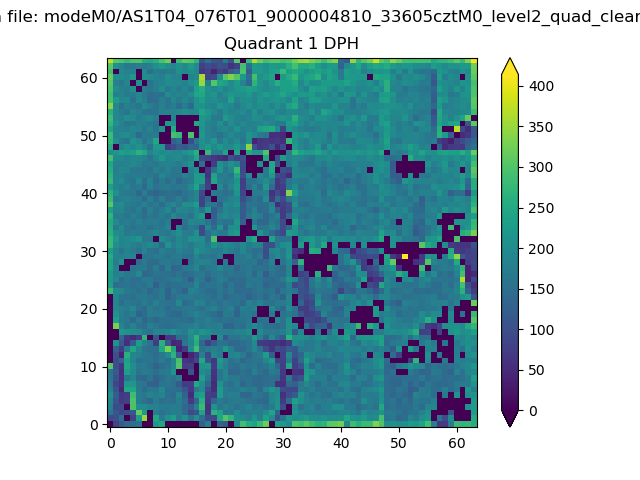 |
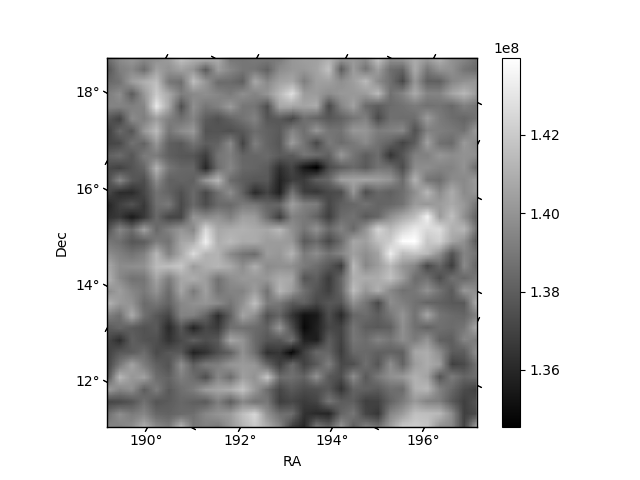
Quadrant B |
|---|---|---|---|
| Quadrant D | 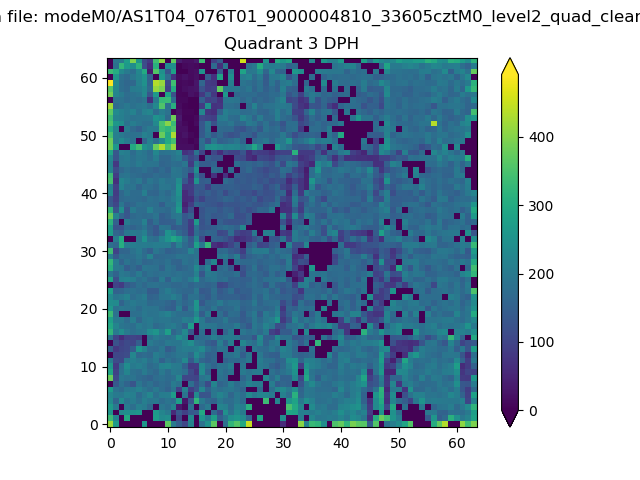 |
 |
Quadrant C |
| Plot type | Count rate plots | Images |
|---|---|---|
| Comparison with Poisson distribution Blue bars denote a histogram of data divided into 1 sec bins. Red curve is a Poisson curve with rate = median count rate of data. |
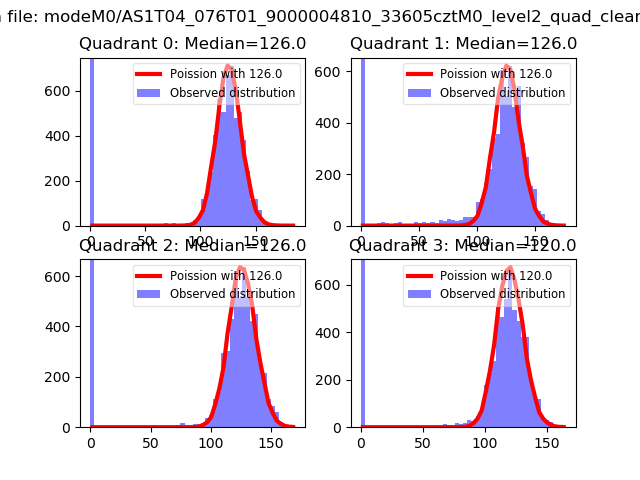 |
 |
| Quadrant-wise count rates Data is divided into 100 sec bins |
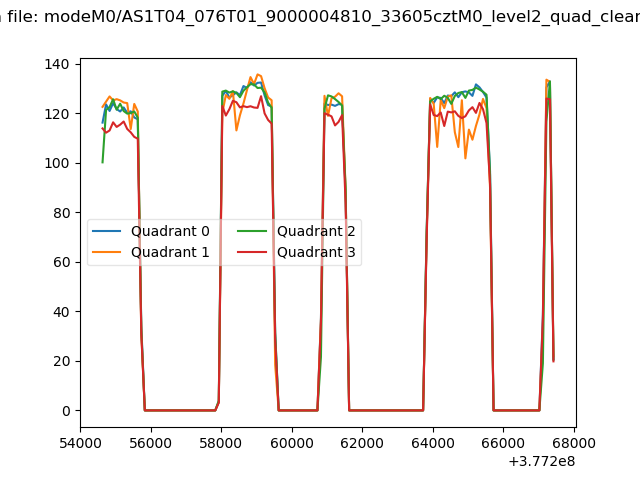 |
|
| Module-wise count rates for Quadrant A Data is divided into 100 sec bins |
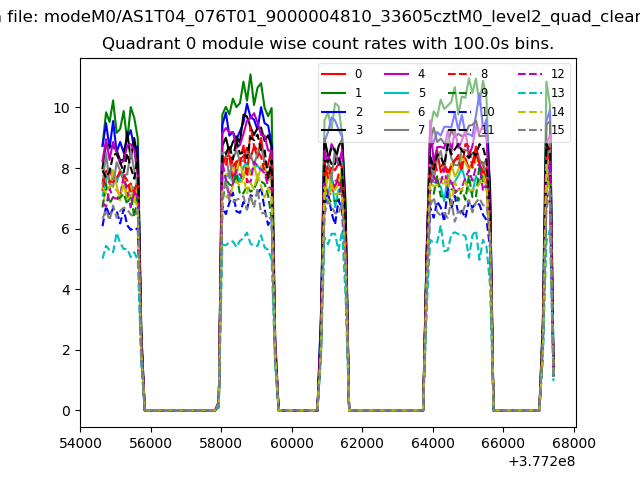 |
 |
| Module-wise count rates for Quadrant B Data is divided into 100 sec bins |
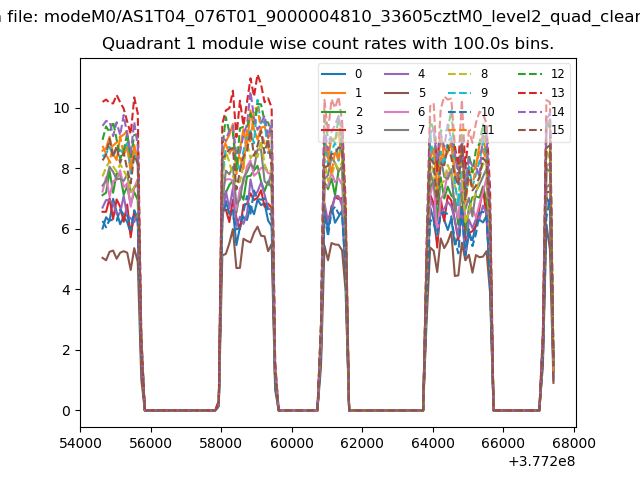 |
 |
| Module-wise count rates for Quadrant C Data is divided into 100 sec bins |
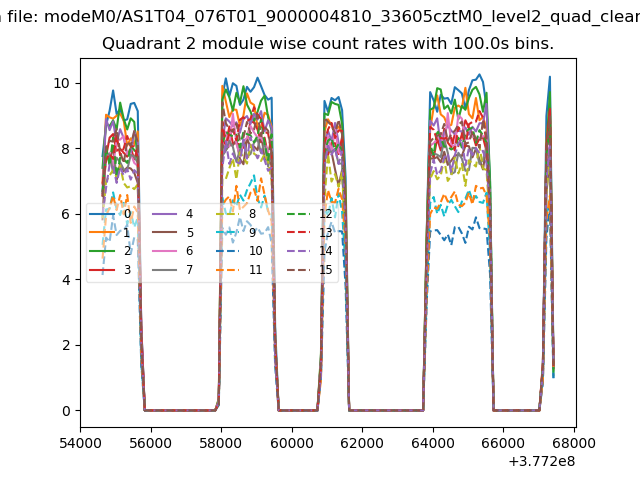 |
 |
| Module-wise count rates for Quadrant D Data is divided into 100 sec bins |
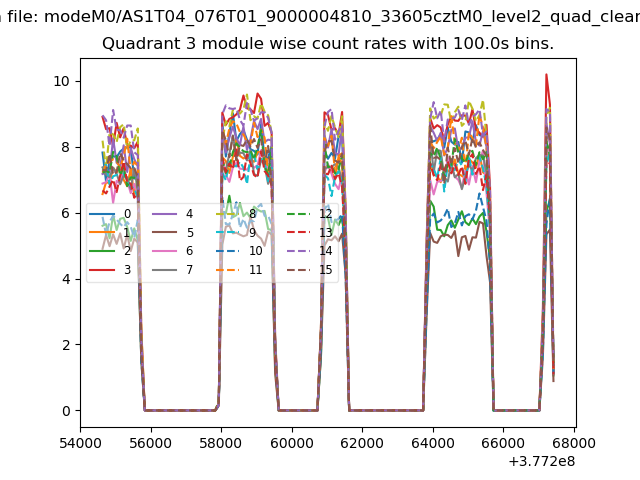 |
 |
| Parameter | Plot |
|---|---|
| CZT HV Monitor | 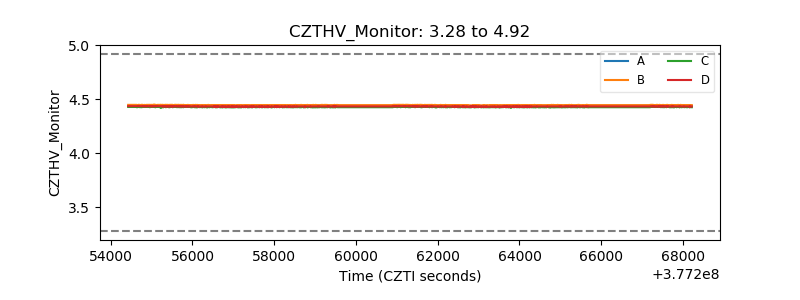 |
| D_VDD |  |
| Temperature 1 |  |
| Veto HV Monitor | 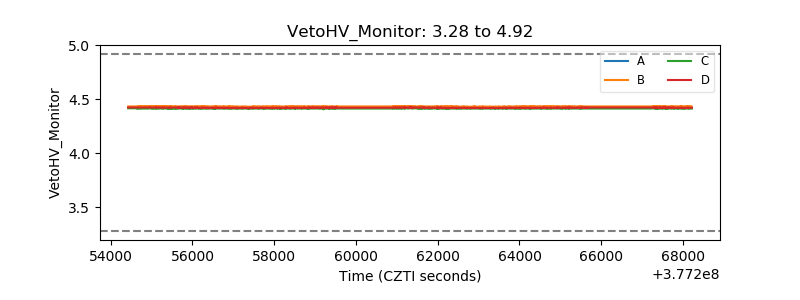 |
| Veto LLD | 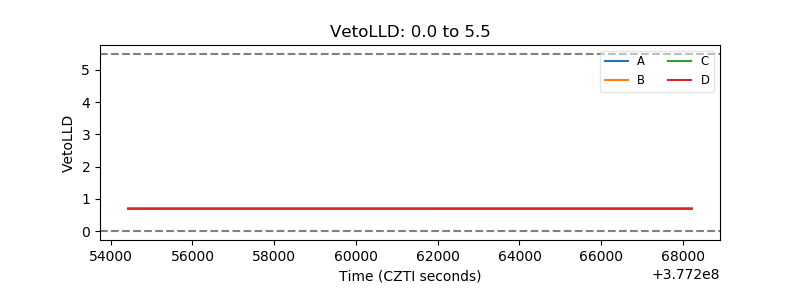 |
| Alpha Counter | 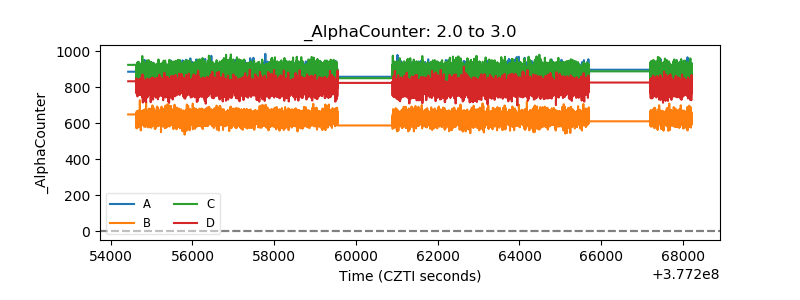 |
| _CPM_Rate | 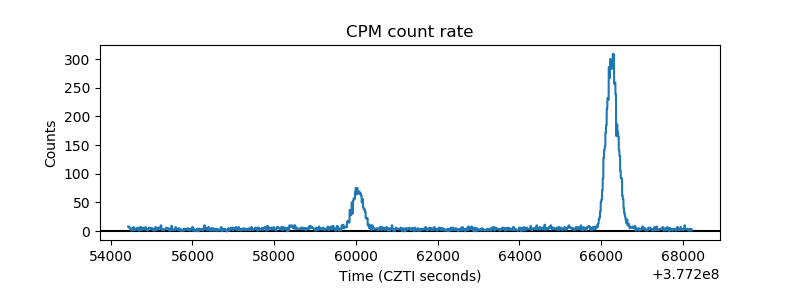 |
| CZT Counter | 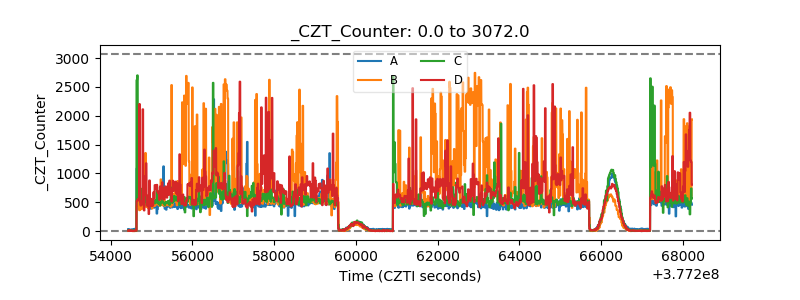 |
| +2.5 Volts monitor |  |
| +5 Volts monitor |  |
| _ROLL_ROT | 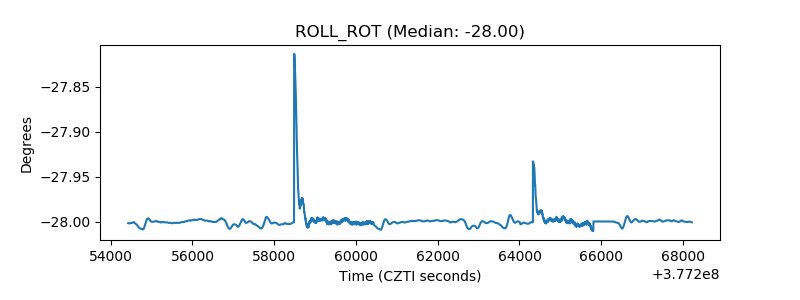 |
| _Roll_DEC |  |
| _Roll_RA | 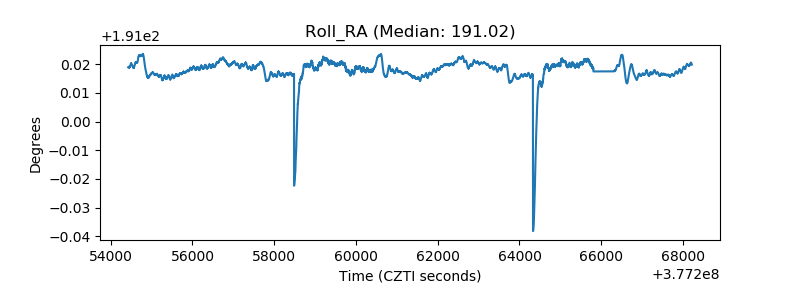 |
| Veto Counter | 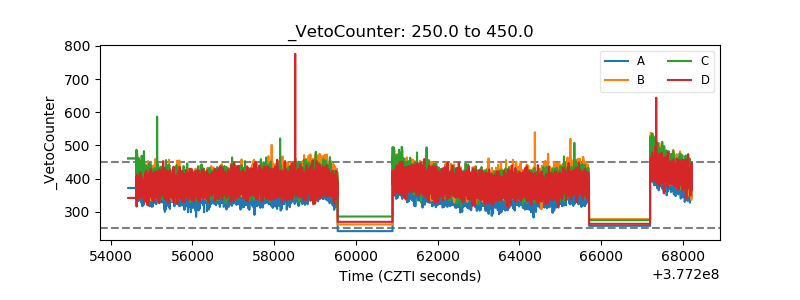 |