| Param | Original file | Final file |
|---|---|---|
| Filename | modeM0/AS1T04_076T01_9000004810_33609cztM0_level2.evt | modeM0/AS1T04_076T01_9000004810_33609cztM0_level2_quad_clean.evt |
| Size (bytes) | 585,083,520 | 59,711,040 |
| Size | 558.0 MB | 56.9 MB |
| Events in quadrant A | 2,910,248 | 367,071 |
| Events in quadrant B | 4,884,905 | 366,986 |
| Events in quadrant C | 3,327,068 | 369,869 |
| Events in quadrant D | 6,228,261 | 321,999 |
| Mode SS | |||
|---|---|---|---|
| Quadrant | BADHDUFLAG | Total packets | Discarded packets |
| A | 0 | 110 | 0 |
| B | 0 | 110 | 0 |
| C | 0 | 110 | 0 |
| D | 0 | 110 | 0 |
| Mode M9 | |||
|---|---|---|---|
| Quadrant | BADHDUFLAG | Total packets | Discarded packets |
| A | 0 | 22 | 0 |
| B | 0 | 22 | 0 |
| C | 0 | 22 | 0 |
| D | 0 | 23 | 0 |
| Mode M0 | |||
|---|---|---|---|
| Quadrant | BADHDUFLAG | Total packets | Discarded packets |
| A | 0 | 12128 | 3 |
| B | 0 | 18115 | 2 |
| C | 0 | 13300 | 2 |
| D | 0 | 22407 | 2 |
| Quadrant | Total seconds | Saturated seconds | Saturation percentage |
|---|---|---|---|
| A | 5455 | 36 | 0.659945% |
| B | 5455 | 705 | 12.923923% |
| C | 5455 | 123 | 2.254812% |
| D | 5455 | 859 | 15.747021% |
Noise dominated data is calculated using 1-second bins in cleaned event files. If a bin has >2000 counts, and if more than 50% of those come from <1% of pixels, then it is considered to be noise-dominated and hence unusable.
| Quadrant | # 1 sec bins | Bins with >0 counts | Bins with >2000 counts | High rate bins dominated by noise | Noise dominated (total time) | Noise dominated (detector-on time) | Marked lightcurve |
|---|---|---|---|---|---|---|---|
| A | 7307 | 5456 | 22 | 22 | 0.30% | 0.40% | 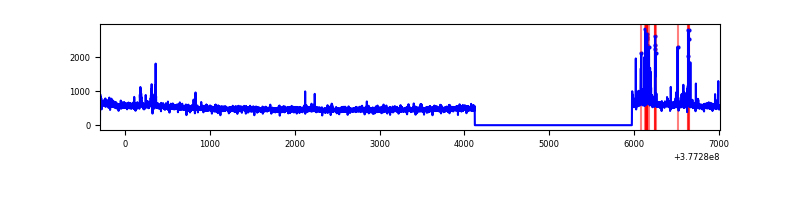 |
| B | 7307 | 5456 | 523 | 523 | 7.16% | 9.59% |  |
| C | 7307 | 5456 | 85 | 85 | 1.16% | 1.56% | 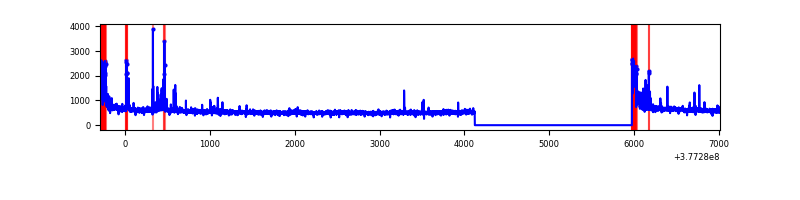 |
| D | 7307 | 5456 | 853 | 853 | 11.67% | 15.63% | 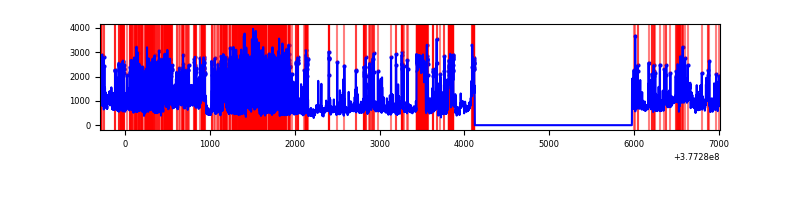 |
Top three noisy pixels from each quadrant. If the there are fewer than three noisy pixels in the level2.evt file, extra rows are filled as -1
| Pixel properties | Quadrant properties | ||||||
|---|---|---|---|---|---|---|---|
| Quadrant | DetID | PixID | Counts | Sigma | Mean | Median | Sigma |
| A | 15 | 237 | 142855 | 1007.98 | 703 | 688 | 141.0 |
| A | 15 | 169 | 21072 | 144.52 | 703 | 688 | 141.0 |
| A | 13 | 6 | 20554 | 140.85 | 703 | 688 | 141.0 |
| B | 5 | 172 | 1819634 | 14594.58 | 664 | 648 | 124.6 |
| B | 5 | 255 | 120928 | 965.06 | 664 | 648 | 124.6 |
| B | 0 | 214 | 53707 | 425.72 | 664 | 648 | 124.6 |
| C | 0 | 10 | 298352 | 1882.85 | 689 | 697 | 158.1 |
| C | 15 | 214 | 234199 | 1477.04 | 689 | 697 | 158.1 |
| C | 3 | 233 | 45338 | 282.38 | 689 | 697 | 158.1 |
| D | 1 | 52 | 1448072 | 8147.29 | 650 | 637 | 177.7 |
| D | 8 | 195 | 825940 | 4645.45 | 650 | 637 | 177.7 |
| D | 15 | 0 | 501431 | 2818.86 | 650 | 637 | 177.7 |
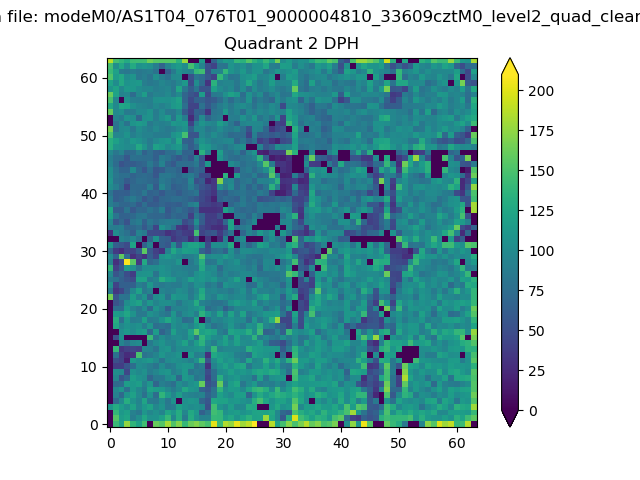
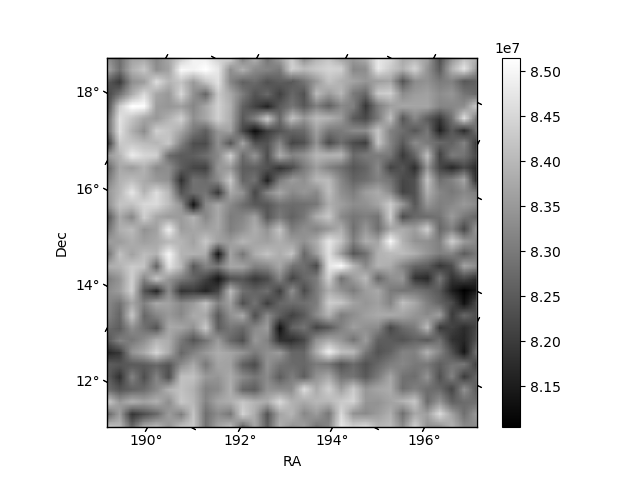
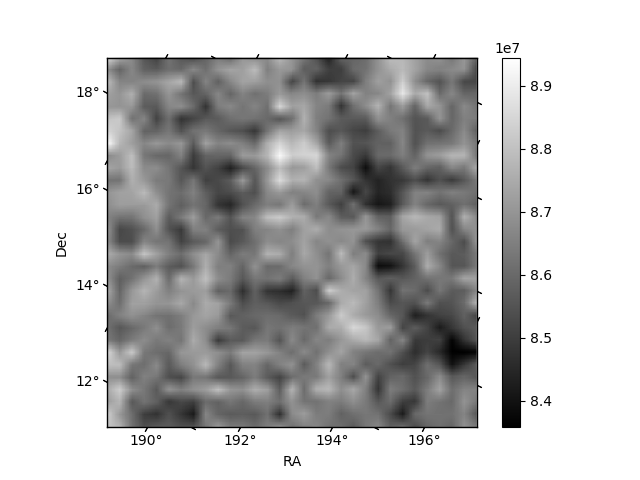
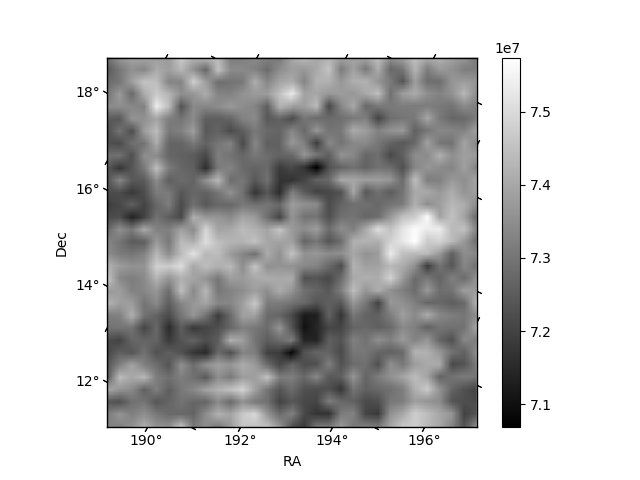
Histogram calculated using DETX and DETY for each event in the final _common_clean file
| Quadrant A | 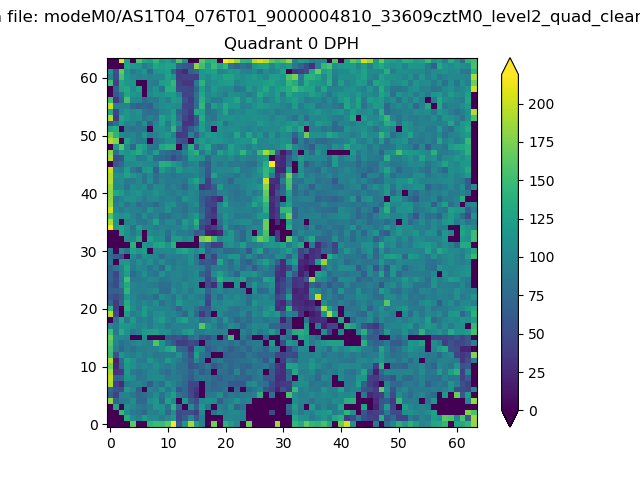 |
 |
Quadrant B |
|---|---|---|---|
| Quadrant D | 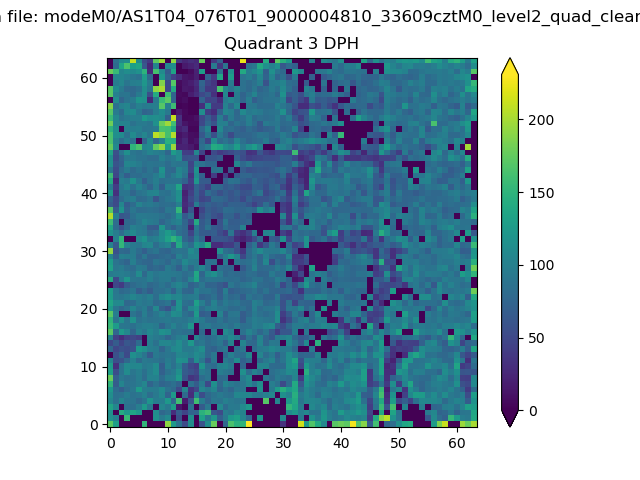 |
 |
Quadrant C |
| Plot type | Count rate plots | Images |
|---|---|---|
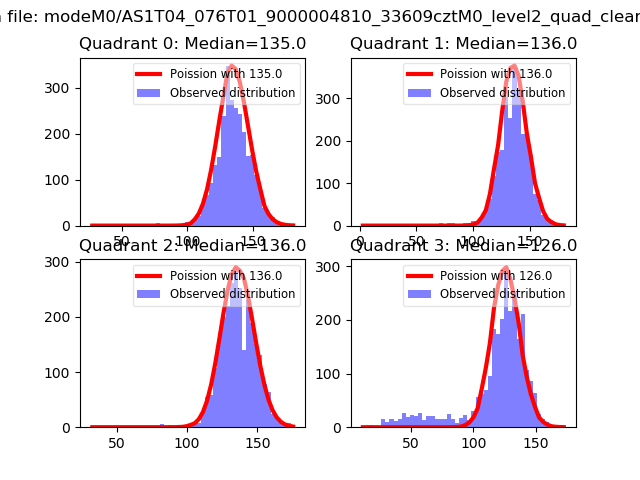
| Comparison with Poisson distribution Blue bars denote a histogram of data divided into 1 sec bins. Red curve is a Poisson curve with rate = median count rate of data. |
 |
 |
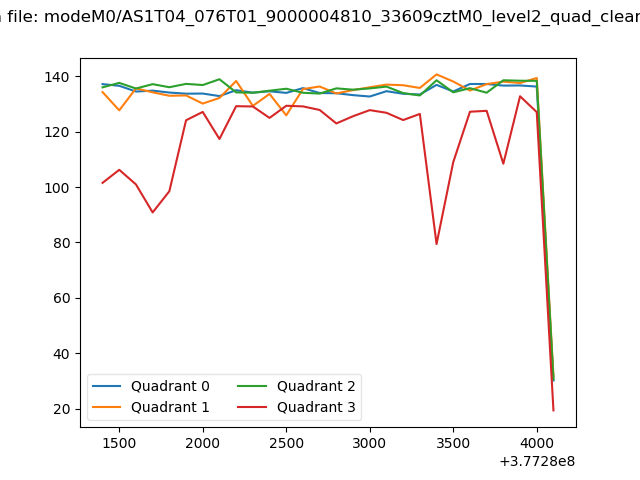
| Quadrant-wise count rates Data is divided into 100 sec bins |
 |
|
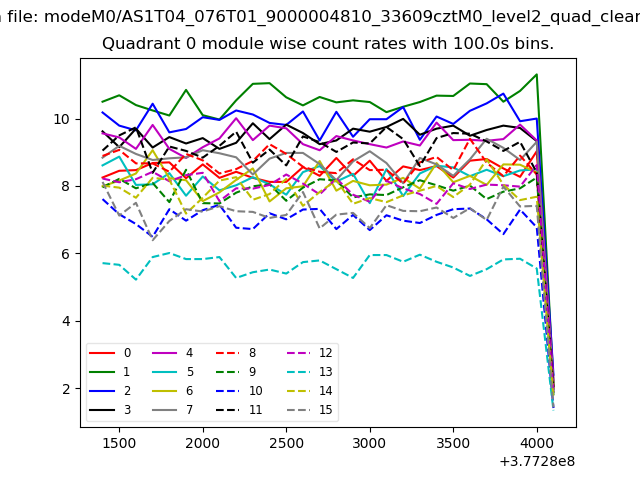
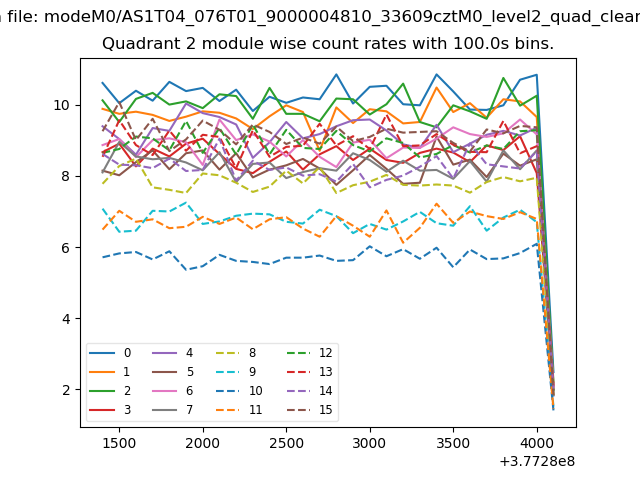
| Module-wise count rates for Quadrant A Data is divided into 100 sec bins |
 |
 |
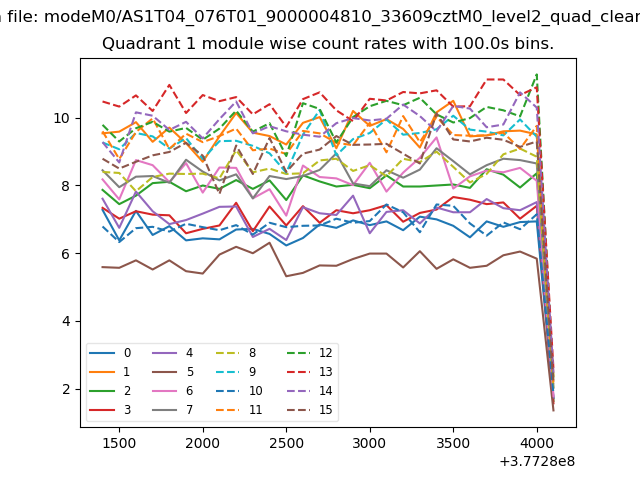
| Module-wise count rates for Quadrant B Data is divided into 100 sec bins |
 |
 |
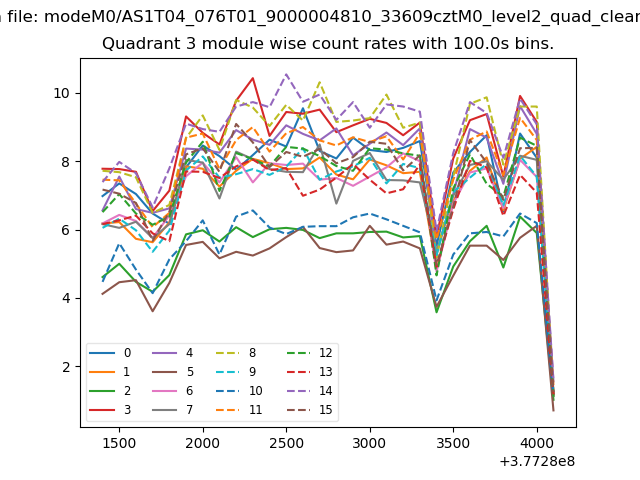
| Module-wise count rates for Quadrant C Data is divided into 100 sec bins |
 |
 |
| Module-wise count rates for Quadrant D Data is divided into 100 sec bins |
 |
 |
| Parameter | Plot |
|---|---|
| CZT HV Monitor | 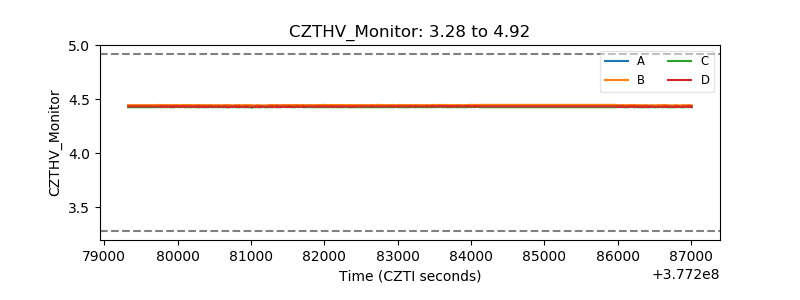 |
| D_VDD | 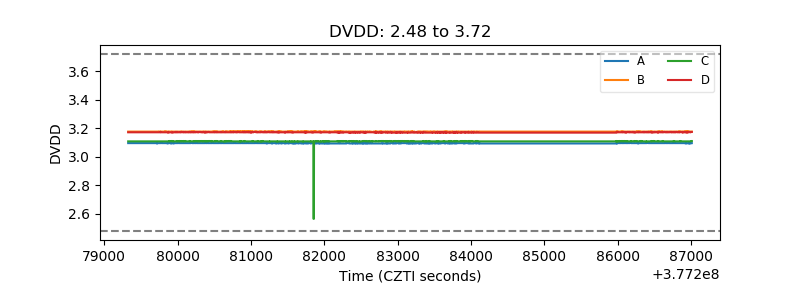 |
| Temperature 1 | 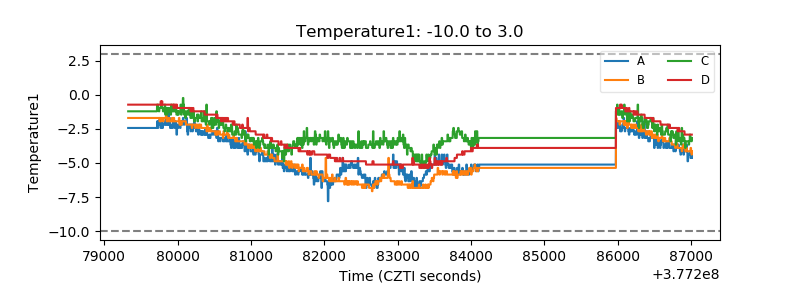 |
| Veto HV Monitor | 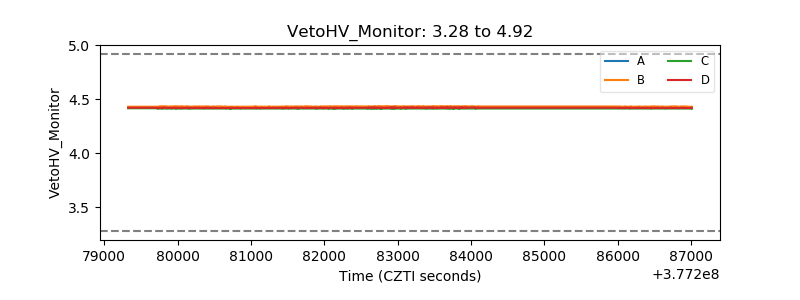 |
| Veto LLD | 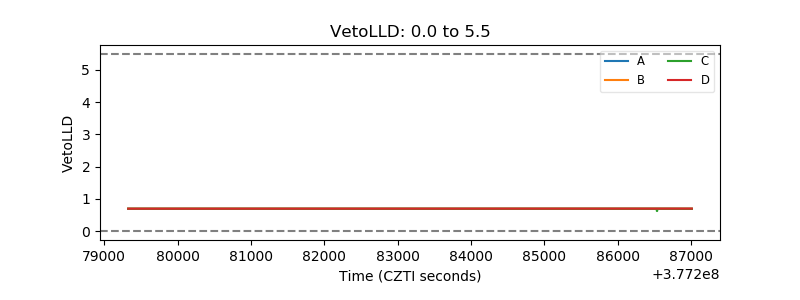 |
| Alpha Counter | 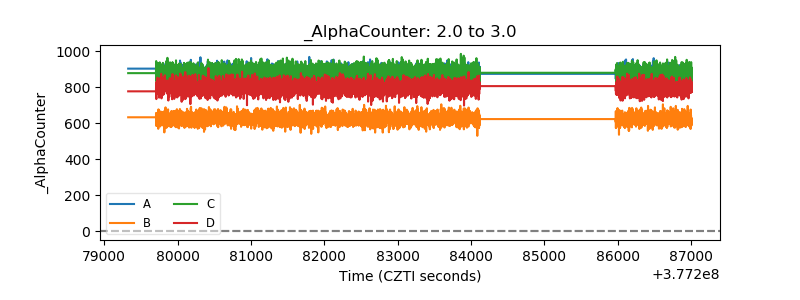 |
| _CPM_Rate | 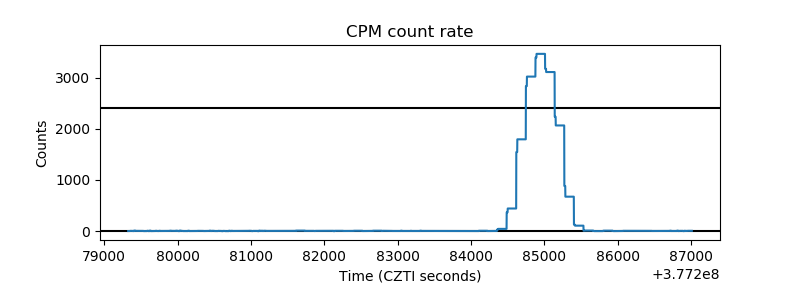 |
| CZT Counter |  |
| +2.5 Volts monitor |  |
| +5 Volts monitor | 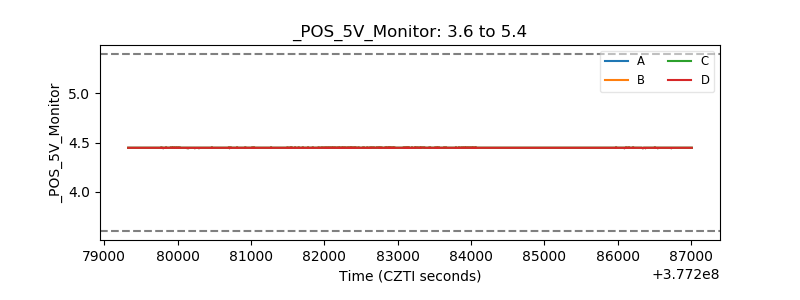 |
| _ROLL_ROT | 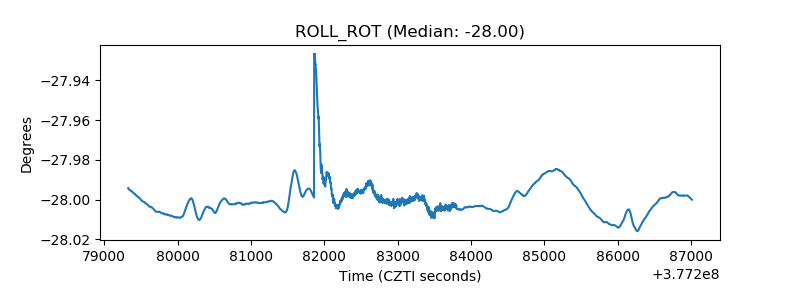 |
| _Roll_DEC | 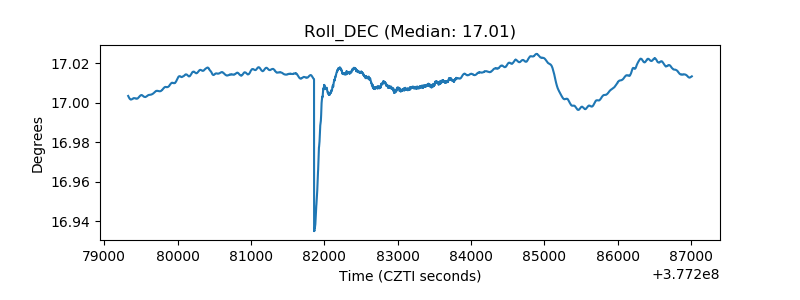 |
| _Roll_RA | 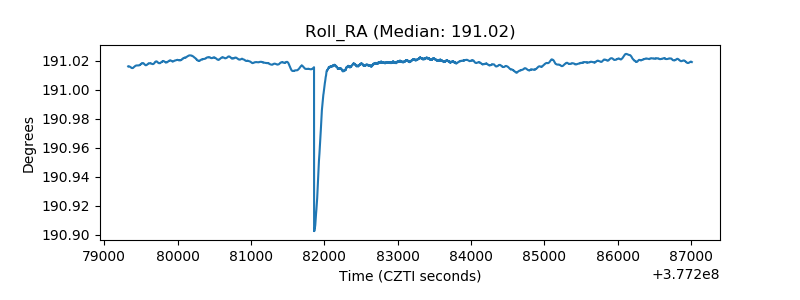 |
| Veto Counter | 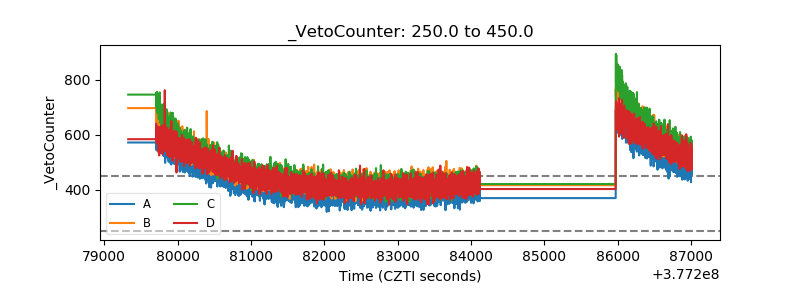 |