| Param | Original file | Final file |
|---|---|---|
| Filename | modeM0/AS1T04_076T01_9000004810_33610cztM0_level2.evt | modeM0/AS1T04_076T01_9000004810_33610cztM0_level2_quad_clean.evt |
| Size (bytes) | 518,296,320 | 67,245,120 |
| Size | 494.3 MB | 64.1 MB |
| Events in quadrant A | 2,921,511 | 429,639 |
| Events in quadrant B | 4,187,322 | 433,355 |
| Events in quadrant C | 2,939,687 | 438,151 |
| Events in quadrant D | 5,319,711 | 394,367 |
| Mode SS | |||
|---|---|---|---|
| Quadrant | BADHDUFLAG | Total packets | Discarded packets |
| A | 0 | 98 | 0 |
| B | 0 | 98 | 0 |
| C | 0 | 98 | 0 |
| D | 0 | 98 | 0 |
| Mode M9 | |||
|---|---|---|---|
| Quadrant | BADHDUFLAG | Total packets | Discarded packets |
| A | 0 | 20 | 0 |
| B | 0 | 20 | 0 |
| C | 0 | 20 | 0 |
| D | 0 | 20 | 0 |
| Mode M0 | |||
|---|---|---|---|
| Quadrant | BADHDUFLAG | Total packets | Discarded packets |
| A | 0 | 11736 | 2 |
| B | 0 | 15653 | 1 |
| C | 0 | 11799 | 1 |
| D | 0 | 19230 | 1 |
| Quadrant | Total seconds | Saturated seconds | Saturation percentage |
|---|---|---|---|
| A | 4857 | 56 | 1.152975% |
| B | 4857 | 660 | 13.588635% |
| C | 4857 | 62 | 1.276508% |
| D | 4857 | 474 | 9.759111% |
Noise dominated data is calculated using 1-second bins in cleaned event files. If a bin has >2000 counts, and if more than 50% of those come from <1% of pixels, then it is considered to be noise-dominated and hence unusable.
| Quadrant | # 1 sec bins | Bins with >0 counts | Bins with >2000 counts | High rate bins dominated by noise | Noise dominated (total time) | Noise dominated (detector-on time) | Marked lightcurve |
|---|---|---|---|---|---|---|---|
| A | 6830 | 4858 | 43 | 43 | 0.63% | 0.89% | 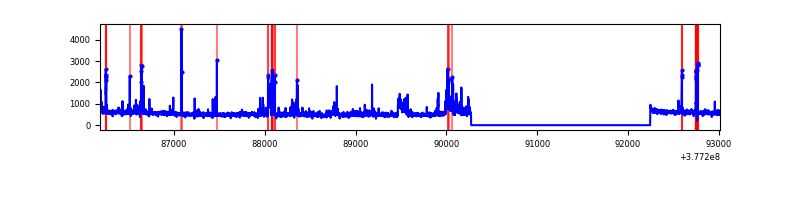 |
| B | 6830 | 4858 | 532 | 532 | 7.79% | 10.95% | 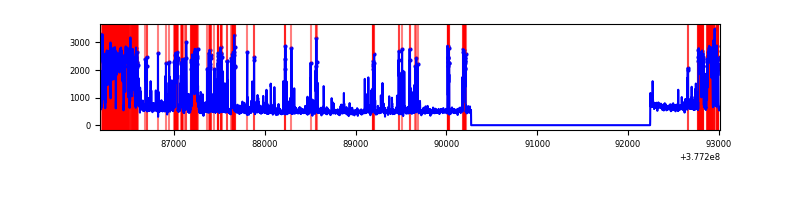 |
| C | 6830 | 4858 | 49 | 49 | 0.72% | 1.01% | 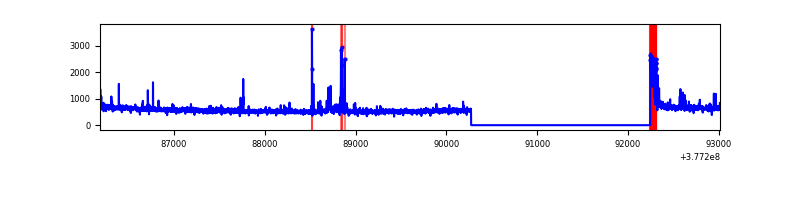 |
| D | 6830 | 4858 | 475 | 475 | 6.95% | 9.78% | 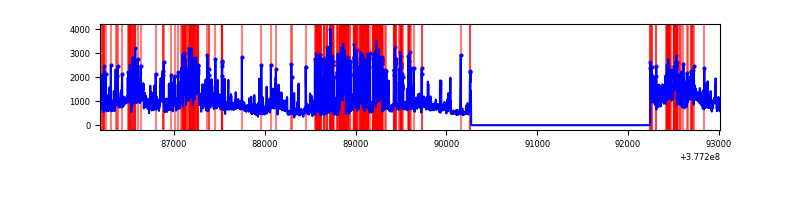 |
Top three noisy pixels from each quadrant. If the there are fewer than three noisy pixels in the level2.evt file, extra rows are filled as -1
| Pixel properties | Quadrant properties | ||||||
|---|---|---|---|---|---|---|---|
| Quadrant | DetID | PixID | Counts | Sigma | Mean | Median | Sigma |
| A | 15 | 169 | 326346 | 2605.58 | 635 | 626 | 125.0 |
| A | 15 | 237 | 117874 | 937.92 | 635 | 626 | 125.0 |
| A | 13 | 6 | 17555 | 135.42 | 635 | 626 | 125.0 |
| B | 5 | 172 | 1519609 | 13589.75 | 596 | 583 | 111.8 |
| B | 5 | 255 | 207219 | 1848.64 | 596 | 583 | 111.8 |
| B | 4 | 81 | 19756 | 171.53 | 596 | 583 | 111.8 |
| C | 15 | 214 | 203487 | 1411.22 | 628 | 636 | 143.7 |
| C | 0 | 10 | 164530 | 1140.2 | 628 | 636 | 143.7 |
| C | 14 | 254 | 61371 | 422.53 | 628 | 636 | 143.7 |
| D | 7 | 80 | 904072 | 5757.56 | 602 | 590 | 156.9 |
| D | 8 | 195 | 865952 | 5514.63 | 602 | 590 | 156.9 |
| D | 2 | 250 | 465856 | 2964.97 | 602 | 590 | 156.9 |
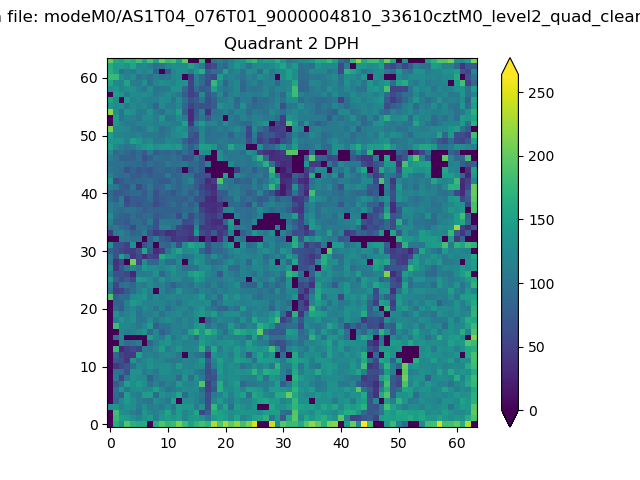
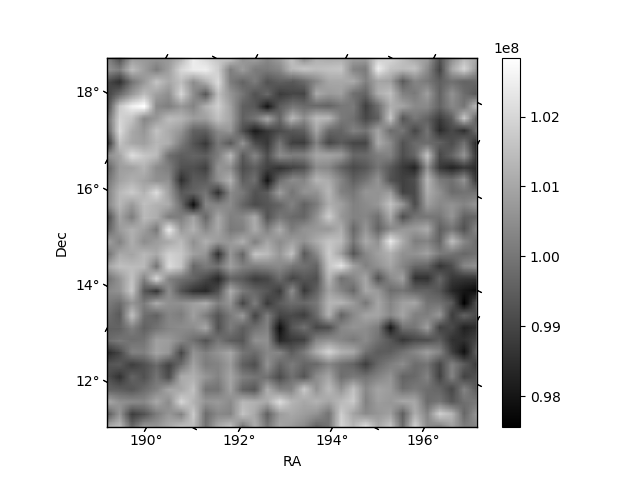
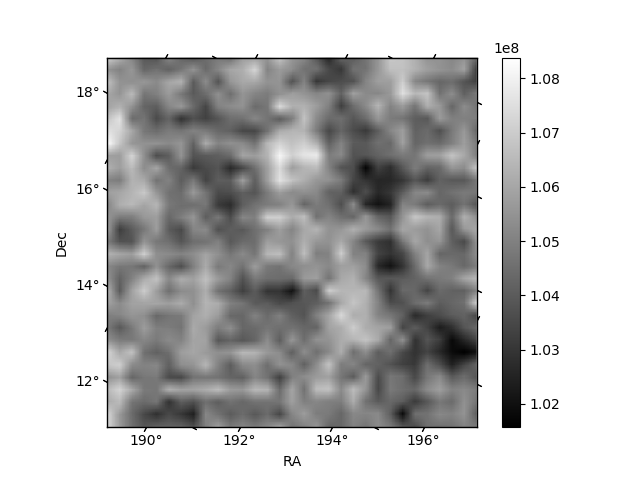
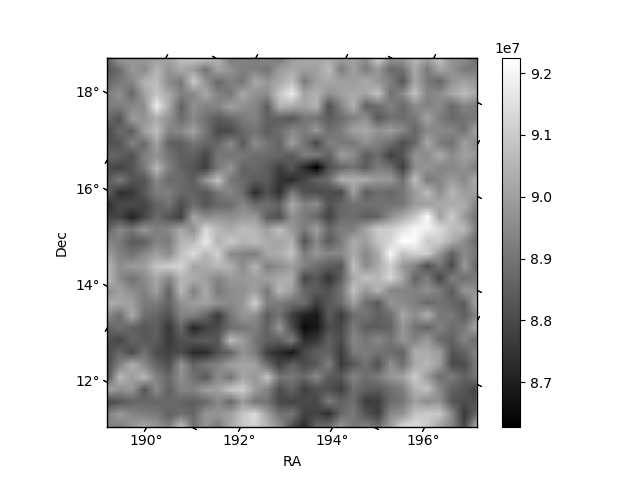
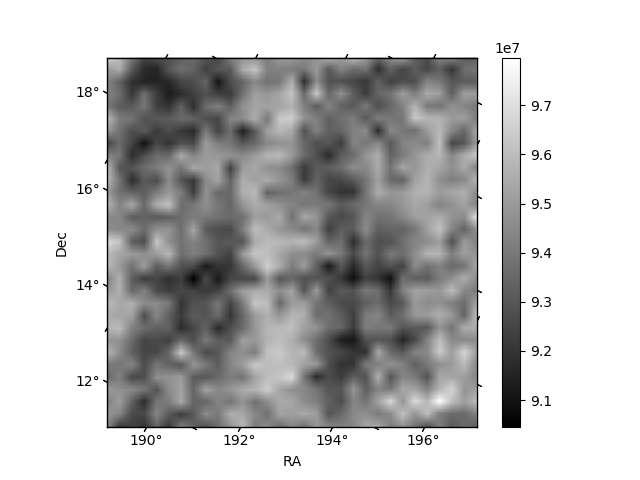
Histogram calculated using DETX and DETY for each event in the final _common_clean file
| Quadrant A | 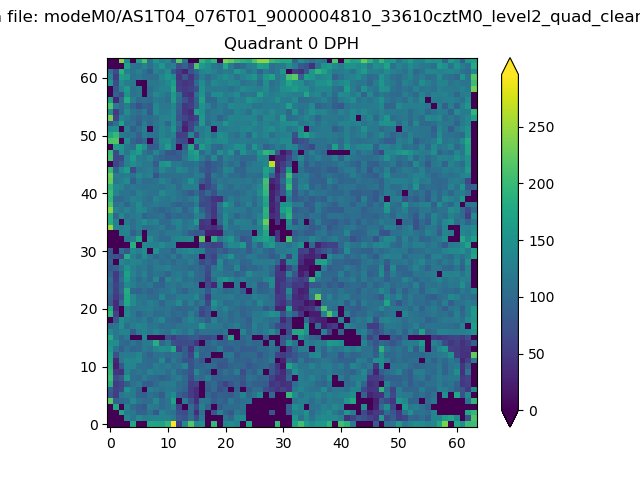 |
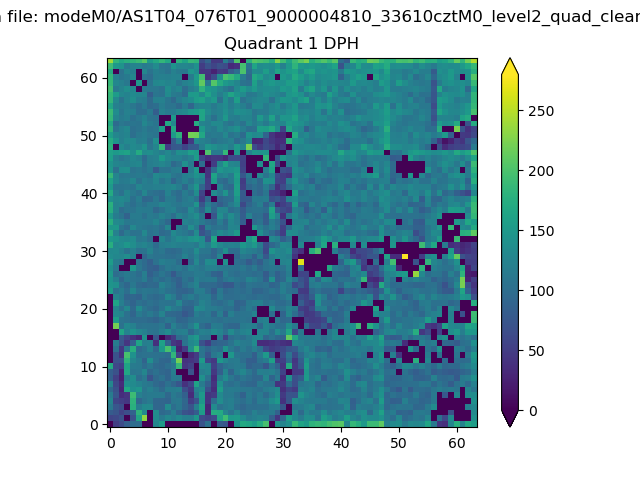 |
Quadrant B |
|---|---|---|---|
| Quadrant D | 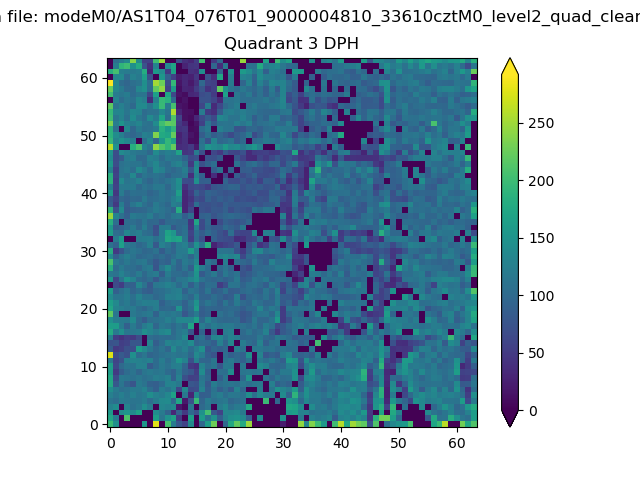 |
 |
Quadrant C |
| Plot type | Count rate plots | Images |
|---|---|---|
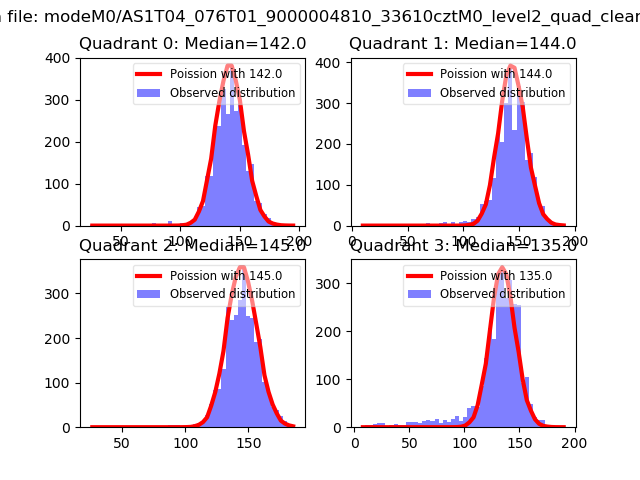
| Comparison with Poisson distribution Blue bars denote a histogram of data divided into 1 sec bins. Red curve is a Poisson curve with rate = median count rate of data. |
 |
 |
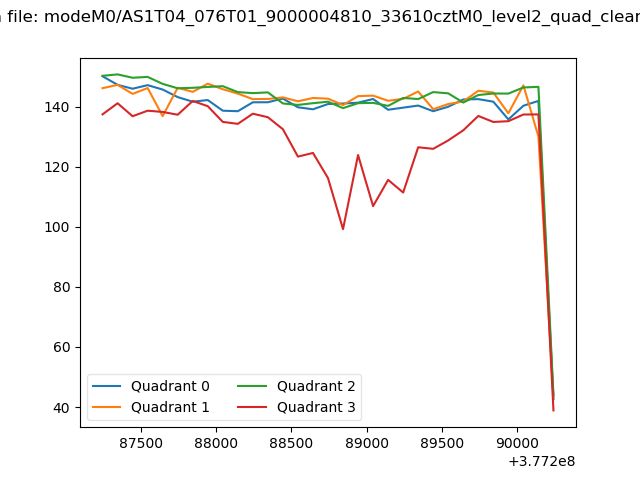
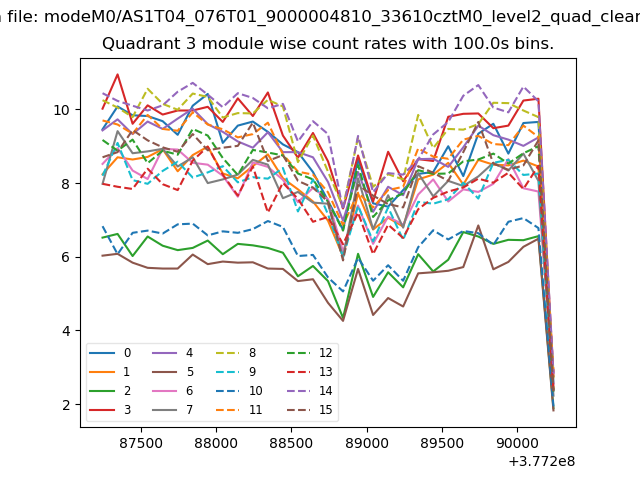
| Quadrant-wise count rates Data is divided into 100 sec bins |
 |
|
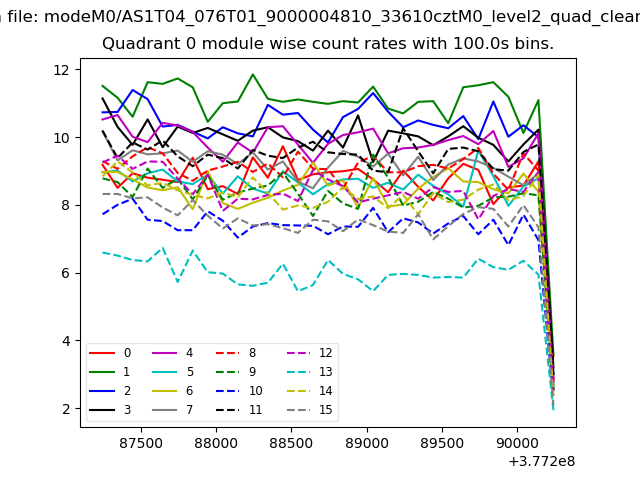
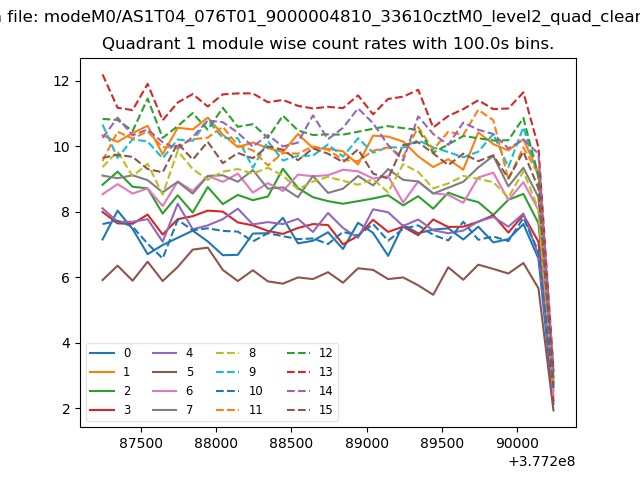
| Module-wise count rates for Quadrant A Data is divided into 100 sec bins |
 |
 |
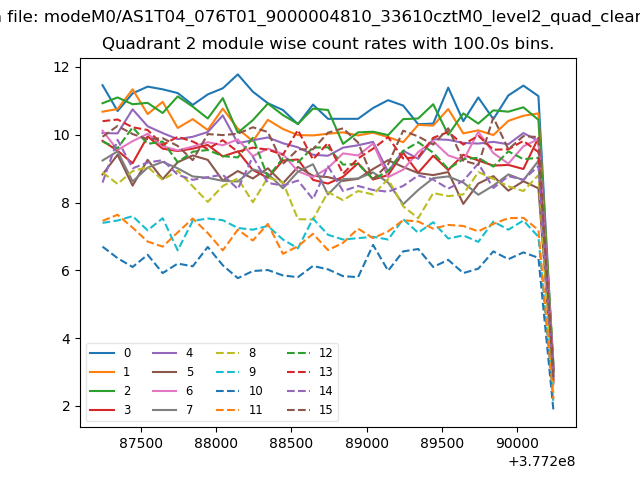
| Module-wise count rates for Quadrant B Data is divided into 100 sec bins |
 |
 |
| Module-wise count rates for Quadrant C Data is divided into 100 sec bins |
 |
 |
| Module-wise count rates for Quadrant D Data is divided into 100 sec bins |
 |
 |
| Parameter | Plot |
|---|---|
| CZT HV Monitor | 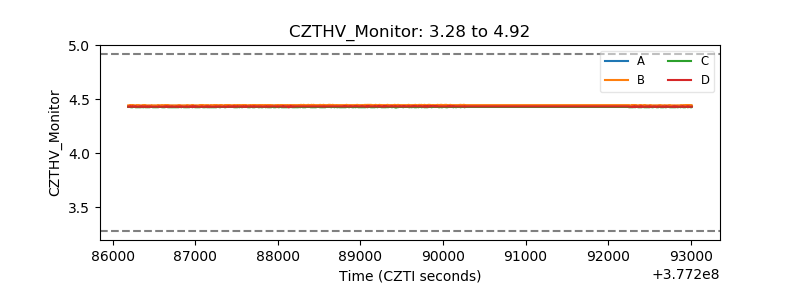 |
| D_VDD | 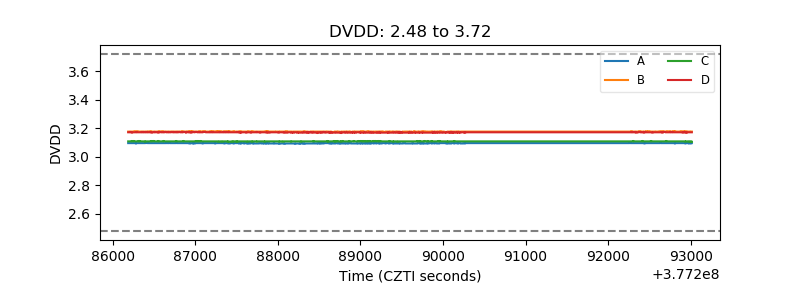 |
| Temperature 1 | 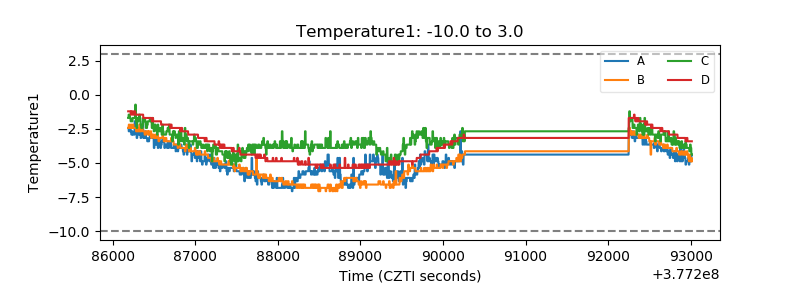 |
| Veto HV Monitor | 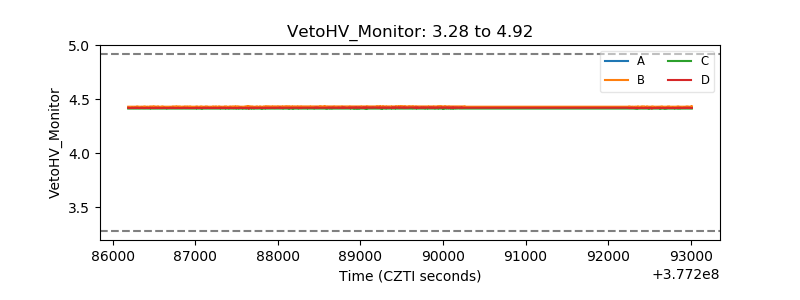 |
| Veto LLD | 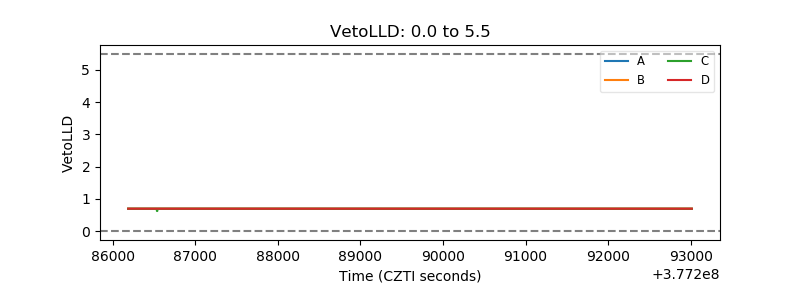 |
| Alpha Counter | 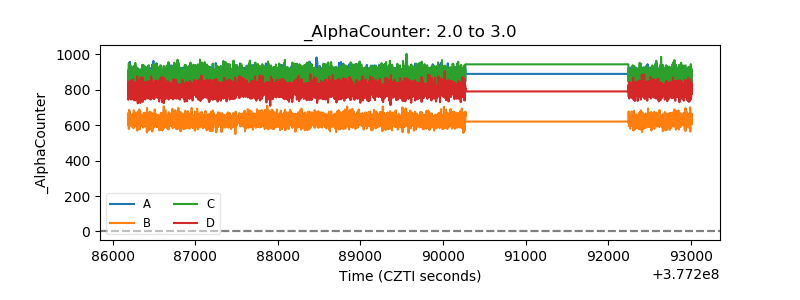 |
| _CPM_Rate | 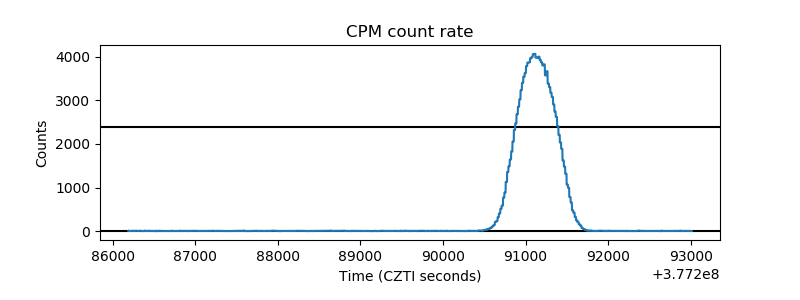 |
| CZT Counter | 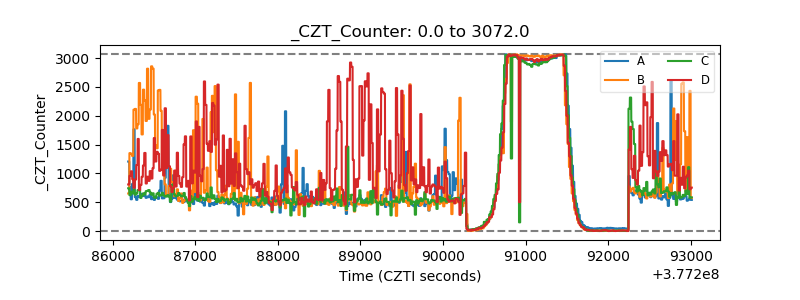 |
| +2.5 Volts monitor |  |
| +5 Volts monitor |  |
| _ROLL_ROT | 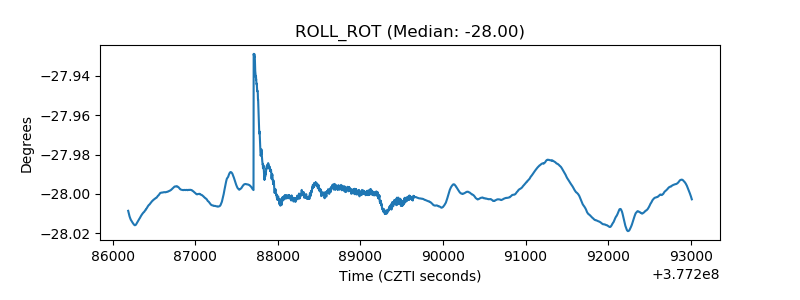 |
| _Roll_DEC | 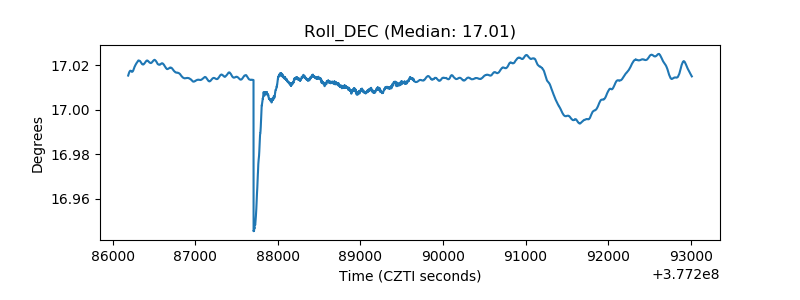 |
| _Roll_RA | 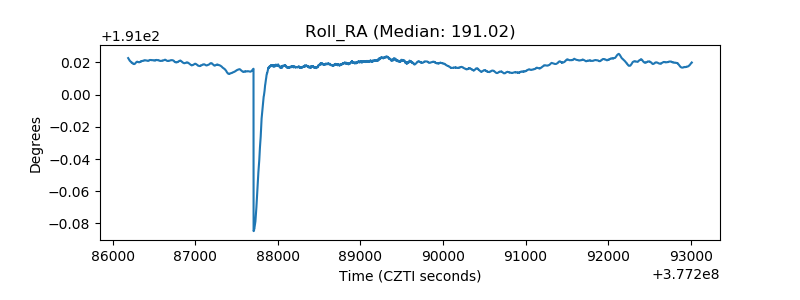 |
| Veto Counter | 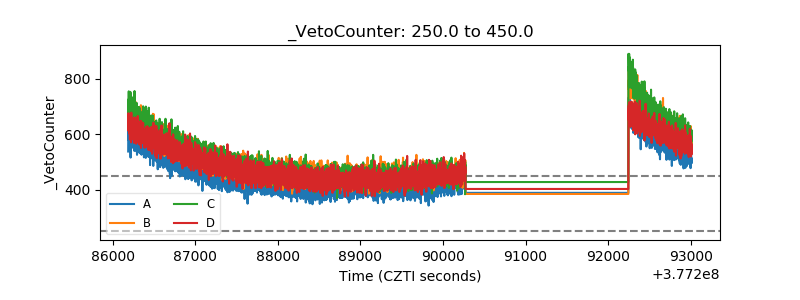 |