| Param | Original file | Final file |
|---|---|---|
| Filename | modeM0/AS1T04_076T01_9000004810_33611cztM0_level2.evt | modeM0/AS1T04_076T01_9000004810_33611cztM0_level2_quad_clean.evt |
| Size (bytes) | 479,257,920 | 84,856,320 |
| Size | 457.1 MB | 80.9 MB |
| Events in quadrant A | 2,741,719 | 561,247 |
| Events in quadrant B | 4,027,144 | 554,015 |
| Events in quadrant C | 3,198,863 | 568,877 |
| Events in quadrant D | 4,206,771 | 533,888 |
| Mode SS | |||
|---|---|---|---|
| Quadrant | BADHDUFLAG | Total packets | Discarded packets |
| A | 0 | 102 | 0 |
| B | 0 | 102 | 0 |
| C | 0 | 102 | 0 |
| D | 0 | 102 | 0 |
| Mode M9 | |||
|---|---|---|---|
| Quadrant | BADHDUFLAG | Total packets | Discarded packets |
| A | 0 | 24 | 0 |
| B | 0 | 24 | 0 |
| C | 0 | 24 | 0 |
| D | 0 | 25 | 0 |
| Mode M0 | |||
|---|---|---|---|
| Quadrant | BADHDUFLAG | Total packets | Discarded packets |
| A | 0 | 11246 | 3 |
| B | 0 | 15321 | 2 |
| C | 0 | 12754 | 2 |
| D | 0 | 16068 | 2 |
| Quadrant | Total seconds | Saturated seconds | Saturation percentage |
|---|---|---|---|
| A | 5016 | 54 | 1.076555% |
| B | 5016 | 418 | 8.333333% |
| C | 5016 | 103 | 2.053429% |
| D | 5016 | 160 | 3.189793% |
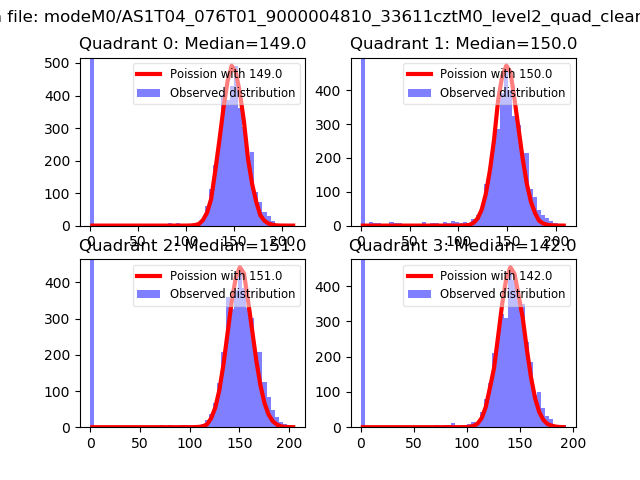
Noise dominated data is calculated using 1-second bins in cleaned event files. If a bin has >2000 counts, and if more than 50% of those come from <1% of pixels, then it is considered to be noise-dominated and hence unusable.
| Quadrant | # 1 sec bins | Bins with >0 counts | Bins with >2000 counts | High rate bins dominated by noise | Noise dominated (total time) | Noise dominated (detector-on time) | Marked lightcurve |
|---|---|---|---|---|---|---|---|
| A | 7078 | 5017 | 34 | 34 | 0.48% | 0.68% | 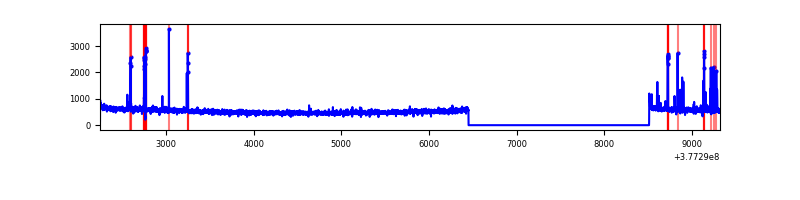 |
| B | 7078 | 5017 | 333 | 333 | 4.70% | 6.64% | 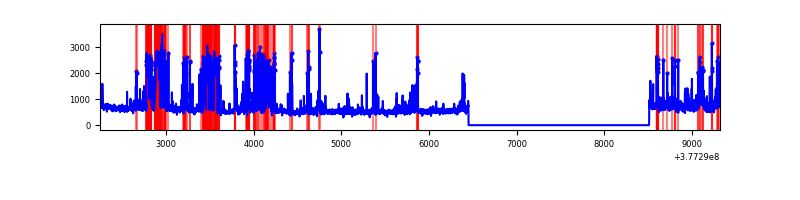 |
| C | 7078 | 5017 | 85 | 85 | 1.20% | 1.69% | 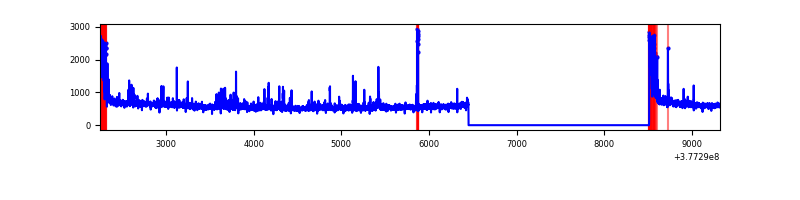 |
| D | 7078 | 5017 | 127 | 127 | 1.79% | 2.53% | 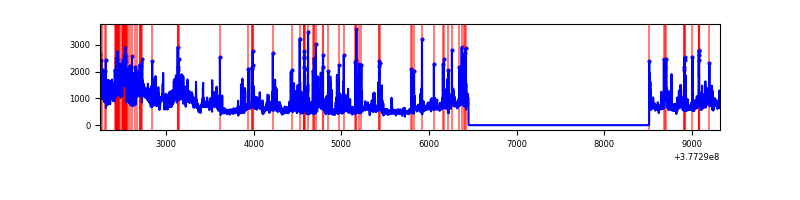 |
Top three noisy pixels from each quadrant. If the there are fewer than three noisy pixels in the level2.evt file, extra rows are filled as -1
| Pixel properties | Quadrant properties | ||||||
|---|---|---|---|---|---|---|---|
| Quadrant | DetID | PixID | Counts | Sigma | Mean | Median | Sigma |
| A | 15 | 237 | 131410 | 981.15 | 668 | 657 | 133.3 |
| A | 13 | 6 | 12737 | 90.65 | 668 | 657 | 133.3 |
| A | 15 | 169 | 9082 | 63.22 | 668 | 657 | 133.3 |
| B | 5 | 172 | 979540 | 7975.13 | 650 | 636 | 122.7 |
| B | 5 | 255 | 201836 | 1639.18 | 650 | 636 | 122.7 |
| B | 0 | 213 | 114269 | 925.77 | 650 | 636 | 122.7 |
| C | 0 | 10 | 320243 | 2137.92 | 653 | 662 | 149.5 |
| C | 15 | 214 | 214979 | 1433.73 | 653 | 662 | 149.5 |
| C | 3 | 233 | 66402 | 439.79 | 653 | 662 | 149.5 |
| D | 8 | 195 | 651676 | 4055.48 | 643 | 631 | 160.5 |
| D | 2 | 250 | 387994 | 2412.95 | 643 | 631 | 160.5 |
| D | 2 | 152 | 190036 | 1179.84 | 643 | 631 | 160.5 |
Histogram calculated using DETX and DETY for each event in the final _common_clean file
| Quadrant A |  |
 |
Quadrant B |
|---|---|---|---|
| Quadrant D |  |
 |
Quadrant C |
| Plot type | Count rate plots | Images |
|---|---|---|
| Comparison with Poisson distribution Blue bars denote a histogram of data divided into 1 sec bins. Red curve is a Poisson curve with rate = median count rate of data. |
 |
 |
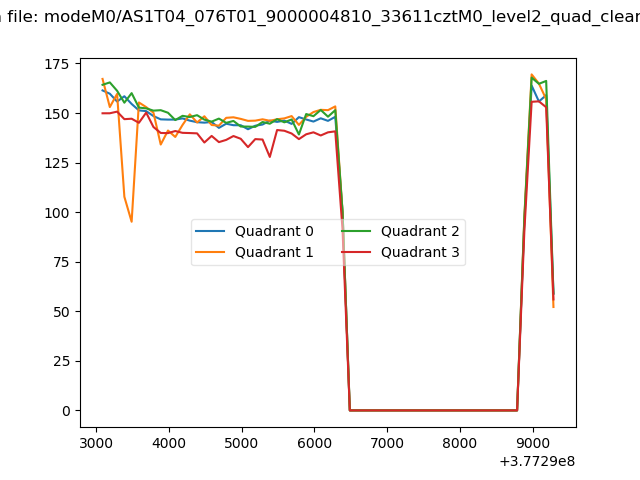
| Quadrant-wise count rates Data is divided into 100 sec bins |
 |
|
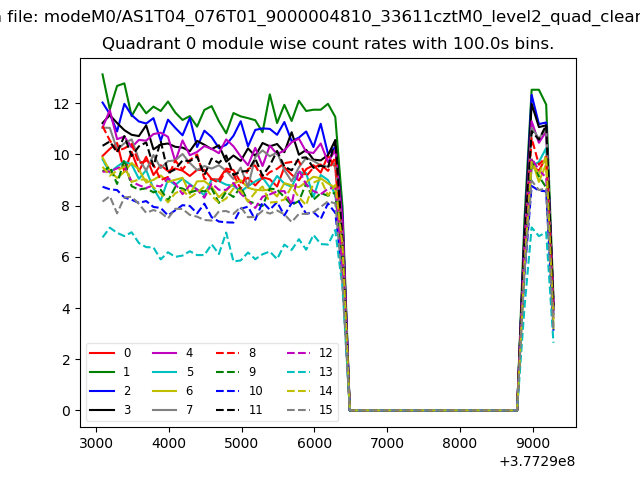
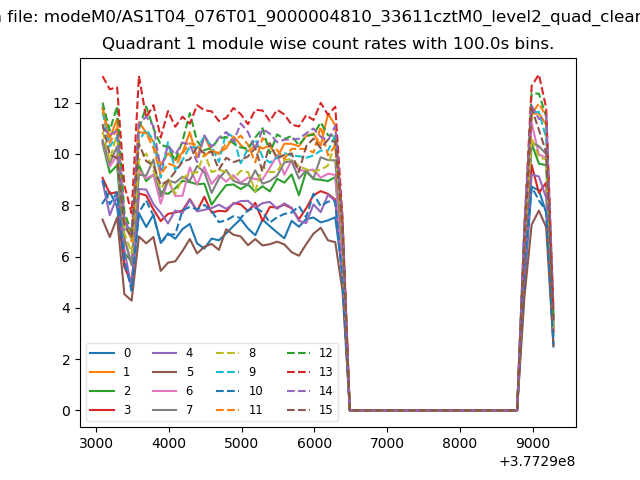
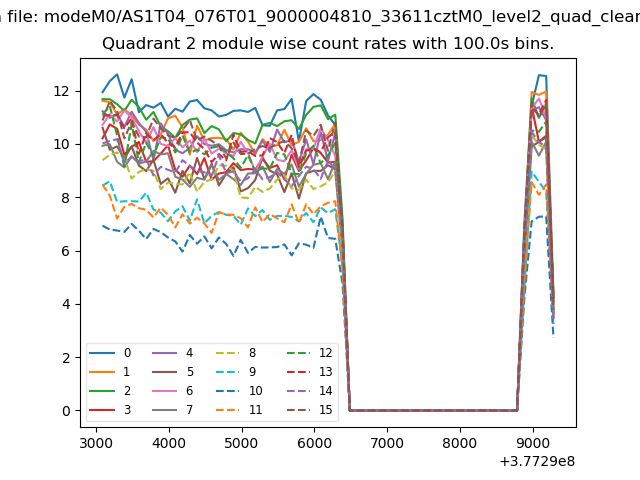
| Module-wise count rates for Quadrant A Data is divided into 100 sec bins |
 |
 |
| Module-wise count rates for Quadrant B Data is divided into 100 sec bins |
 |
 |
| Module-wise count rates for Quadrant C Data is divided into 100 sec bins |
 |
 |
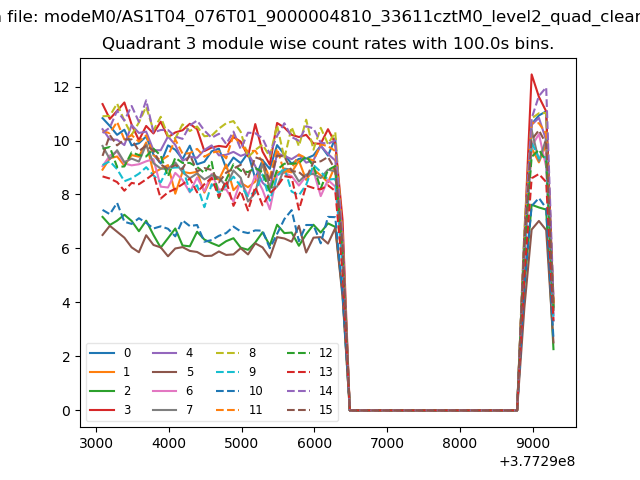
| Module-wise count rates for Quadrant D Data is divided into 100 sec bins |
 |
 |
| Parameter | Plot |
|---|---|
| CZT HV Monitor | 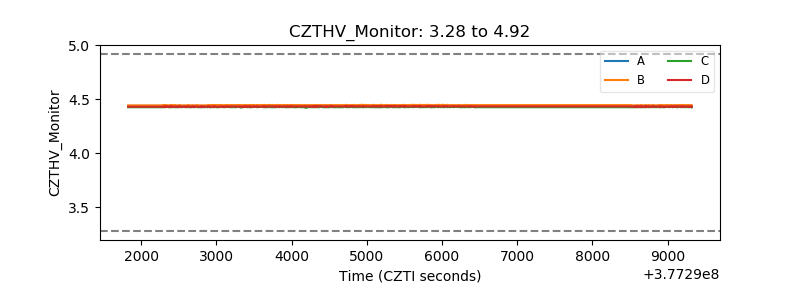 |
| D_VDD | 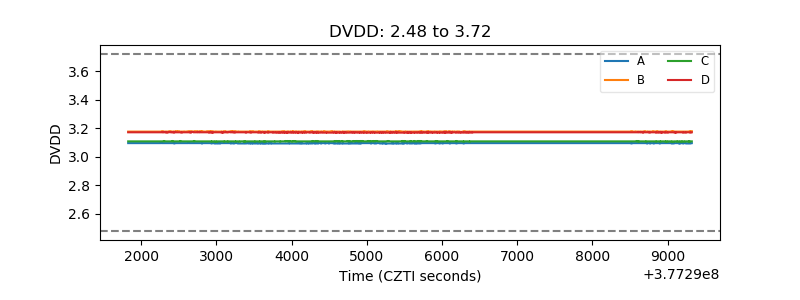 |
| Temperature 1 | 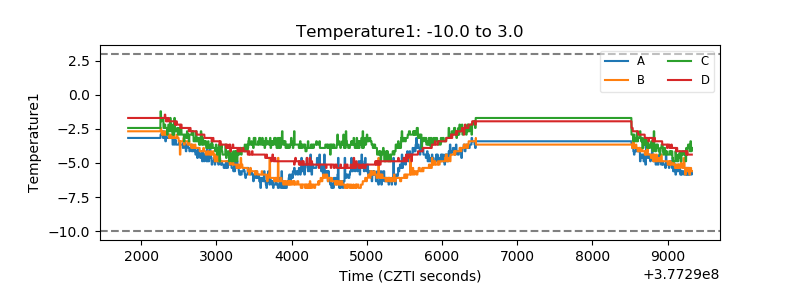 |
| Veto HV Monitor |  |
| Veto LLD | 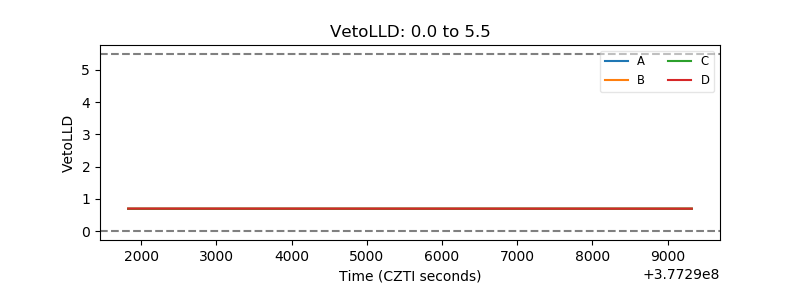 |
| Alpha Counter | 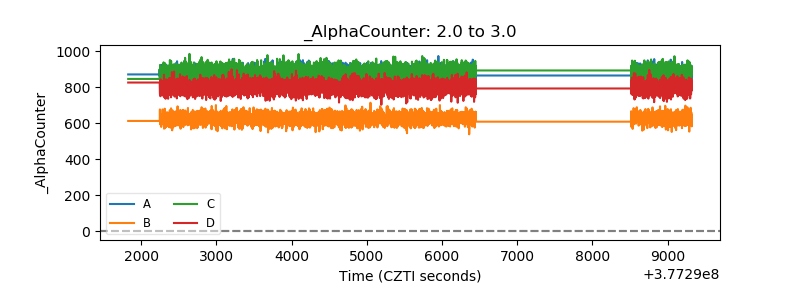 |
| _CPM_Rate | 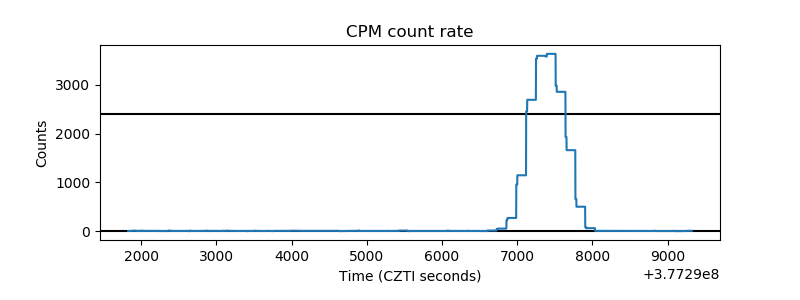 |
| CZT Counter | 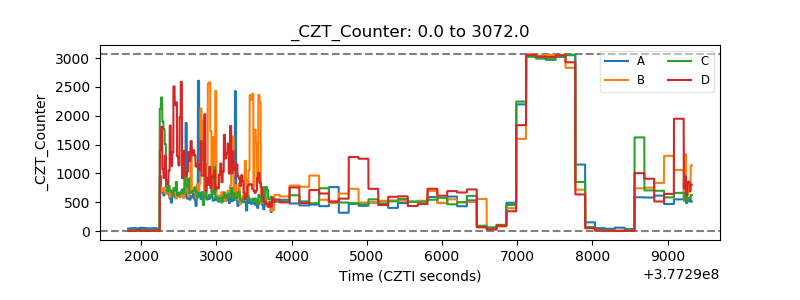 |
| +2.5 Volts monitor | 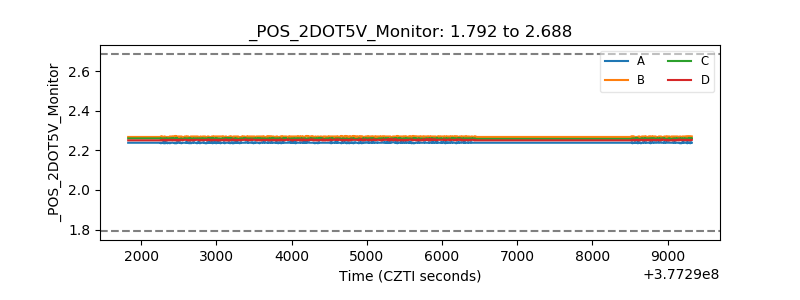 |
| +5 Volts monitor | 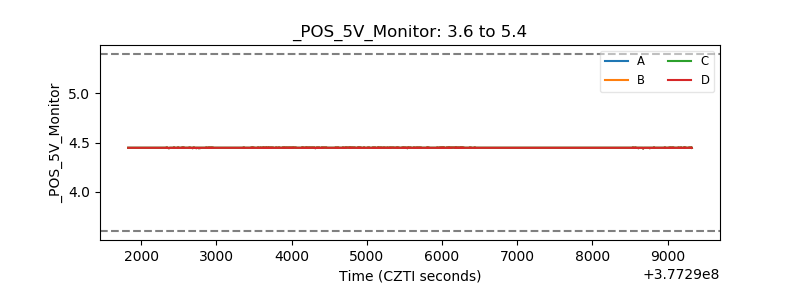 |
| _ROLL_ROT | 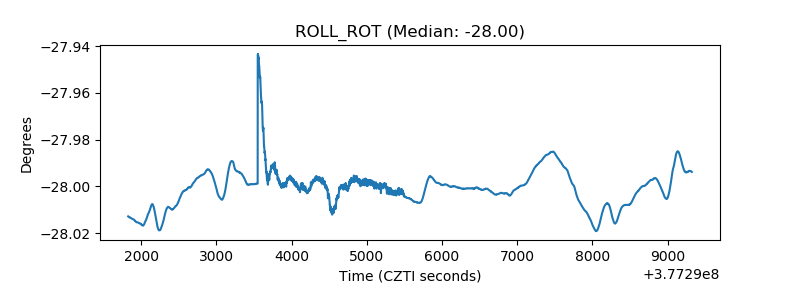 |
| _Roll_DEC | 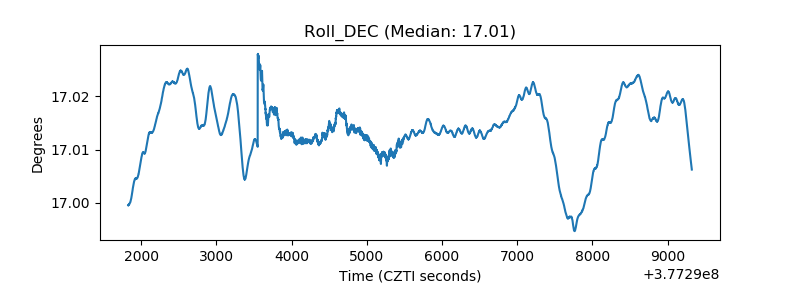 |
| _Roll_RA | 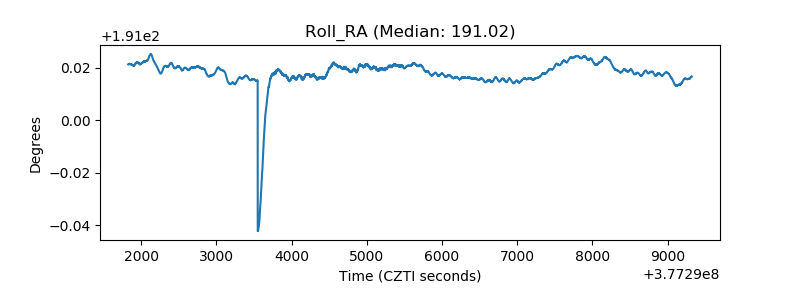 |
| Veto Counter | 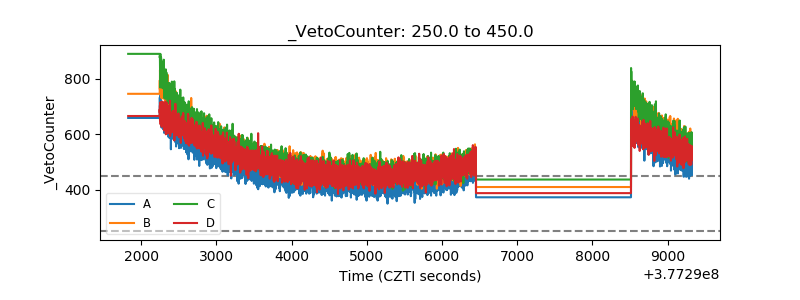 |