| Param | Original file | Final file |
|---|---|---|
| Filename | modeM0/AS1T04_076T01_9000004810_33612cztM0_level2.evt | modeM0/AS1T04_076T01_9000004810_33612cztM0_level2_quad_clean.evt |
| Size (bytes) | 455,607,360 | 95,310,720 |
| Size | 434.5 MB | 90.9 MB |
| Events in quadrant A | 2,623,565 | 644,707 |
| Events in quadrant B | 3,787,207 | 644,470 |
| Events in quadrant C | 3,015,708 | 648,639 |
| Events in quadrant D | 4,037,428 | 602,924 |
| Mode SS | |||
|---|---|---|---|
| Quadrant | BADHDUFLAG | Total packets | Discarded packets |
| A | 0 | 102 | 0 |
| B | 0 | 102 | 0 |
| C | 0 | 102 | 0 |
| D | 0 | 102 | 0 |
| Mode M9 | |||
|---|---|---|---|
| Quadrant | BADHDUFLAG | Total packets | Discarded packets |
| A | 0 | 38 | 0 |
| B | 0 | 38 | 0 |
| C | 0 | 38 | 0 |
| D | 0 | 39 | 0 |
| Mode M0 | |||
|---|---|---|---|
| Quadrant | BADHDUFLAG | Total packets | Discarded packets |
| A | 0 | 10810 | 3 |
| B | 0 | 14510 | 2 |
| C | 0 | 11889 | 2 |
| D | 0 | 15494 | 2 |
| Quadrant | Total seconds | Saturated seconds | Saturation percentage |
|---|---|---|---|
| A | 4922 | 35 | 0.711093% |
| B | 4922 | 375 | 7.618854% |
| C | 4922 | 97 | 1.970744% |
| D | 4922 | 188 | 3.819586% |
Noise dominated data is calculated using 1-second bins in cleaned event files. If a bin has >2000 counts, and if more than 50% of those come from <1% of pixels, then it is considered to be noise-dominated and hence unusable.
| Quadrant | # 1 sec bins | Bins with >0 counts | Bins with >2000 counts | High rate bins dominated by noise | Noise dominated (total time) | Noise dominated (detector-on time) | Marked lightcurve |
|---|---|---|---|---|---|---|---|
| A | 7045 | 4923 | 24 | 24 | 0.34% | 0.49% | 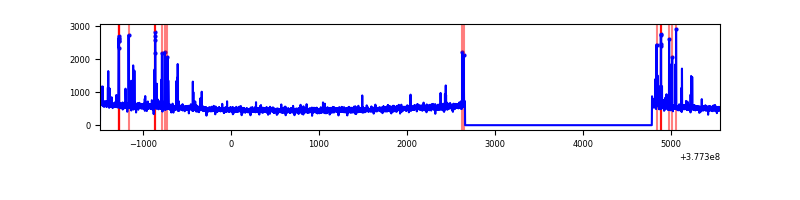 |
| B | 7045 | 4923 | 304 | 304 | 4.32% | 6.18% | 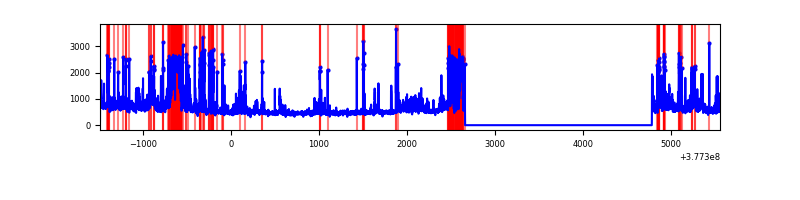 |
| C | 7045 | 4923 | 72 | 72 | 1.02% | 1.46% | 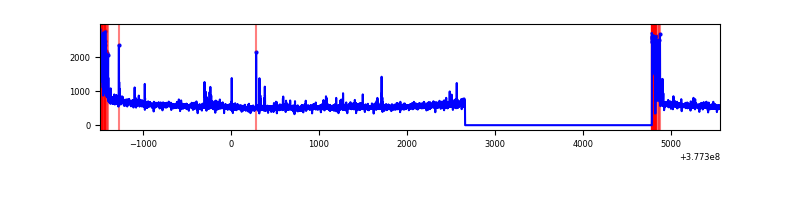 |
| D | 7045 | 4923 | 184 | 184 | 2.61% | 3.74% | 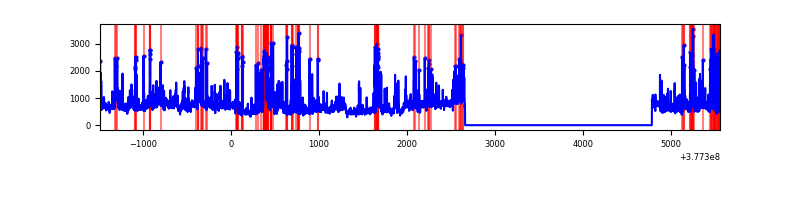 |
Top three noisy pixels from each quadrant. If the there are fewer than three noisy pixels in the level2.evt file, extra rows are filled as -1
| Pixel properties | Quadrant properties | ||||||
|---|---|---|---|---|---|---|---|
| Quadrant | DetID | PixID | Counts | Sigma | Mean | Median | Sigma |
| A | 15 | 237 | 140780 | 1105.94 | 636 | 627 | 126.7 |
| A | 13 | 6 | 11079 | 82.48 | 636 | 627 | 126.7 |
| A | 13 | 254 | 8934 | 65.55 | 636 | 627 | 126.7 |
| B | 5 | 172 | 784684 | 6730.55 | 621 | 607 | 116.5 |
| B | 0 | 213 | 279308 | 2392.38 | 621 | 607 | 116.5 |
| B | 4 | 170 | 92805 | 791.43 | 621 | 607 | 116.5 |
| C | 0 | 10 | 270007 | 1894.05 | 621 | 630 | 142.2 |
| C | 15 | 214 | 210729 | 1477.25 | 621 | 630 | 142.2 |
| C | 3 | 233 | 73808 | 514.53 | 621 | 630 | 142.2 |
| D | 8 | 195 | 587776 | 3823.58 | 605 | 593 | 153.6 |
| D | 2 | 250 | 446158 | 2901.4 | 605 | 593 | 153.6 |
| D | 13 | 249 | 319764 | 2078.36 | 605 | 593 | 153.6 |
Histogram calculated using DETX and DETY for each event in the final _common_clean file
| Quadrant A |  |
 |
Quadrant B |
|---|---|---|---|
| Quadrant D |  |
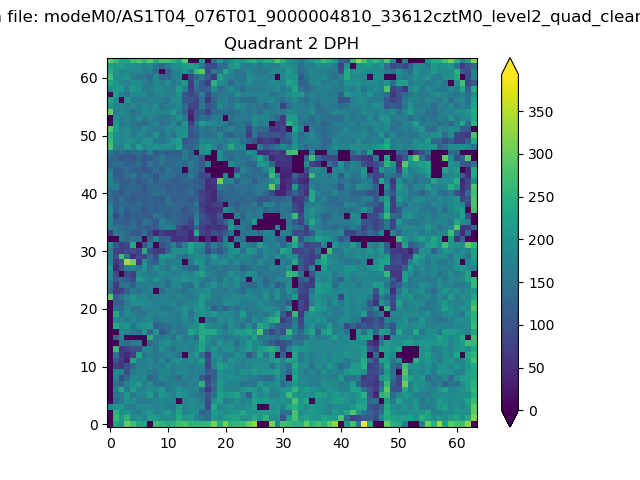 |
Quadrant C |
| Plot type | Count rate plots | Images |
|---|---|---|
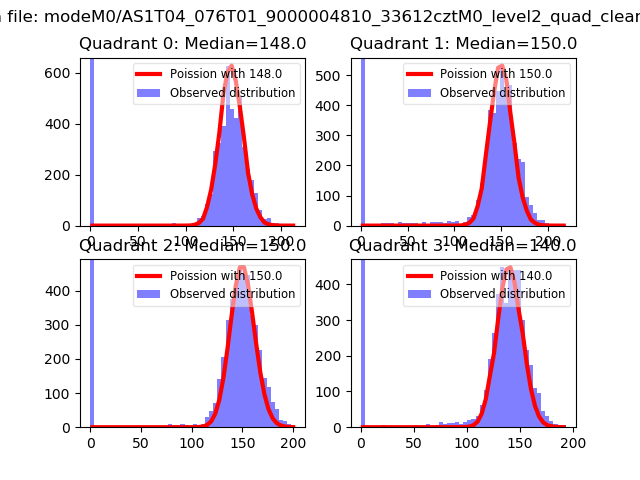
| Comparison with Poisson distribution Blue bars denote a histogram of data divided into 1 sec bins. Red curve is a Poisson curve with rate = median count rate of data. |
 |
 |
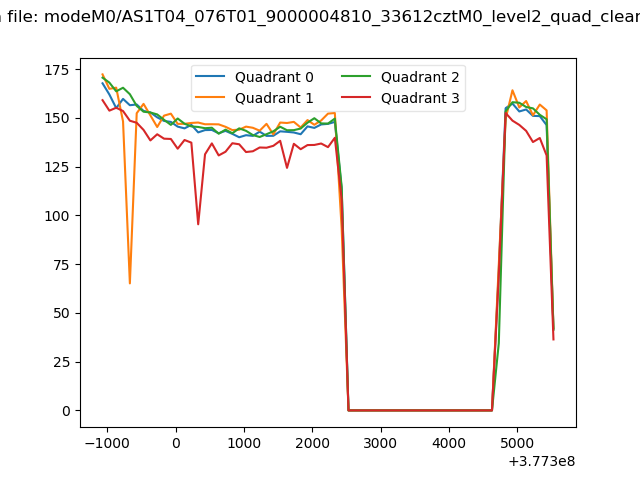
| Quadrant-wise count rates Data is divided into 100 sec bins |
 |
|
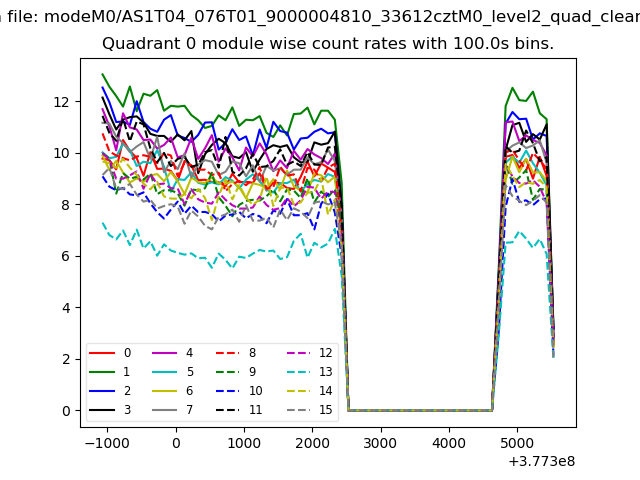
| Module-wise count rates for Quadrant A Data is divided into 100 sec bins |
 |
 |
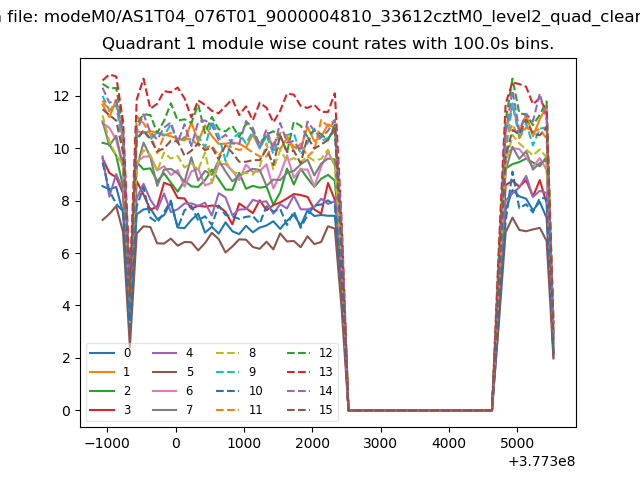
| Module-wise count rates for Quadrant B Data is divided into 100 sec bins |
 |
 |
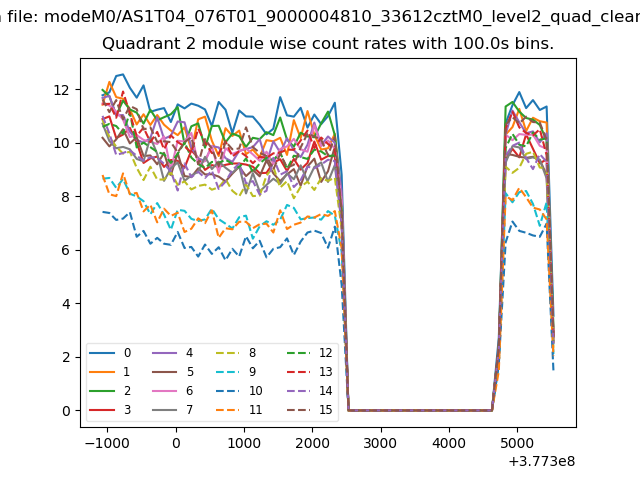
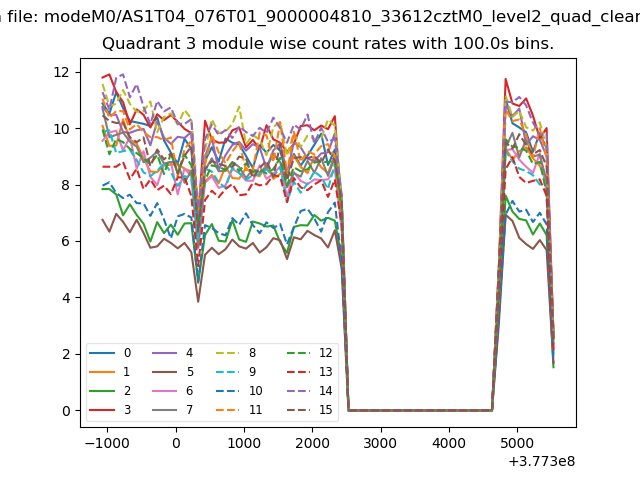
| Module-wise count rates for Quadrant C Data is divided into 100 sec bins |
 |
 |
| Module-wise count rates for Quadrant D Data is divided into 100 sec bins |
 |
 |
| Parameter | Plot |
|---|---|
| CZT HV Monitor | 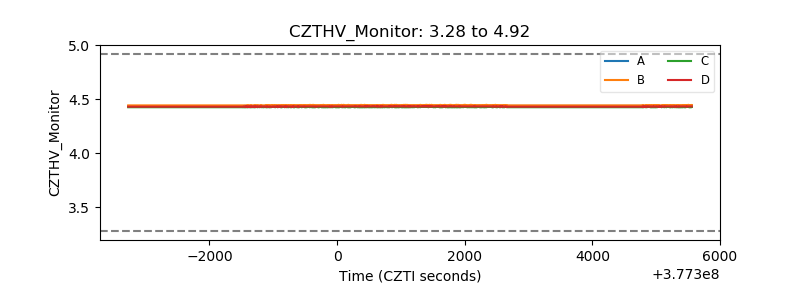 |
| D_VDD |  |
| Temperature 1 |  |
| Veto HV Monitor | 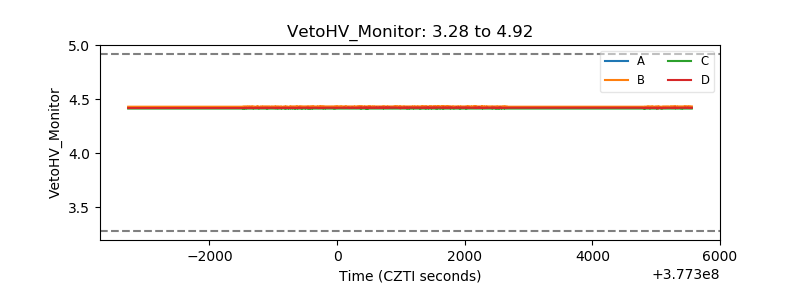 |
| Veto LLD |  |
| Alpha Counter | 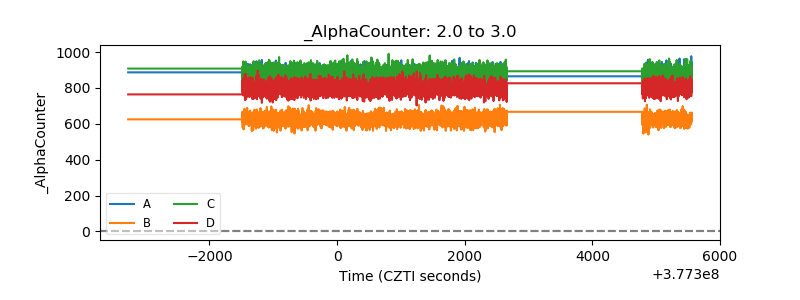 |
| _CPM_Rate | 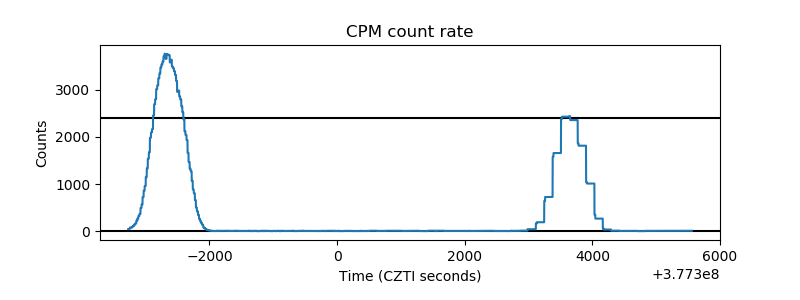 |
| CZT Counter |  |
| +2.5 Volts monitor |  |
| +5 Volts monitor |  |
| _ROLL_ROT | 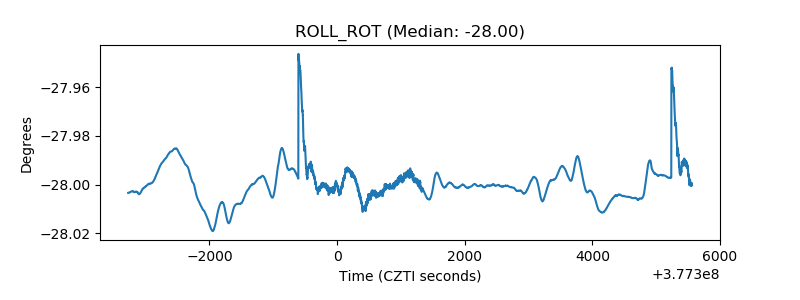 |
| _Roll_DEC | 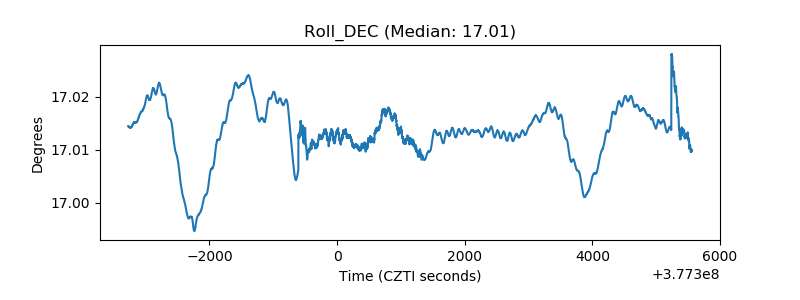 |
| _Roll_RA | 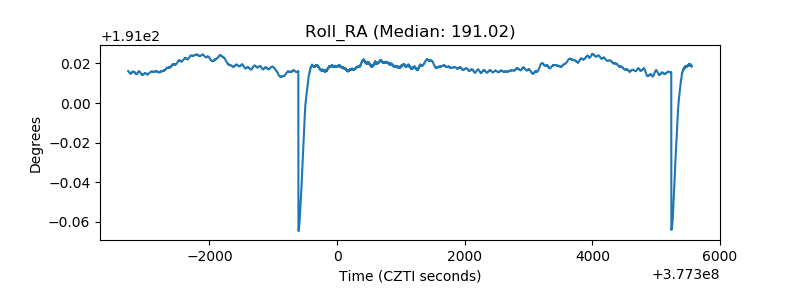 |
| Veto Counter | 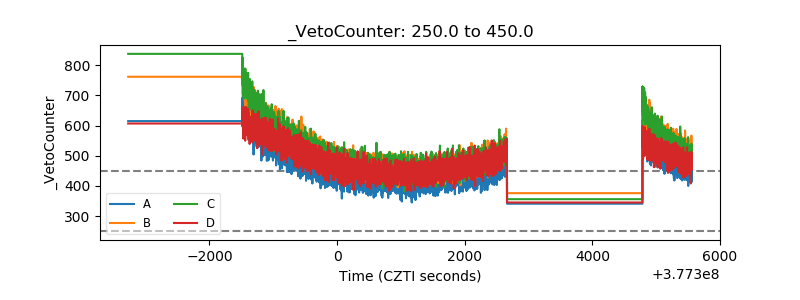 |