| Param | Original file | Final file |
|---|---|---|
| Filename | modeM0/AS1T04_076T01_9000004810_33613cztM0_level2.evt | modeM0/AS1T04_076T01_9000004810_33613cztM0_level2_quad_clean.evt |
| Size (bytes) | 490,896,000 | 90,924,480 |
| Size | 468.2 MB | 86.7 MB |
| Events in quadrant A | 2,510,570 | 620,028 |
| Events in quadrant B | 3,800,590 | 620,327 |
| Events in quadrant C | 3,068,803 | 617,493 |
| Events in quadrant D | 5,145,966 | 543,089 |
| Mode SS | |||
|---|---|---|---|
| Quadrant | BADHDUFLAG | Total packets | Discarded packets |
| A | 0 | 102 | 0 |
| B | 0 | 102 | 0 |
| C | 0 | 102 | 0 |
| D | 0 | 102 | 0 |
| Mode M9 | |||
|---|---|---|---|
| Quadrant | BADHDUFLAG | Total packets | Discarded packets |
| A | 0 | 28 | 0 |
| B | 0 | 28 | 0 |
| C | 0 | 28 | 0 |
| D | 0 | 29 | 0 |
| Mode M0 | |||
|---|---|---|---|
| Quadrant | BADHDUFLAG | Total packets | Discarded packets |
| A | 0 | 10598 | 3 |
| B | 0 | 14571 | 2 |
| C | 0 | 12105 | 2 |
| D | 0 | 18882 | 2 |
| Quadrant | Total seconds | Saturated seconds | Saturation percentage |
|---|---|---|---|
| A | 5029 | 26 | 0.517001% |
| B | 5029 | 326 | 6.482402% |
| C | 5029 | 111 | 2.207198% |
| D | 5029 | 709 | 14.098230% |
Noise dominated data is calculated using 1-second bins in cleaned event files. If a bin has >2000 counts, and if more than 50% of those come from <1% of pixels, then it is considered to be noise-dominated and hence unusable.
| Quadrant | # 1 sec bins | Bins with >0 counts | Bins with >2000 counts | High rate bins dominated by noise | Noise dominated (total time) | Noise dominated (detector-on time) | Marked lightcurve |
|---|---|---|---|---|---|---|---|
| A | 7122 | 5030 | 17 | 17 | 0.24% | 0.34% | 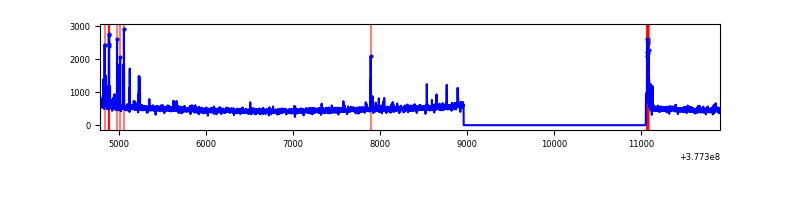 |
| B | 7122 | 5030 | 253 | 253 | 3.55% | 5.03% | 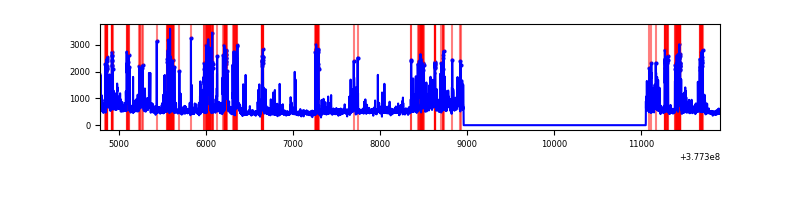 |
| C | 7122 | 5030 | 83 | 83 | 1.17% | 1.65% | 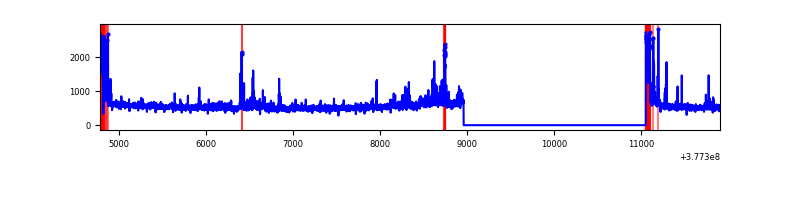 |
| D | 7122 | 5030 | 687 | 687 | 9.65% | 13.66% | 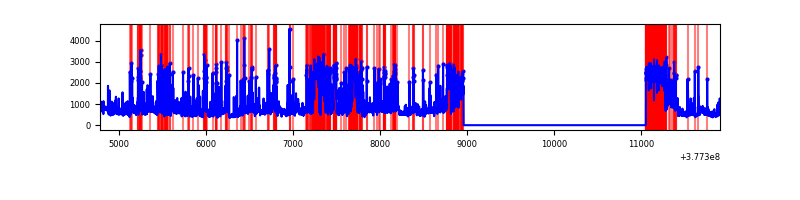 |
Top three noisy pixels from each quadrant. If the there are fewer than three noisy pixels in the level2.evt file, extra rows are filled as -1
| Pixel properties | Quadrant properties | ||||||
|---|---|---|---|---|---|---|---|
| Quadrant | DetID | PixID | Counts | Sigma | Mean | Median | Sigma |
| A | 15 | 237 | 58178 | 460.92 | 618 | 609 | 124.9 |
| A | 15 | 169 | 51761 | 409.54 | 618 | 609 | 124.9 |
| A | 13 | 254 | 9005 | 67.22 | 618 | 609 | 124.9 |
| B | 5 | 172 | 927564 | 8002.53 | 610 | 596 | 115.8 |
| B | 0 | 213 | 228810 | 1970.18 | 610 | 596 | 115.8 |
| B | 4 | 170 | 111872 | 960.65 | 610 | 596 | 115.8 |
| C | 0 | 10 | 334585 | 2409.04 | 601 | 608 | 138.6 |
| C | 15 | 214 | 215416 | 1549.45 | 601 | 608 | 138.6 |
| C | 3 | 233 | 133308 | 957.19 | 601 | 608 | 138.6 |
| D | 12 | 6 | 1190920 | 8078.16 | 555 | 546 | 147.4 |
| D | 2 | 250 | 557285 | 3778.16 | 555 | 546 | 147.4 |
| D | 8 | 195 | 510085 | 3457.85 | 555 | 546 | 147.4 |
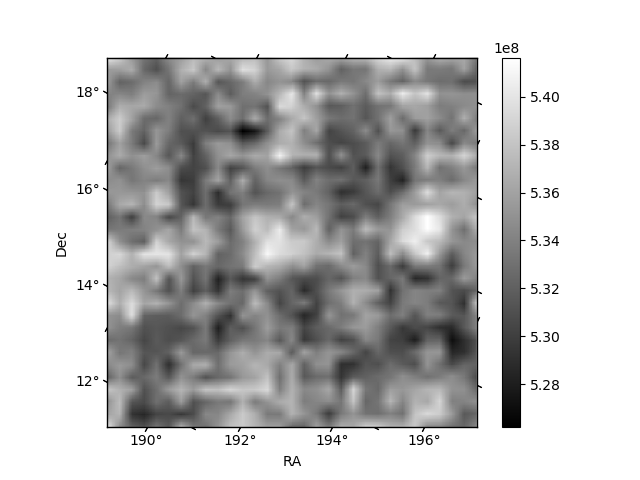
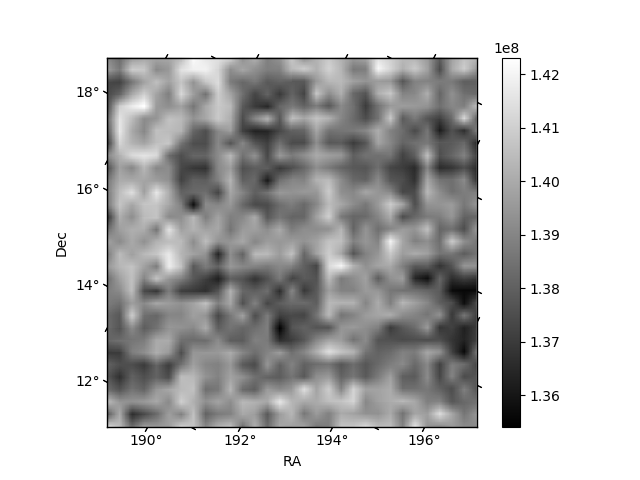
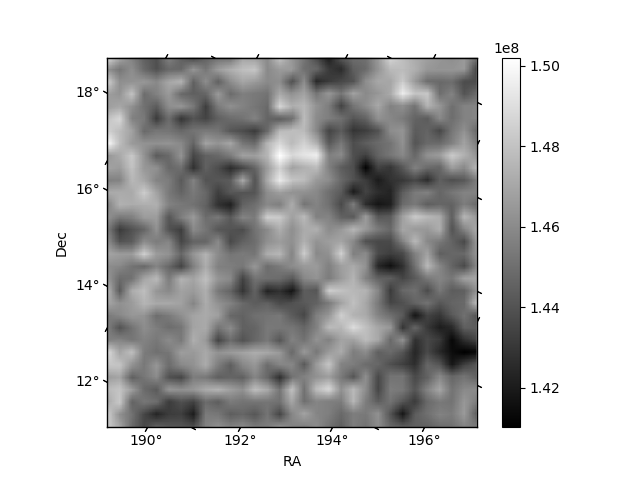
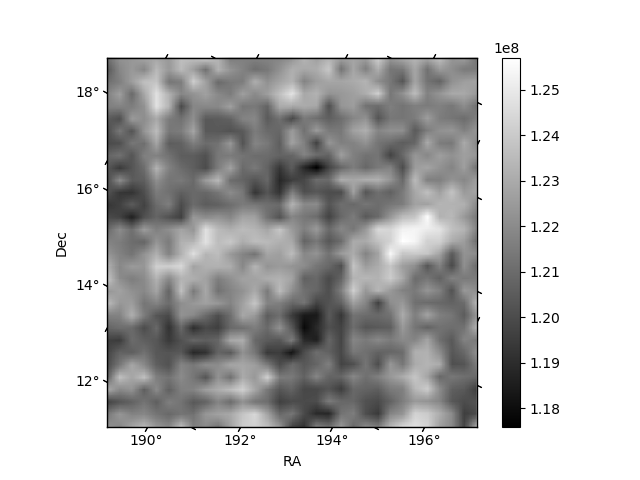
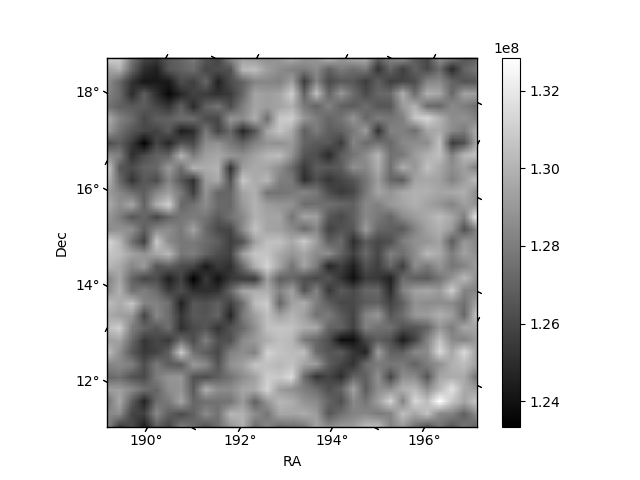
Histogram calculated using DETX and DETY for each event in the final _common_clean file
| Quadrant A | 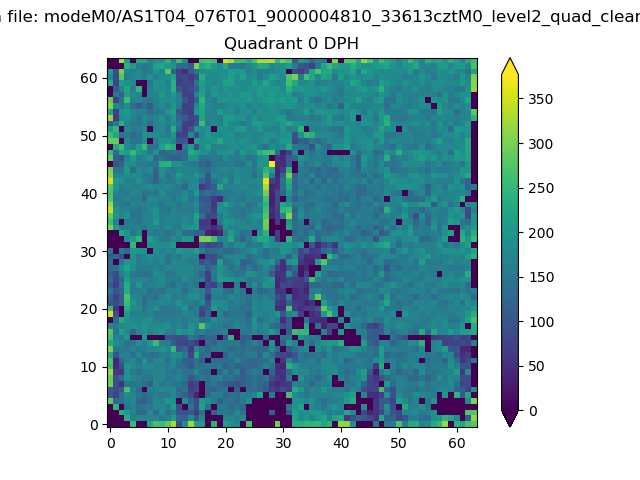 |
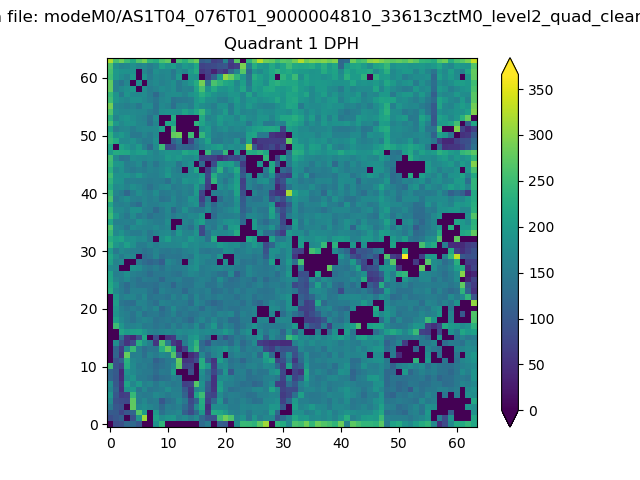 |
Quadrant B |
|---|---|---|---|
| Quadrant D | 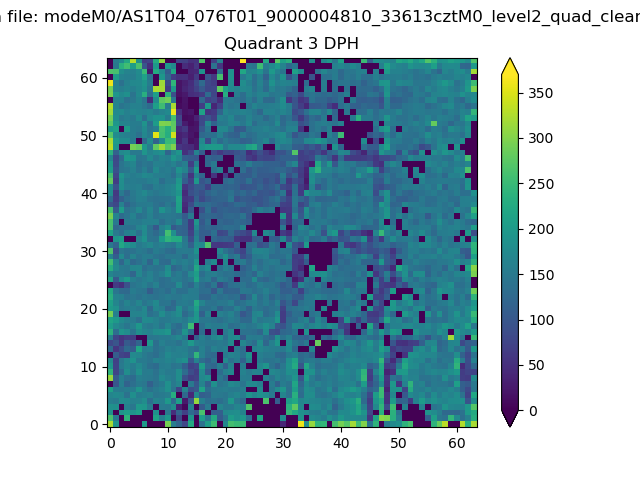 |
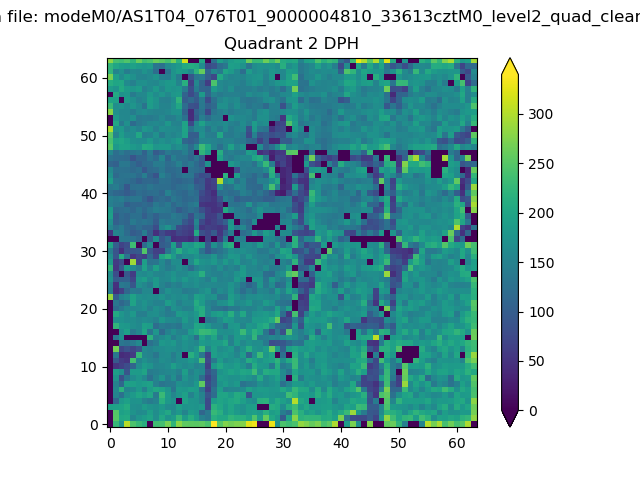 |
Quadrant C |
| Plot type | Count rate plots | Images |
|---|---|---|
| Comparison with Poisson distribution Blue bars denote a histogram of data divided into 1 sec bins. Red curve is a Poisson curve with rate = median count rate of data. |
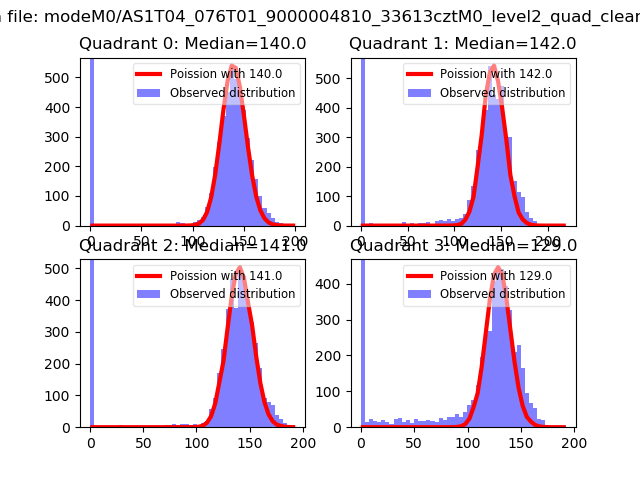 |
 |
| Quadrant-wise count rates Data is divided into 100 sec bins |
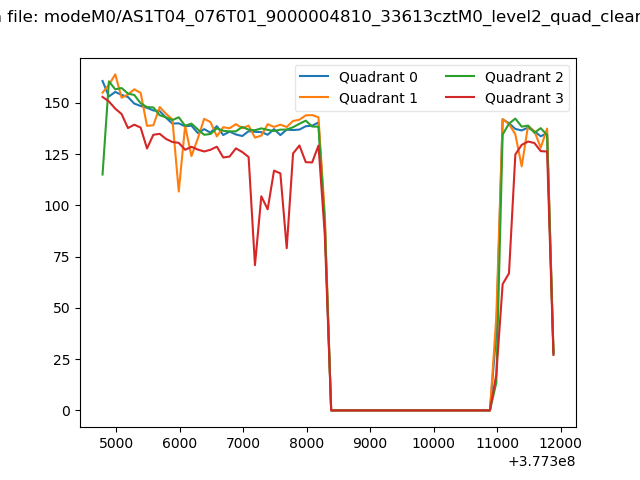 |
|
| Module-wise count rates for Quadrant A Data is divided into 100 sec bins |
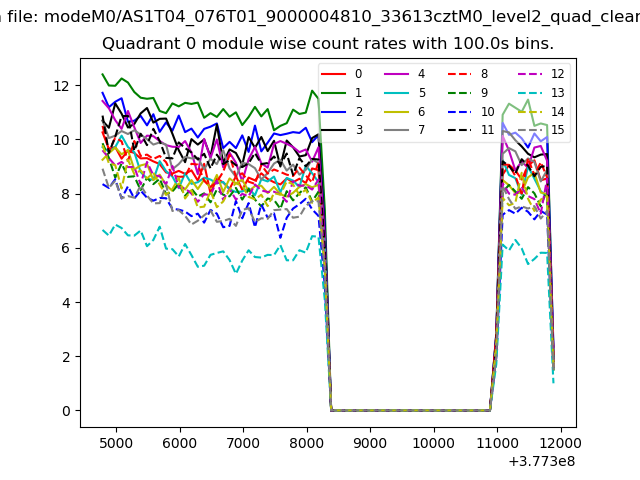 |
 |
| Module-wise count rates for Quadrant B Data is divided into 100 sec bins |
 |
 |
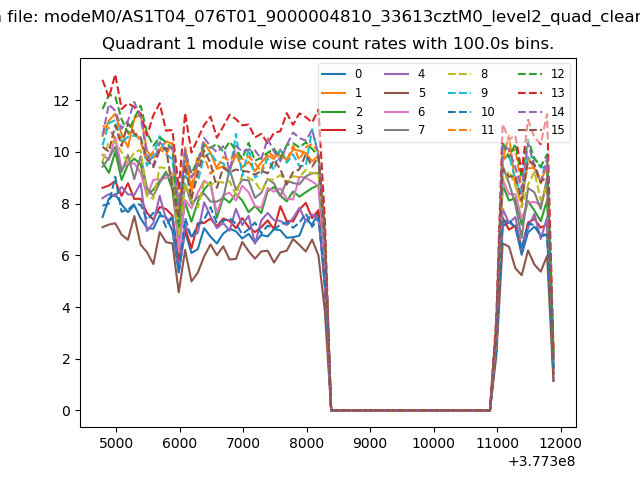
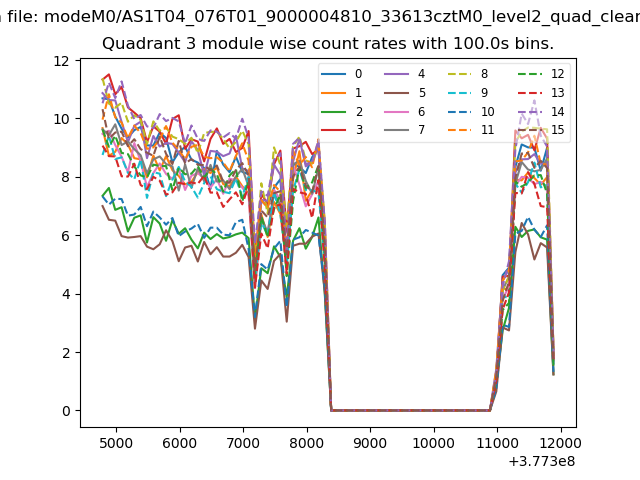
| Module-wise count rates for Quadrant C Data is divided into 100 sec bins |
 |
 |
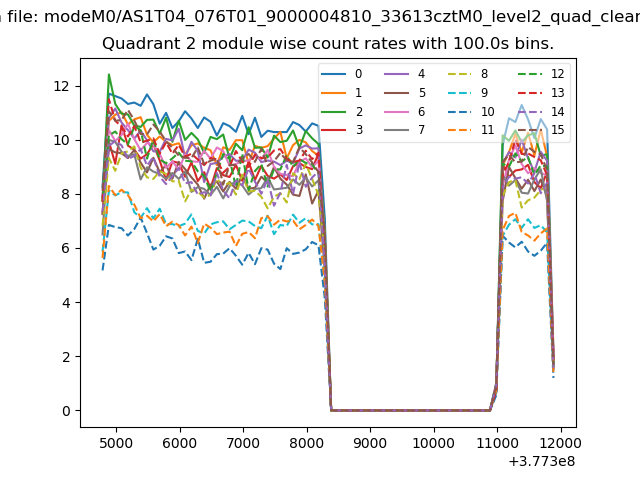
| Module-wise count rates for Quadrant D Data is divided into 100 sec bins |
 |
 |
| Parameter | Plot |
|---|---|
| CZT HV Monitor | 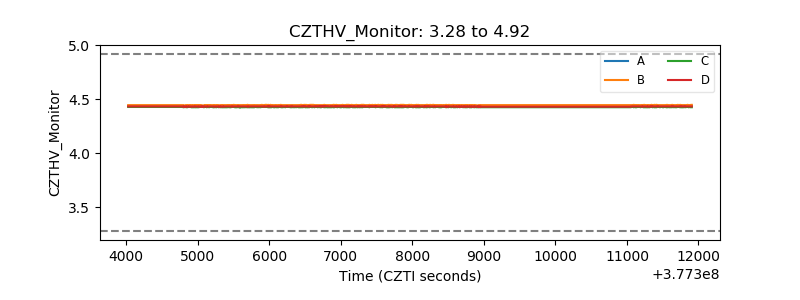 |
| D_VDD | 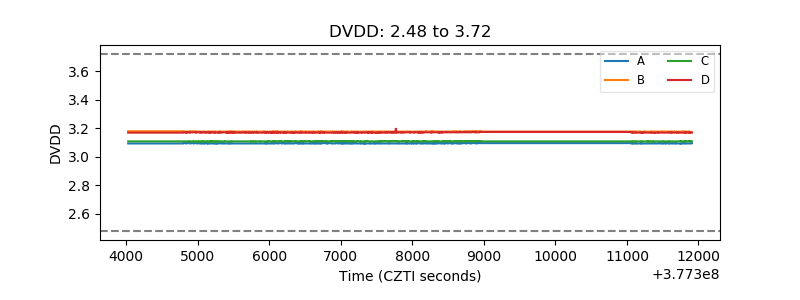 |
| Temperature 1 | 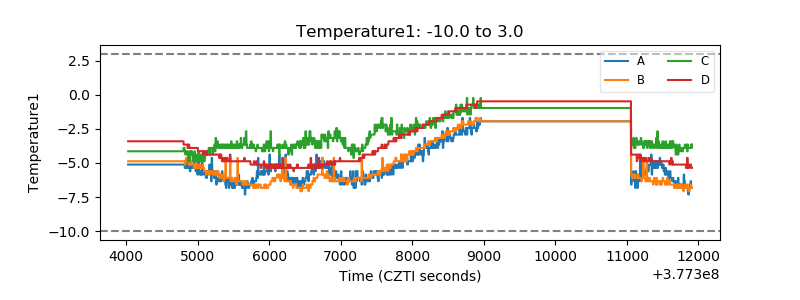 |
| Veto HV Monitor | 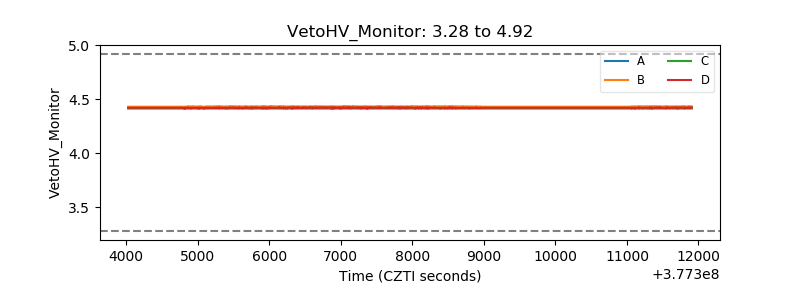 |
| Veto LLD | 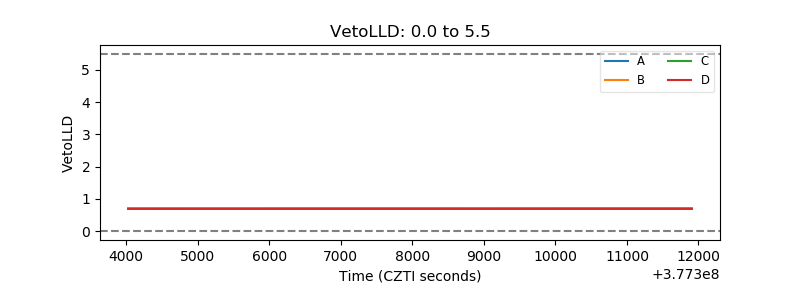 |
| Alpha Counter | 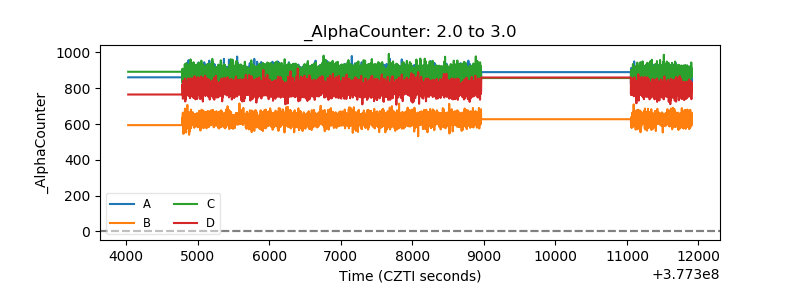 |
| _CPM_Rate | 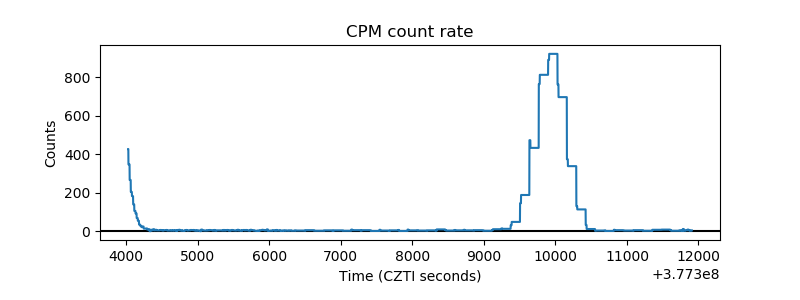 |
| CZT Counter | 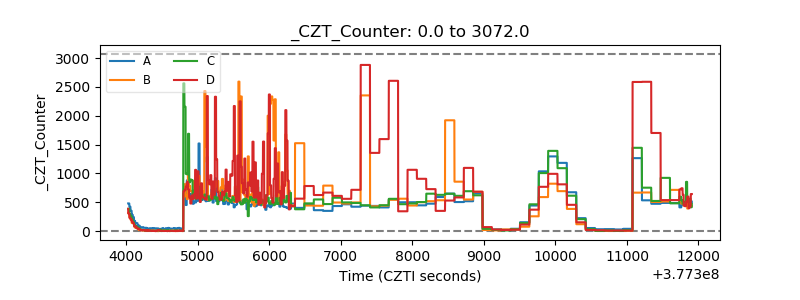 |
| +2.5 Volts monitor |  |
| +5 Volts monitor |  |
| _ROLL_ROT | 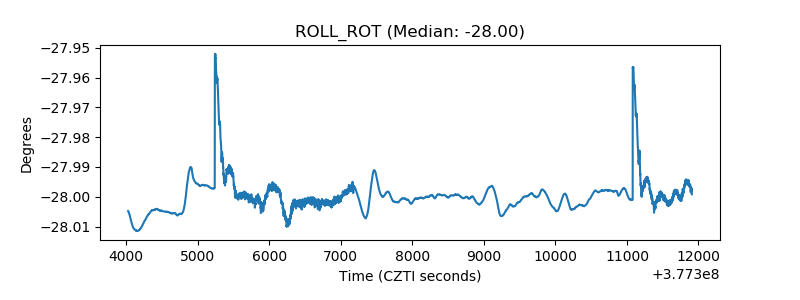 |
| _Roll_DEC | 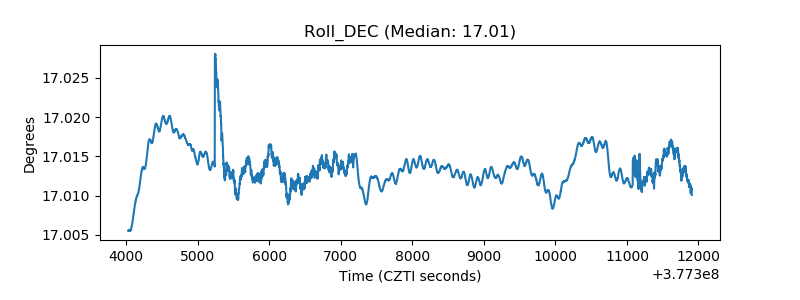 |
| _Roll_RA | 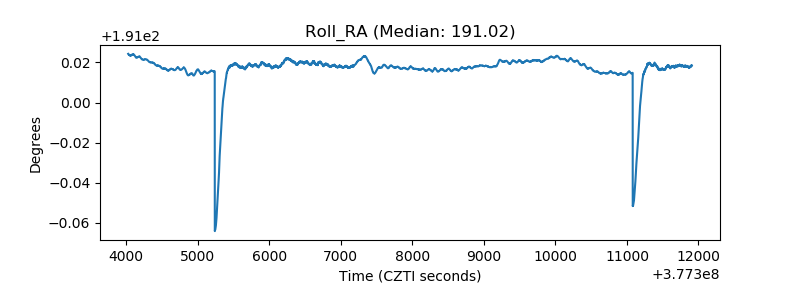 |
| Veto Counter | 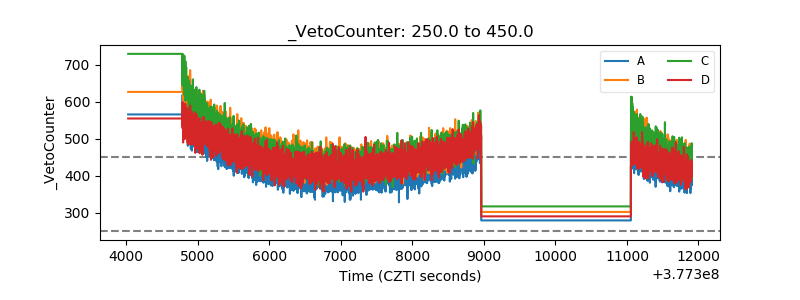 |