| Param | Original file | Final file |
|---|---|---|
| Filename | modeM0/AS1T04_076T01_9000004810_33615cztM0_level2.evt | modeM0/AS1T04_076T01_9000004810_33615cztM0_level2_quad_clean.evt |
| Size (bytes) | 546,831,360 | 74,010,240 |
| Size | 521.5 MB | 70.6 MB |
| Events in quadrant A | 2,632,315 | 472,196 |
| Events in quadrant B | 4,236,566 | 464,366 |
| Events in quadrant C | 3,117,793 | 469,597 |
| Events in quadrant D | 6,185,638 | 433,968 |
| Mode SS | |||
|---|---|---|---|
| Quadrant | BADHDUFLAG | Total packets | Discarded packets |
| A | 0 | 116 | 0 |
| B | 0 | 116 | 0 |
| C | 0 | 116 | 0 |
| D | 0 | 116 | 0 |
| Mode M9 | |||
|---|---|---|---|
| Quadrant | BADHDUFLAG | Total packets | Discarded packets |
| A | 0 | 28 | 0 |
| B | 0 | 28 | 0 |
| C | 0 | 28 | 0 |
| D | 0 | 29 | 0 |
| Mode M0 | |||
|---|---|---|---|
| Quadrant | BADHDUFLAG | Total packets | Discarded packets |
| A | 0 | 11665 | 2 |
| B | 0 | 16366 | 1 |
| C | 0 | 12804 | 1 |
| D | 0 | 22315 | 1 |
| Quadrant | Total seconds | Saturated seconds | Saturation percentage |
|---|---|---|---|
| A | 5735 | 12 | 0.209241% |
| B | 5735 | 486 | 8.474281% |
| C | 5735 | 70 | 1.220575% |
| D | 5735 | 871 | 15.187446% |
Noise dominated data is calculated using 1-second bins in cleaned event files. If a bin has >2000 counts, and if more than 50% of those come from <1% of pixels, then it is considered to be noise-dominated and hence unusable.
| Quadrant | # 1 sec bins | Bins with >0 counts | Bins with >2000 counts | High rate bins dominated by noise | Noise dominated (total time) | Noise dominated (detector-on time) | Marked lightcurve |
|---|---|---|---|---|---|---|---|
| A | 7349 | 5736 | 4 | 4 | 0.05% | 0.07% | 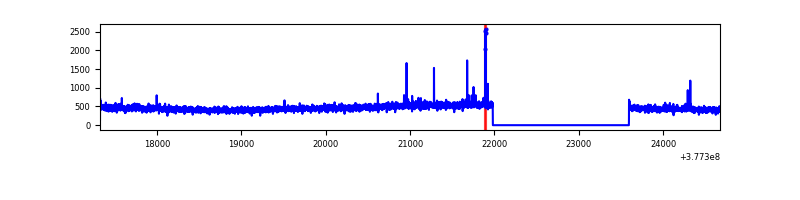 |
| B | 7349 | 5736 | 392 | 392 | 5.33% | 6.83% | 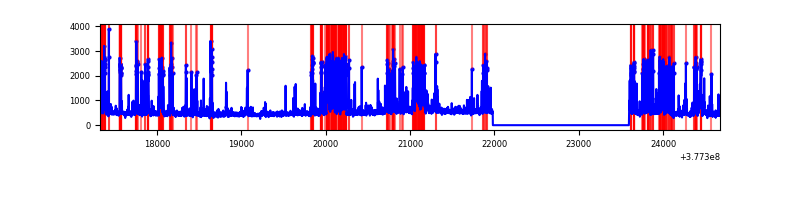 |
| C | 7349 | 5736 | 60 | 60 | 0.82% | 1.05% | 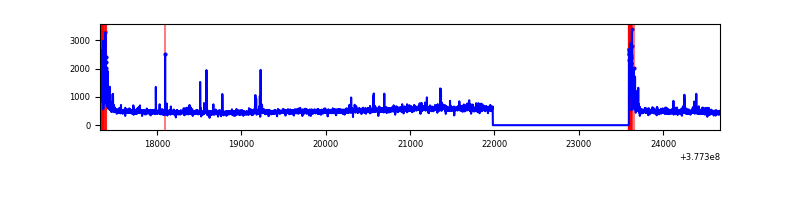 |
| D | 7349 | 5736 | 882 | 882 | 12.00% | 15.38% | 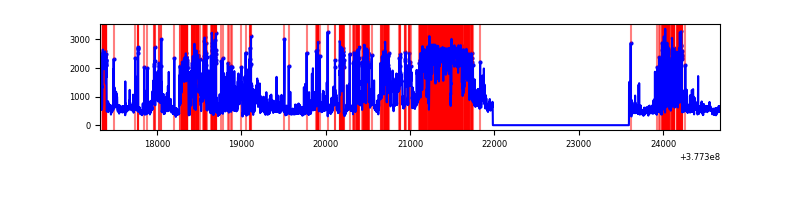 |
Top three noisy pixels from each quadrant. If the there are fewer than three noisy pixels in the level2.evt file, extra rows are filled as -1
| Pixel properties | Quadrant properties | ||||||
|---|---|---|---|---|---|---|---|
| Quadrant | DetID | PixID | Counts | Sigma | Mean | Median | Sigma |
| A | 15 | 237 | 30433 | 221.47 | 667 | 654 | 134.5 |
| A | 13 | 6 | 15975 | 113.94 | 667 | 654 | 134.5 |
| A | 13 | 254 | 8022 | 54.8 | 667 | 654 | 134.5 |
| B | 5 | 172 | 1329527 | 10711.34 | 647 | 632 | 124.1 |
| B | 5 | 255 | 98830 | 791.51 | 647 | 632 | 124.1 |
| B | 15 | 85 | 50634 | 403.03 | 647 | 632 | 124.1 |
| C | 15 | 214 | 246410 | 1642.28 | 648 | 654 | 149.6 |
| C | 0 | 10 | 244886 | 1632.1 | 648 | 654 | 149.6 |
| C | 3 | 233 | 65886 | 435.92 | 648 | 654 | 149.6 |
| D | 1 | 20 | 1429214 | 8746.82 | 601 | 591 | 163.3 |
| D | 1 | 52 | 935653 | 5724.97 | 601 | 591 | 163.3 |
| D | 13 | 249 | 462542 | 2828.32 | 601 | 591 | 163.3 |
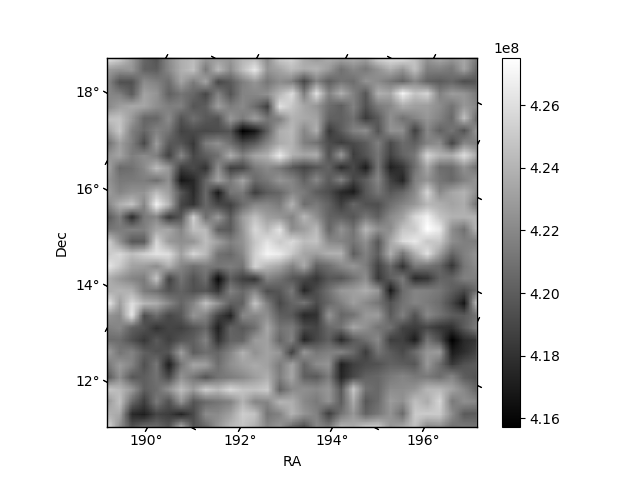
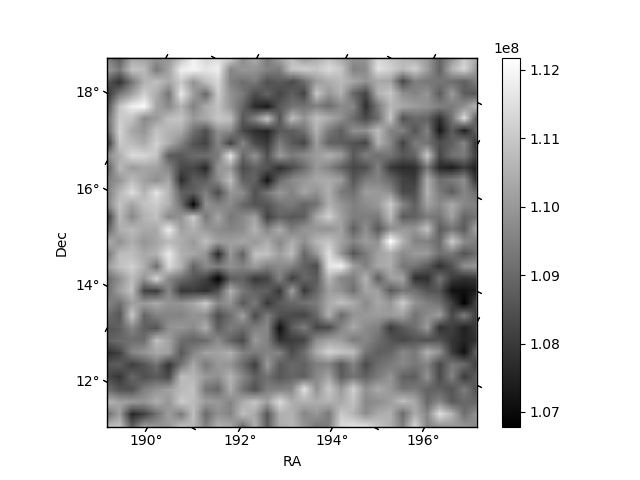
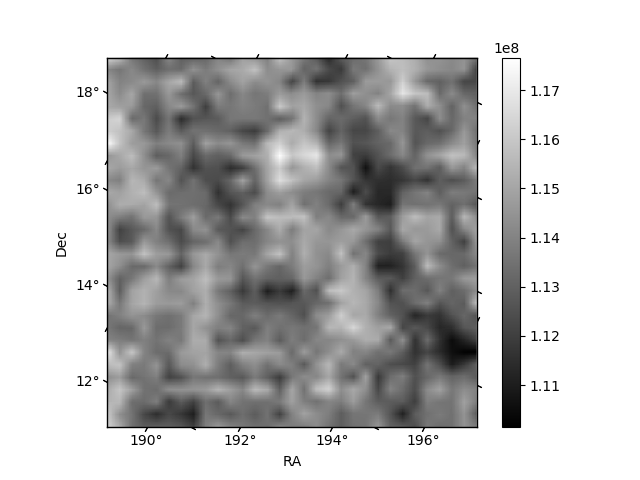
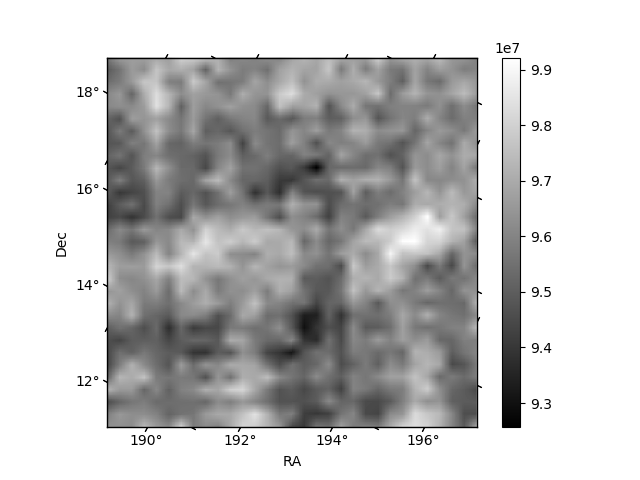
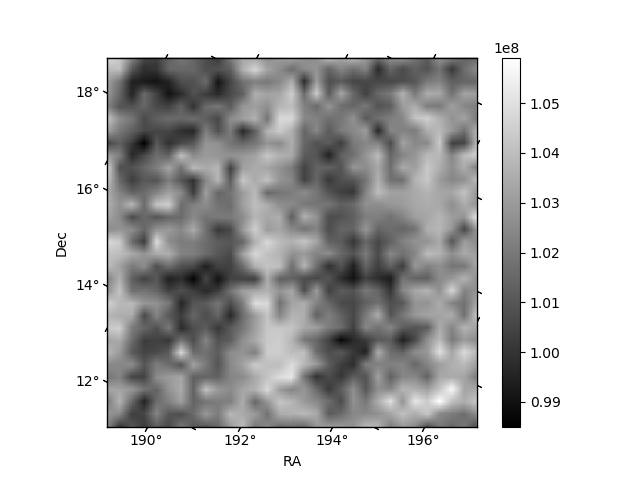
Histogram calculated using DETX and DETY for each event in the final _common_clean file
| Quadrant A | 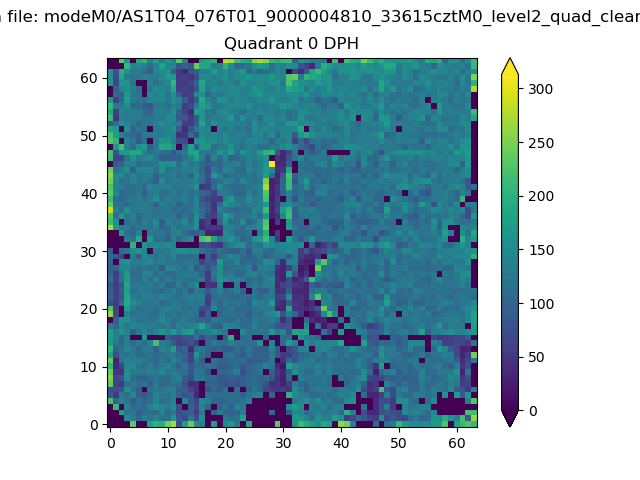 |
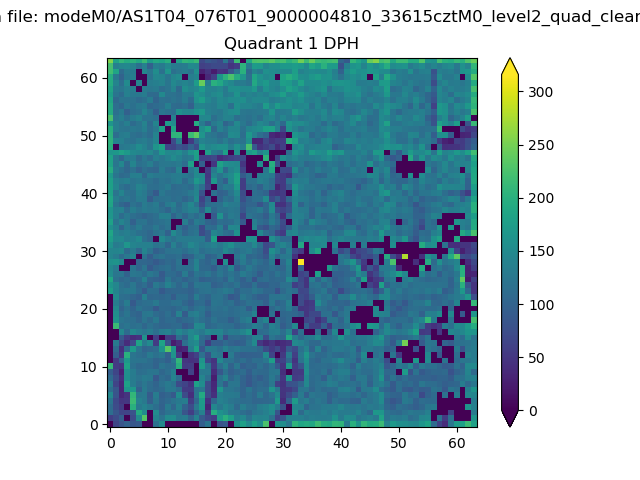 |
Quadrant B |
|---|---|---|---|
| Quadrant D | 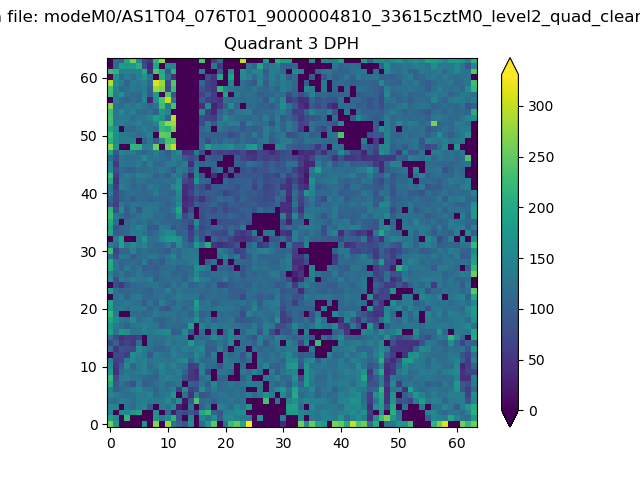 |
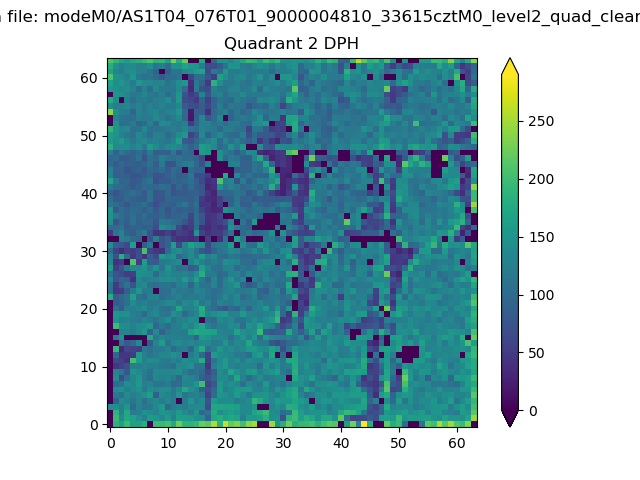 |
Quadrant C |
| Plot type | Count rate plots | Images |
|---|---|---|
| Comparison with Poisson distribution Blue bars denote a histogram of data divided into 1 sec bins. Red curve is a Poisson curve with rate = median count rate of data. |
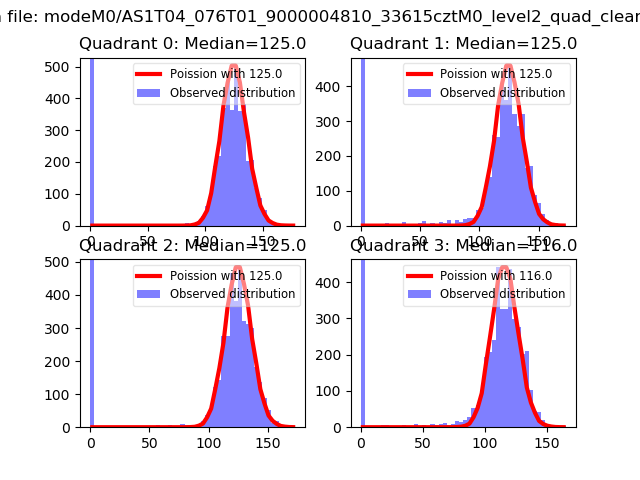 |
 |
| Quadrant-wise count rates Data is divided into 100 sec bins |
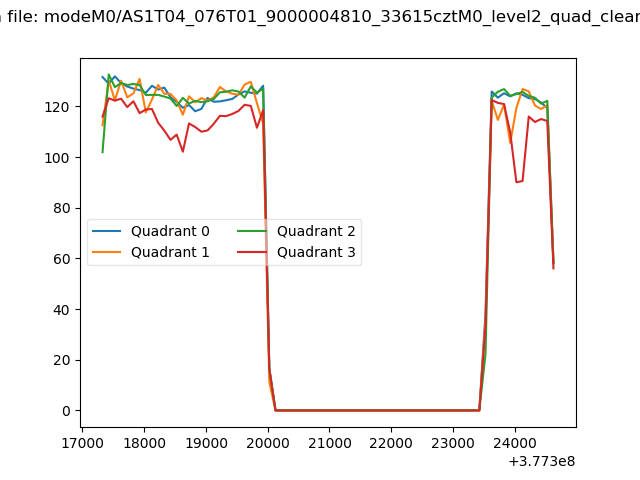 |
|
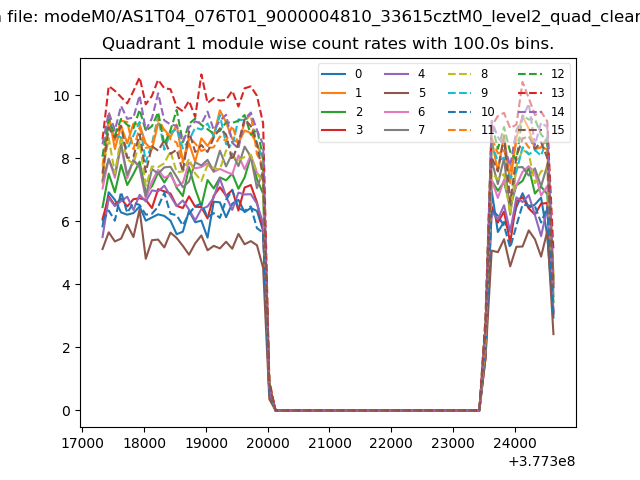
| Module-wise count rates for Quadrant A Data is divided into 100 sec bins |
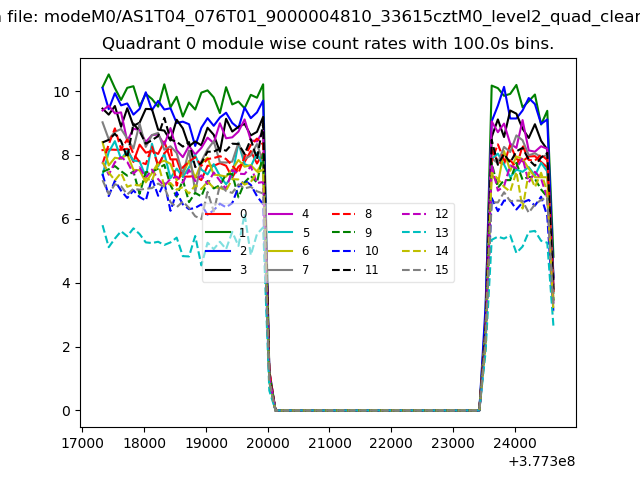 |
 |
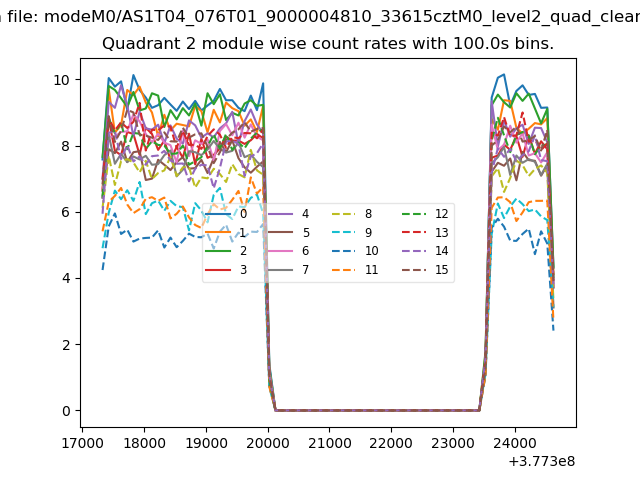
| Module-wise count rates for Quadrant B Data is divided into 100 sec bins |
 |
 |
| Module-wise count rates for Quadrant C Data is divided into 100 sec bins |
 |
 |
| Module-wise count rates for Quadrant D Data is divided into 100 sec bins |
 |
 |
| Parameter | Plot |
|---|---|
| CZT HV Monitor | 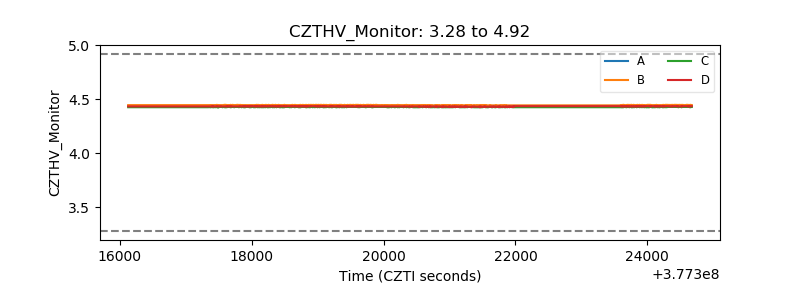 |
| D_VDD | 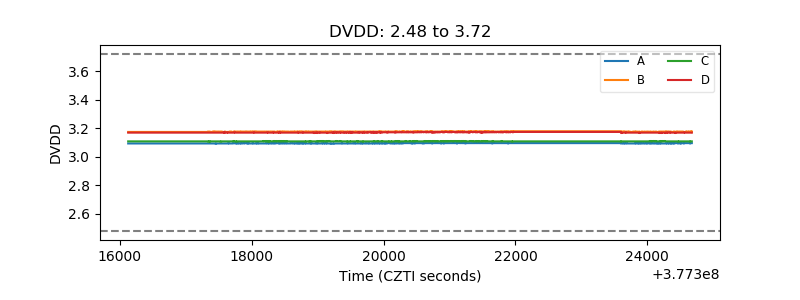 |
| Temperature 1 | 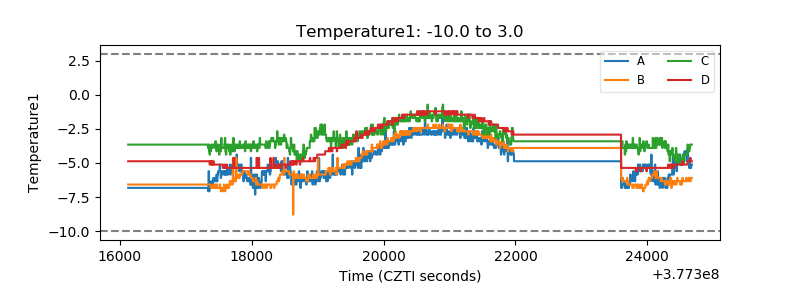 |
| Veto HV Monitor | 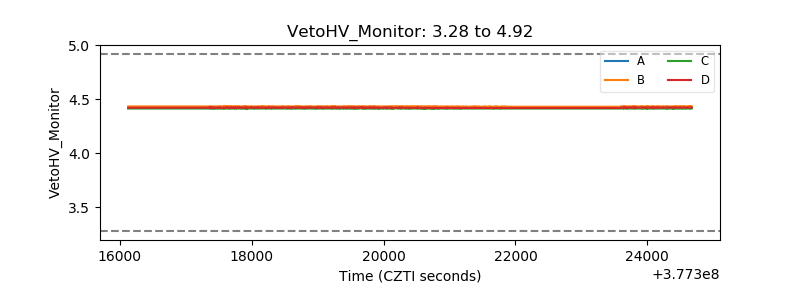 |
| Veto LLD | 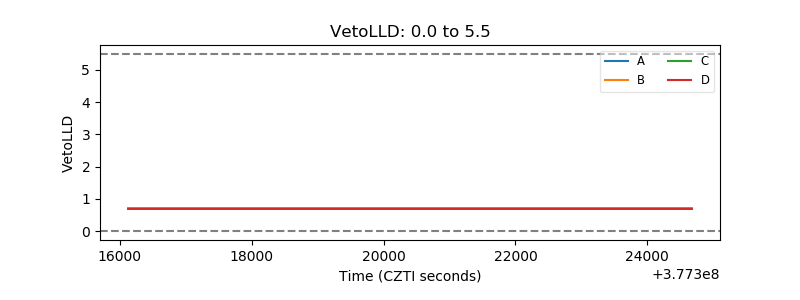 |
| Alpha Counter | 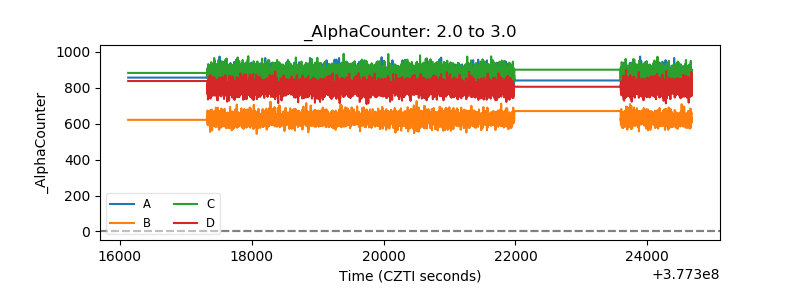 |
| _CPM_Rate | 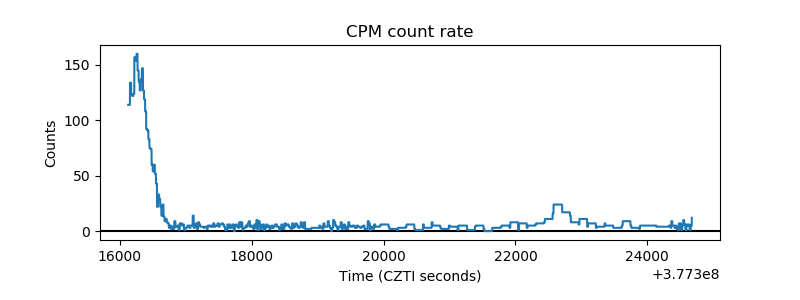 |
| CZT Counter | 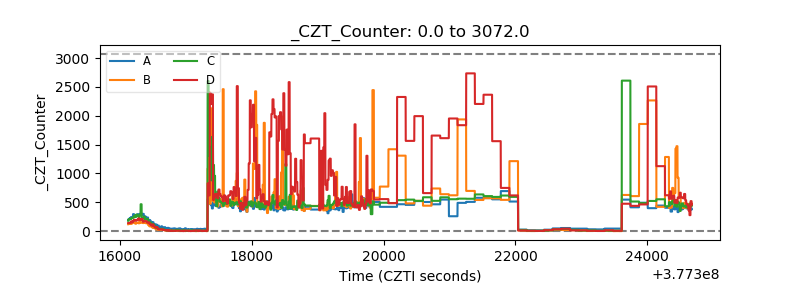 |
| +2.5 Volts monitor |  |
| +5 Volts monitor |  |
| _ROLL_ROT | 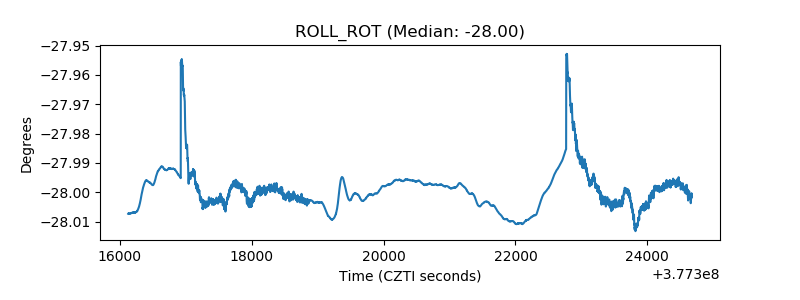 |
| _Roll_DEC | 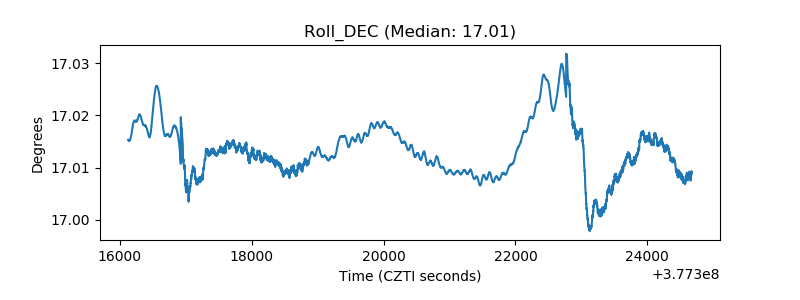 |
| _Roll_RA | 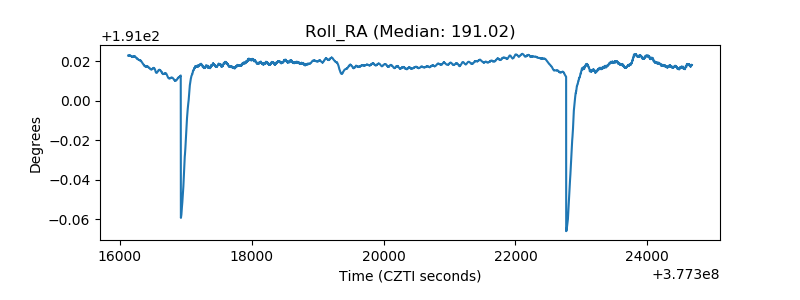 |
| Veto Counter | 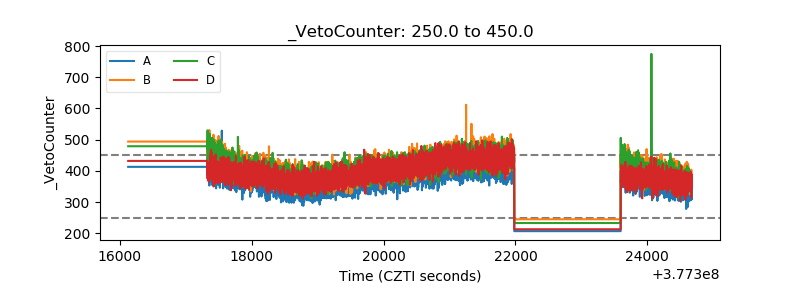 |