| Param | Original file | Final file |
|---|---|---|
| Filename | modeM0/AS1T04_076T01_9000004810cztM0_level2.fits | modeM0/AS1T04_076T01_9000004810cztM0_level2_quad_clean.evt |
| Size (bytes) | 2,137,893,120 | 1,913,751,360 |
| Size | 2.0 GB | 1.8 GB |
| Events in quadrant A | 10,936,150 | 9,068,502 |
| Events in quadrant B | 12,818,814 | 11,337,851 |
| Events in quadrant C | 13,658,830 | 11,530,617 |
| Events in quadrant D | 11,610,846 | 10,333,587 |
| Mode SS | |||
|---|---|---|---|
| Quadrant | BADHDUFLAG | Total packets | Discarded packets |
| A | 0 | 4668 | 0 |
| B | 0 | 4668 | 0 |
| C | 0 | 4668 | 0 |
| D | 0 | 4668 | 0 |
| Mode M9 | |||
|---|---|---|---|
| Quadrant | BADHDUFLAG | Total packets | Discarded packets |
| A | 0 | 851 | 0 |
| B | 0 | 851 | 0 |
| C | 0 | 851 | 0 |
| D | 0 | 851 | 0 |
| Mode M0 | |||
|---|---|---|---|
| Quadrant | BADHDUFLAG | Total packets | Discarded packets |
| A | 0 | 817809 | 0 |
| B | 0 | 645945 | 0 |
| C | 0 | 589057 | 0 |
| D | 0 | 689624 | 0 |
| Quadrant | Total seconds | Saturated seconds | Saturation percentage |
|---|---|---|---|
| A | 229017 | 60871 | 26.579250% |
| B | 229017 | 17785 | 7.765799% |
| C | 229017 | 3849 | 1.680661% |
| D | 229017 | 7521 | 3.284036% |
Noise dominated data is calculated using 1-second bins in cleaned event files. If a bin has >2000 counts, and if more than 50% of those come from <1% of pixels, then it is considered to be noise-dominated and hence unusable.
| Quadrant | # 1 sec bins | Bins with >0 counts | Bins with >2000 counts | High rate bins dominated by noise | Noise dominated (total time) | Noise dominated (detector-on time) | Marked lightcurve |
|---|---|---|---|---|---|---|---|
| A | 313491 | 203274 | 0 | 0 | 0.00% | 0.00% | 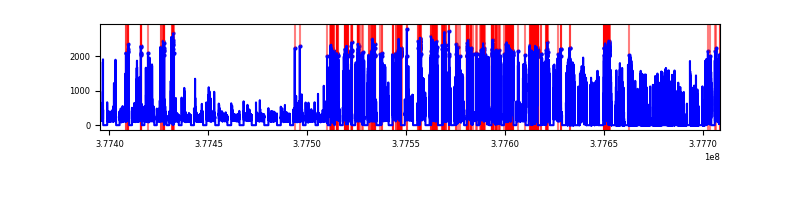 |
| B | 313492 | 228739 | 0 | 0 | 0.00% | 0.00% | 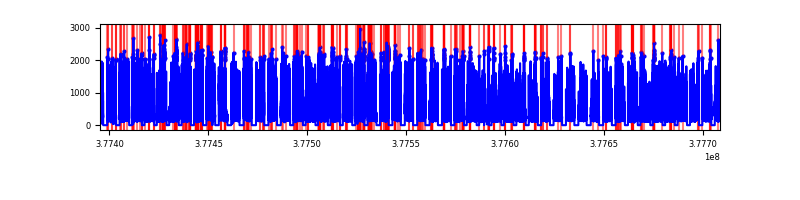 |
| C | 313491 | 228974 | 0 | 0 | 0.00% | 0.00% |  |
| D | 313491 | 228790 | 0 | 0 | 0.00% | 0.00% | 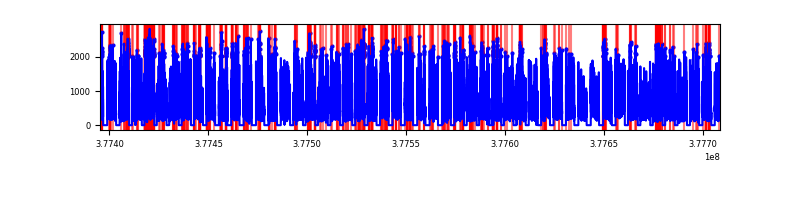 |
Top three noisy pixels from each quadrant. If the there are fewer than three noisy pixels in the level2.evt file, extra rows are filled as -1
| Pixel properties | Quadrant properties | ||||||
|---|---|---|---|---|---|---|---|
| Quadrant | DetID | PixID | Counts | Sigma | Mean | Median | Sigma |
| A | 9 | 19 | 9000 | 9.14 | 2853 | 2684 | 690.9 |
| A | 7 | 110 | 8769 | 8.81 | 2853 | 2684 | 690.9 |
| A | 0 | 29 | 8733 | 8.75 | 2853 | 2684 | 690.9 |
| B | 2 | 9 | 11016 | 11.65 | 3403 | 3249 | 666.5 |
| B | 3 | 80 | 9959 | 10.07 | 3403 | 3249 | 666.5 |
| B | 2 | 8 | 8928 | 8.52 | 3403 | 3249 | 666.5 |
| C | 1 | 81 | 11182 | 8.61 | 3611 | 3405 | 903.2 |
| C | 1 | 80 | 10972 | 8.38 | 3611 | 3405 | 903.2 |
| C | 3 | 202 | 10405 | 7.75 | 3611 | 3405 | 903.2 |
| D | 7 | 3 | 8494 | 6.16 | 3340 | 3051 | 882.9 |
| D | 4 | 160 | 8463 | 6.13 | 3340 | 3051 | 882.9 |
| D | 10 | 113 | 8345 | 6.0 | 3340 | 3051 | 882.9 |
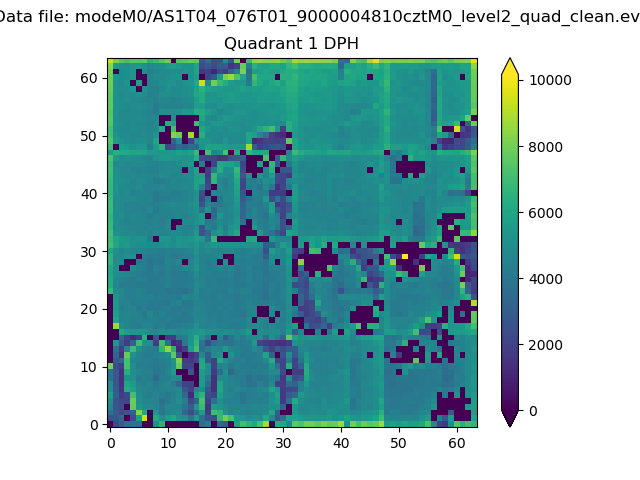
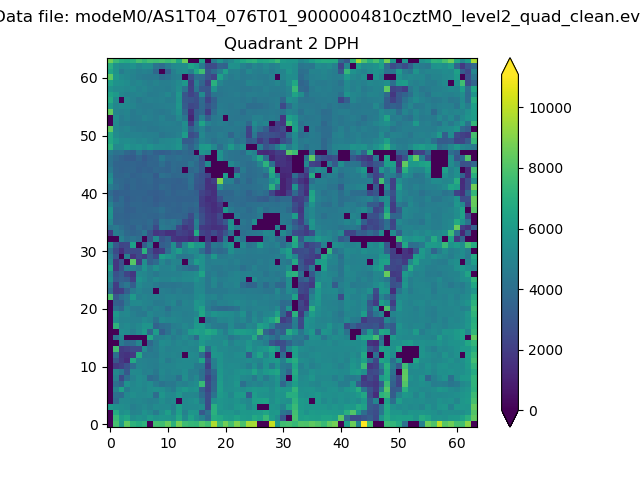
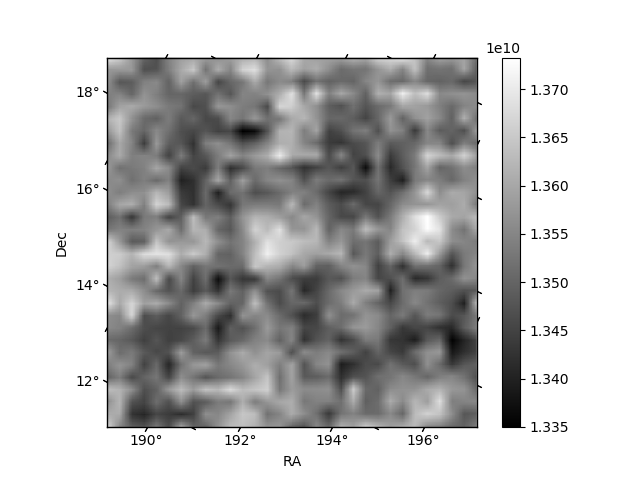
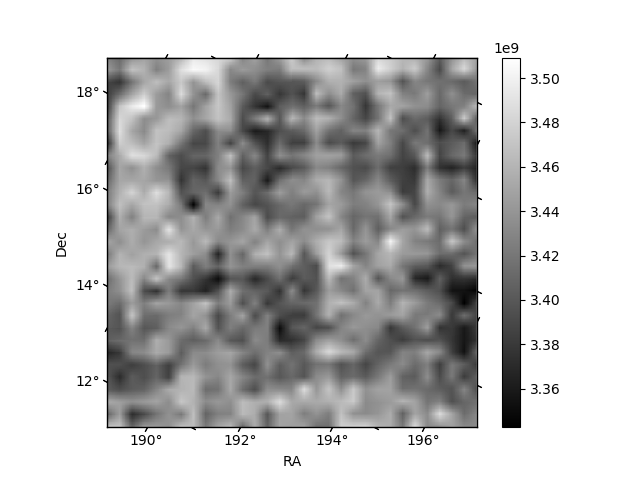
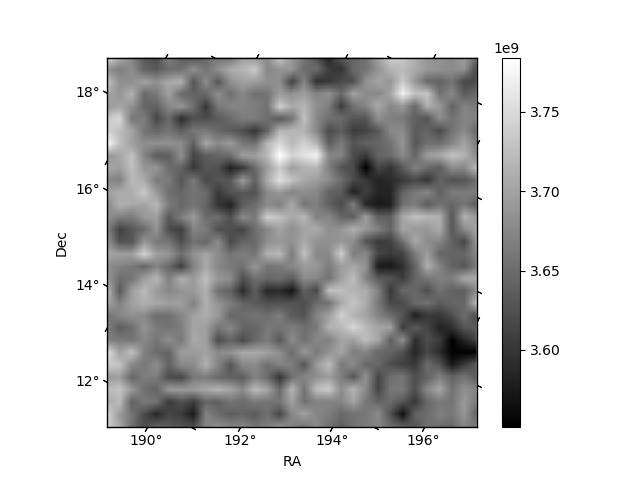
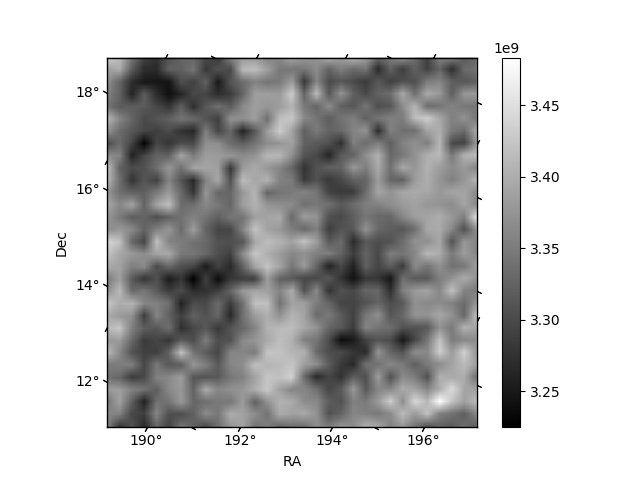
Histogram calculated using DETX and DETY for each event in the final _common_clean file
| Quadrant A | 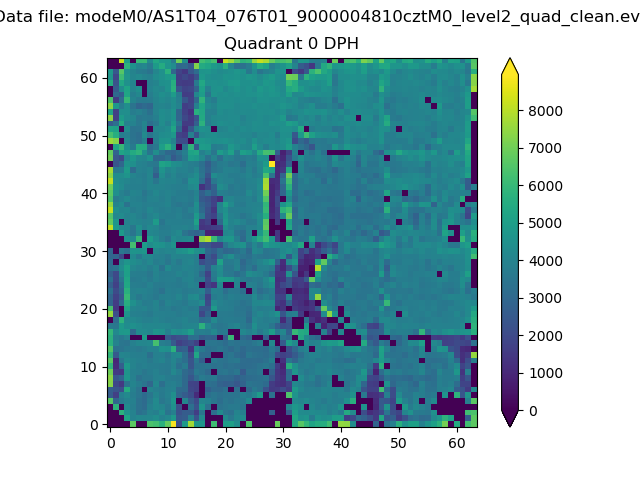 |
 |
Quadrant B |
|---|---|---|---|
| Quadrant D | 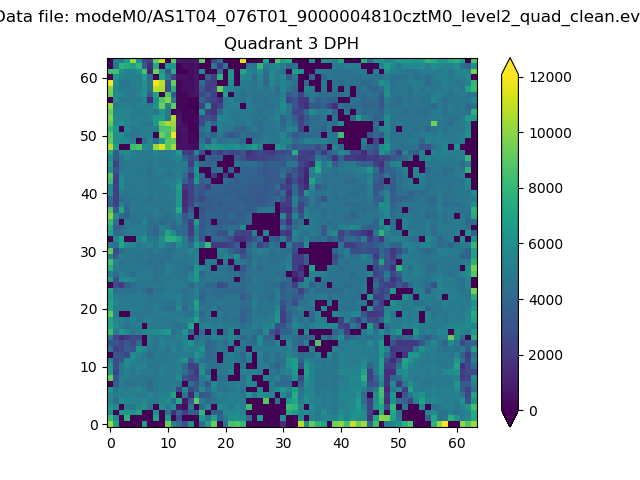 |
 |
Quadrant C |
| Plot type | Count rate plots | Images |
|---|---|---|
| Comparison with Poisson distribution Blue bars denote a histogram of data divided into 1 sec bins. Red curve is a Poisson curve with rate = median count rate of data. |
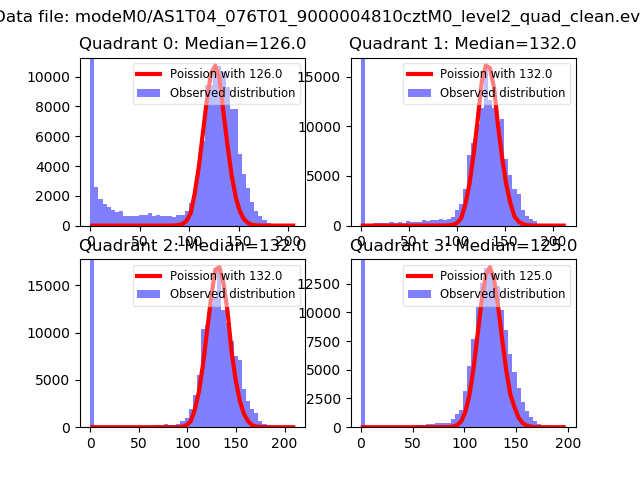 |
 |
| Quadrant-wise count rates Data is divided into 100 sec bins |
 |
|
| Module-wise count rates for Quadrant A Data is divided into 100 sec bins |
 |
 |
| Module-wise count rates for Quadrant B Data is divided into 100 sec bins |
 |
 |
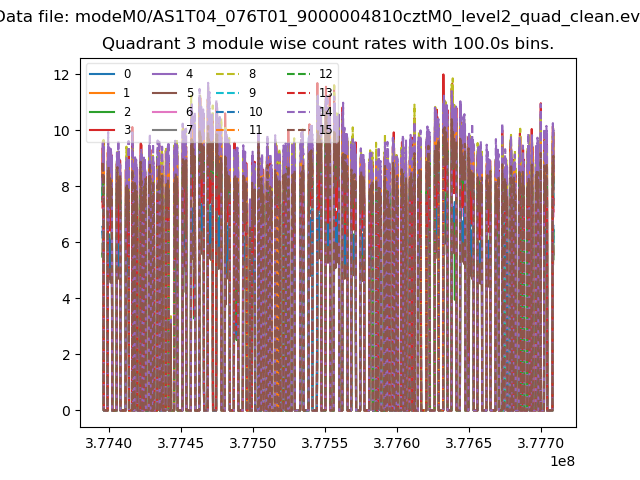
| Module-wise count rates for Quadrant C Data is divided into 100 sec bins |
 |
 |
| Module-wise count rates for Quadrant D Data is divided into 100 sec bins |
 |
 |
| Parameter | Plot |
|---|---|
| CZT HV Monitor | 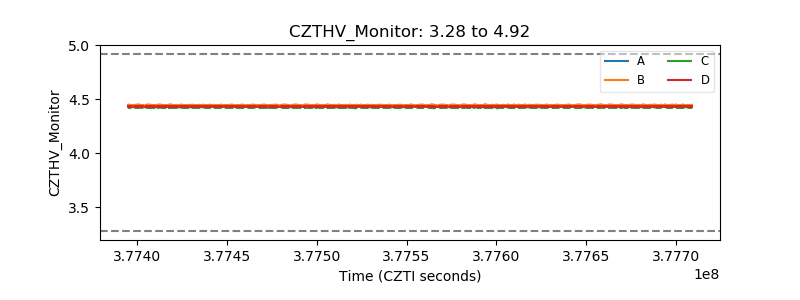 |
| D_VDD | 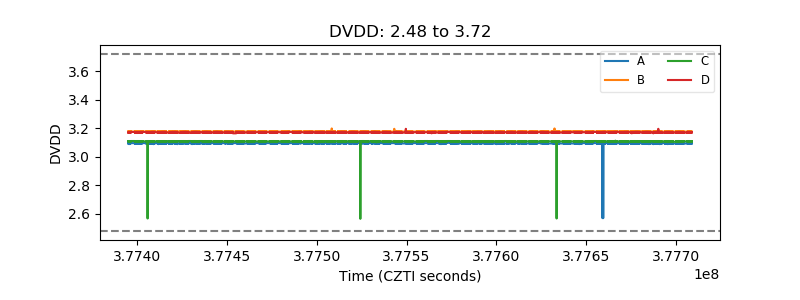 |
| Temperature 1 | 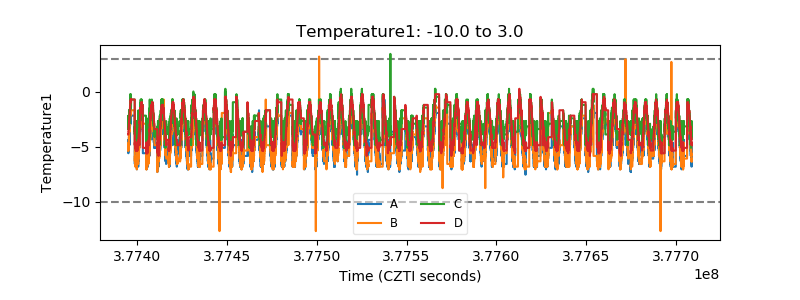 |
| Veto HV Monitor |  |
| Veto LLD | 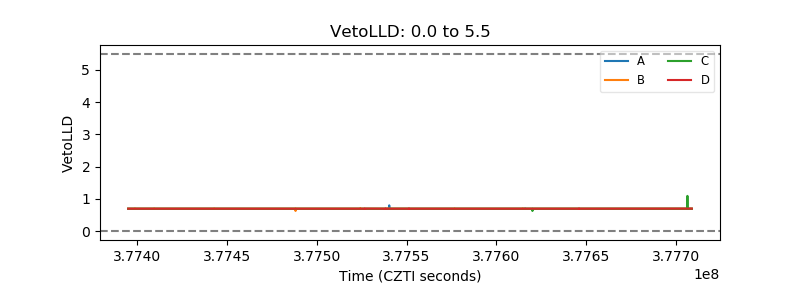 |
| Alpha Counter |  |
| _CPM_Rate | 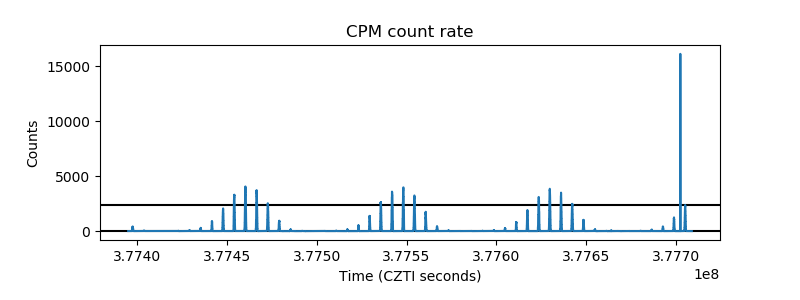 |
| CZT Counter |  |
| +2.5 Volts monitor |  |
| +5 Volts monitor |  |
| _ROLL_ROT | 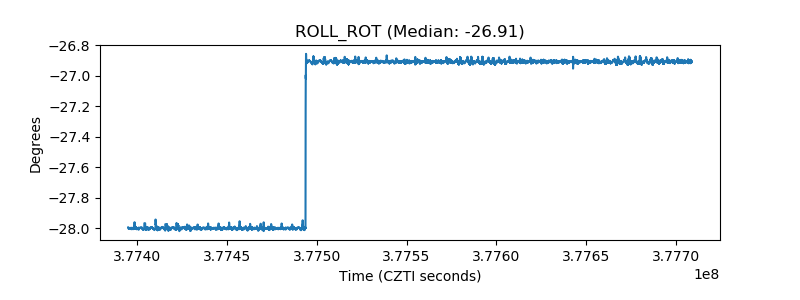 |
| _Roll_DEC | 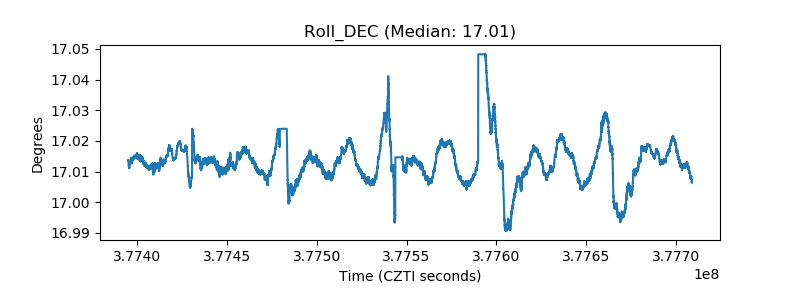 |
| _Roll_RA | 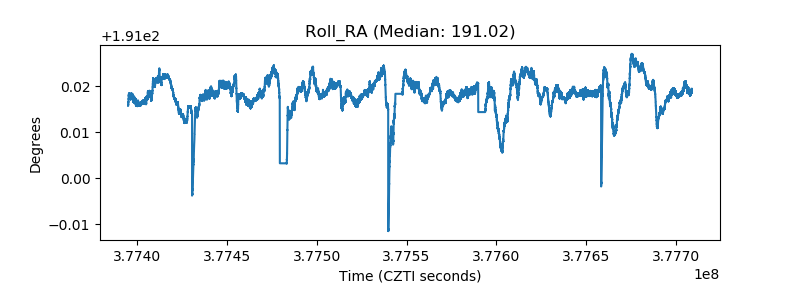 |
| Veto Counter |  |