| Param | Original file | Final file |
|---|---|---|
| Filename | modeM0/AS1T04_076T01_9000004810_33628cztM0_level2.evt | modeM0/AS1T04_076T01_9000004810_33628cztM0_level2_quad_clean.evt |
| Size (bytes) | 219,867,840 | 32,518,080 |
| Size | 209.7 MB | 31.0 MB |
| Events in quadrant A | 1,147,592 | 207,071 |
| Events in quadrant B | 1,962,061 | 211,024 |
| Events in quadrant C | 1,474,461 | 205,798 |
| Events in quadrant D | 1,915,752 | 193,494 |
| Mode SS | |||
|---|---|---|---|
| Quadrant | BADHDUFLAG | Total packets | Discarded packets |
| A | 0 | 48 | 0 |
| B | 0 | 48 | 0 |
| C | 0 | 48 | 0 |
| D | 0 | 48 | 0 |
| Mode M9 | |||
|---|---|---|---|
| Quadrant | BADHDUFLAG | Total packets | Discarded packets |
| A | 0 | 21 | 0 |
| B | 0 | 21 | 0 |
| C | 0 | 21 | 0 |
| D | 0 | 21 | 0 |
| Mode M0 | |||
|---|---|---|---|
| Quadrant | BADHDUFLAG | Total packets | Discarded packets |
| A | 0 | 4797 | 2 |
| B | 0 | 7310 | 1 |
| C | 0 | 5799 | 1 |
| D | 0 | 7279 | 1 |
| Quadrant | Total seconds | Saturated seconds | Saturation percentage |
|---|---|---|---|
| A | 2314 | 7 | 0.302506% |
| B | 2314 | 302 | 13.050994% |
| C | 2314 | 75 | 3.241141% |
| D | 2314 | 101 | 4.364736% |
Noise dominated data is calculated using 1-second bins in cleaned event files. If a bin has >2000 counts, and if more than 50% of those come from <1% of pixels, then it is considered to be noise-dominated and hence unusable.
| Quadrant | # 1 sec bins | Bins with >0 counts | Bins with >2000 counts | High rate bins dominated by noise | Noise dominated (total time) | Noise dominated (detector-on time) | Marked lightcurve |
|---|---|---|---|---|---|---|---|
| A | 4377 | 2315 | 2 | 2 | 0.05% | 0.09% | 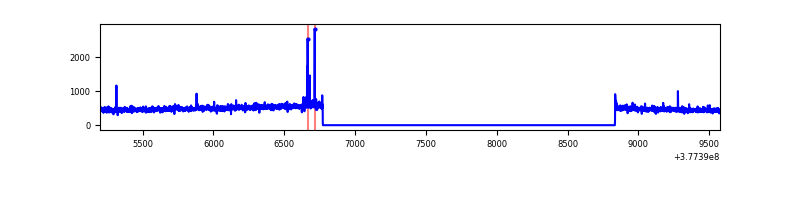 |
| B | 4377 | 2315 | 254 | 254 | 5.80% | 10.97% | 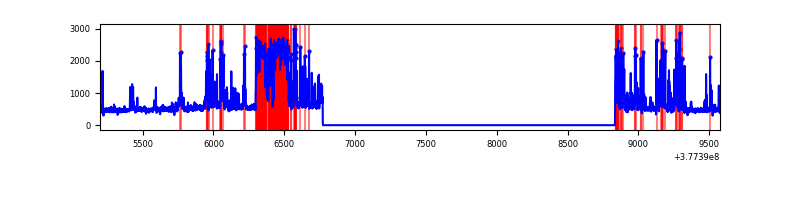 |
| C | 4377 | 2315 | 62 | 62 | 1.42% | 2.68% | 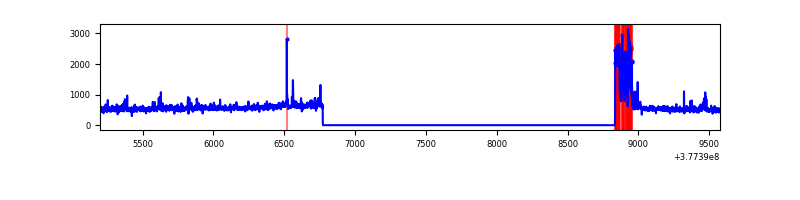 |
| D | 4377 | 2315 | 81 | 81 | 1.85% | 3.50% |  |
Top three noisy pixels from each quadrant. If the there are fewer than three noisy pixels in the level2.evt file, extra rows are filled as -1
| Pixel properties | Quadrant properties | ||||||
|---|---|---|---|---|---|---|---|
| Quadrant | DetID | PixID | Counts | Sigma | Mean | Median | Sigma |
| A | 15 | 169 | 11751 | 192.37 | 289 | 284 | 59.6 |
| A | 15 | 237 | 8178 | 132.43 | 289 | 284 | 59.6 |
| A | 13 | 254 | 3884 | 60.39 | 289 | 284 | 59.6 |
| B | 5 | 172 | 816448 | 15204.1 | 270 | 264 | 53.7 |
| B | 5 | 255 | 32268 | 596.18 | 270 | 264 | 53.7 |
| B | 0 | 213 | 12435 | 226.72 | 270 | 264 | 53.7 |
| C | 0 | 10 | 208178 | 3112.37 | 281 | 284 | 66.8 |
| C | 15 | 214 | 105990 | 1582.52 | 281 | 284 | 66.8 |
| C | 3 | 233 | 47234 | 702.89 | 281 | 284 | 66.8 |
| D | 8 | 195 | 327569 | 4345.54 | 277 | 271 | 75.3 |
| D | 2 | 250 | 166838 | 2211.51 | 277 | 271 | 75.3 |
| D | 12 | 6 | 72197 | 954.96 | 277 | 271 | 75.3 |
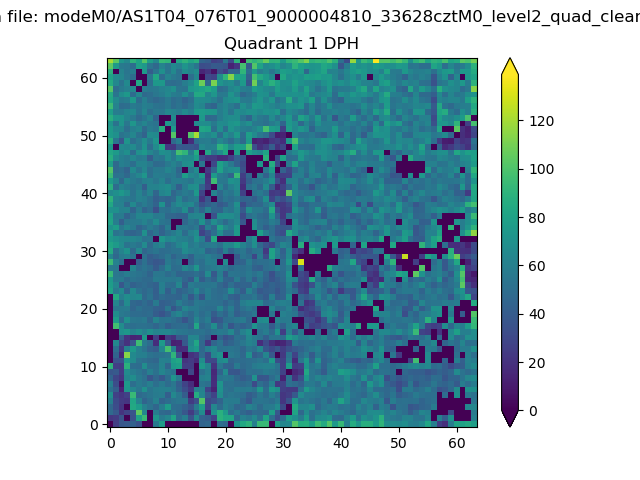
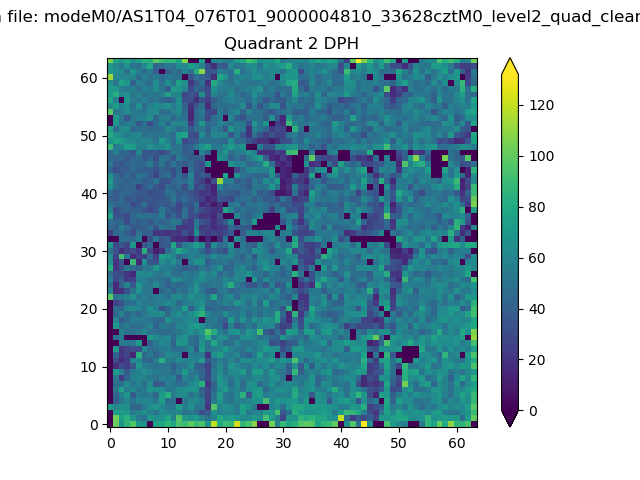
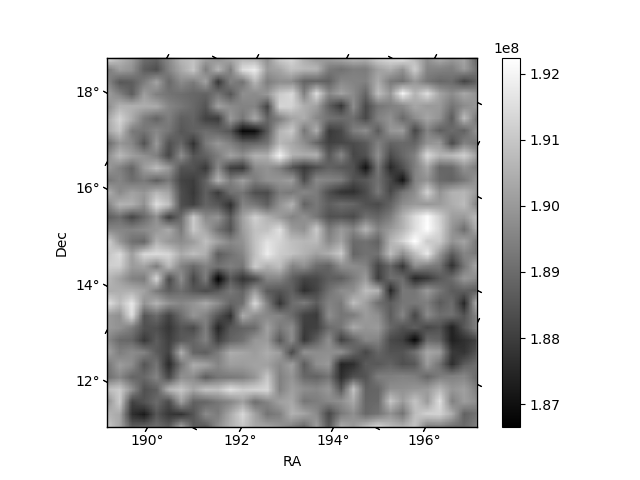
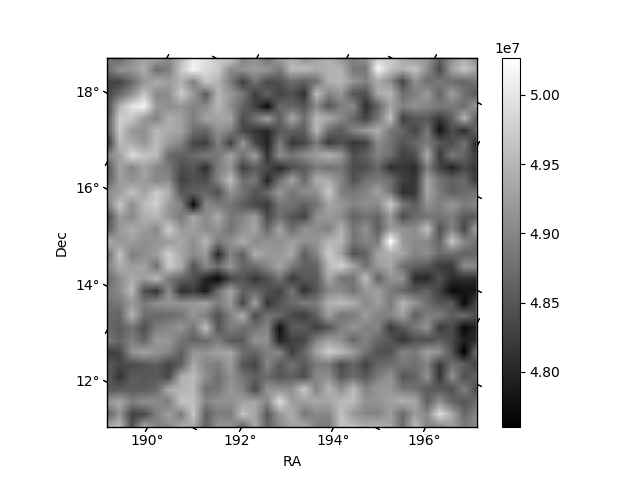
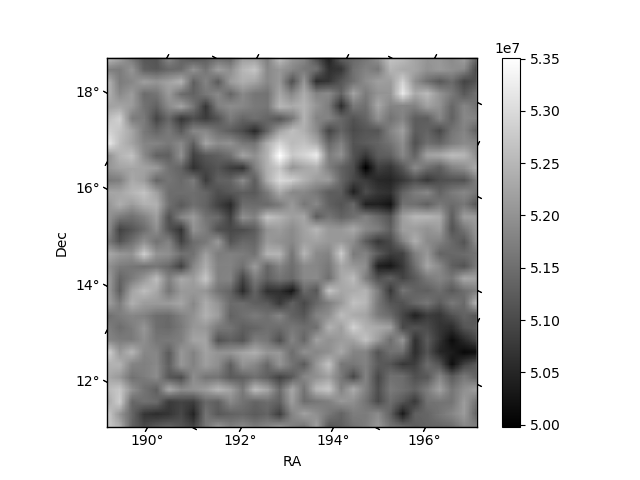
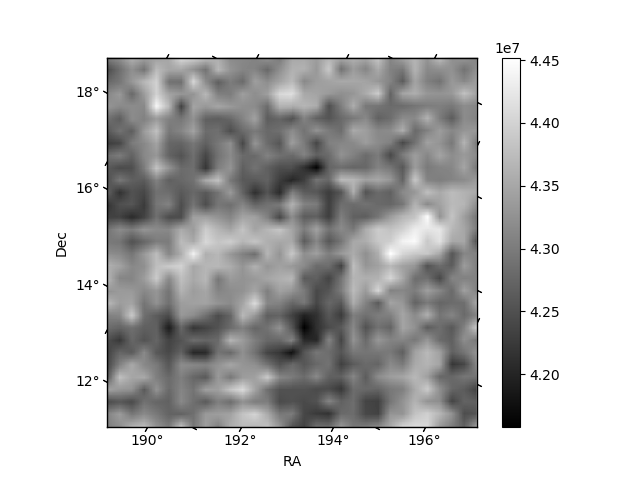
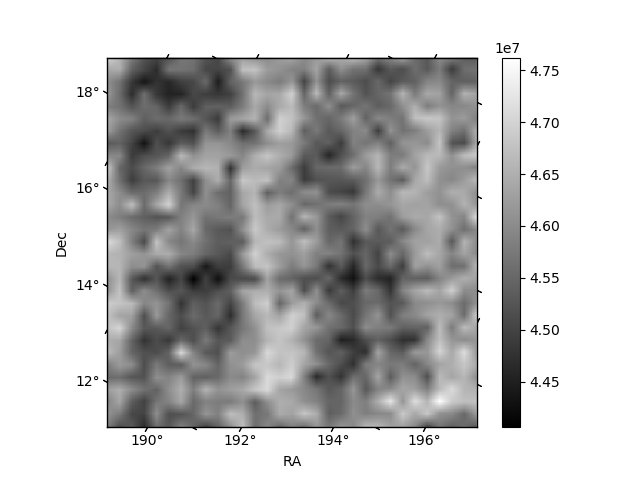
Histogram calculated using DETX and DETY for each event in the final _common_clean file
| Quadrant A | 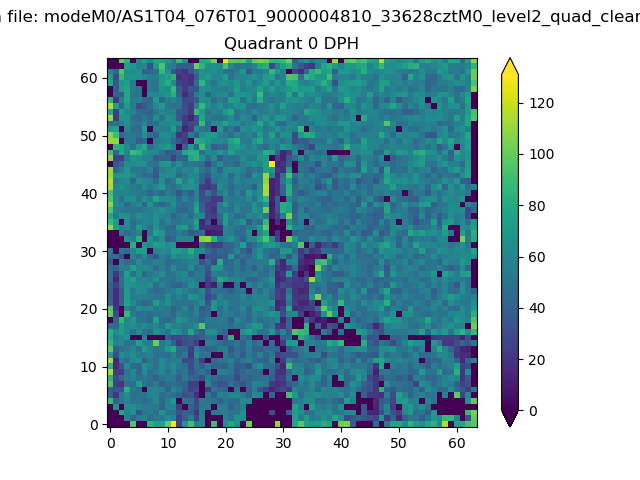 |
 |
Quadrant B |
|---|---|---|---|
| Quadrant D | 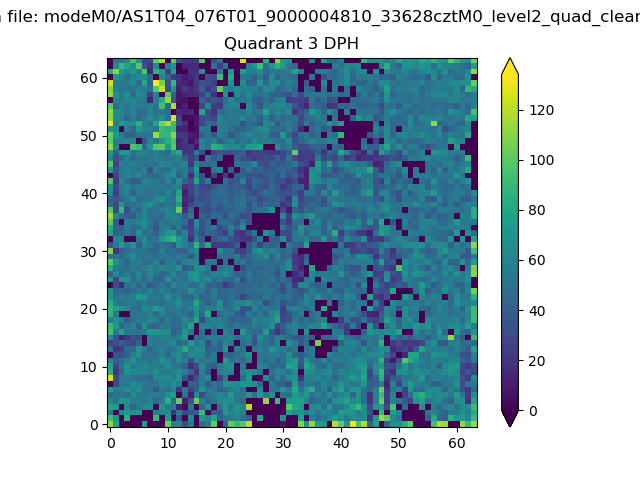 |
 |
Quadrant C |
| Plot type | Count rate plots | Images |
|---|---|---|
| Comparison with Poisson distribution Blue bars denote a histogram of data divided into 1 sec bins. Red curve is a Poisson curve with rate = median count rate of data. |
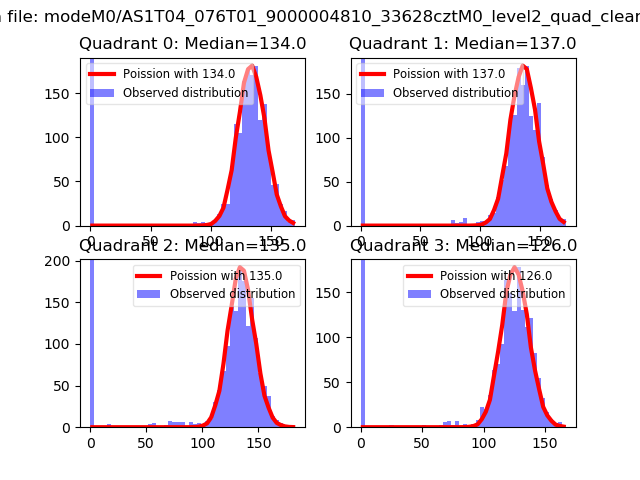 |
 |
| Quadrant-wise count rates Data is divided into 100 sec bins |
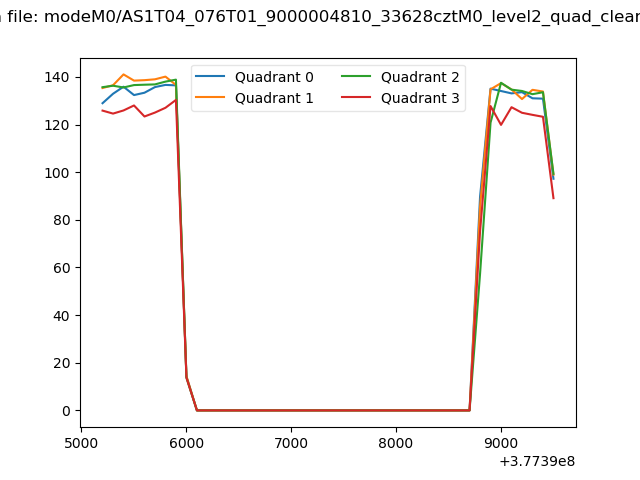 |
|
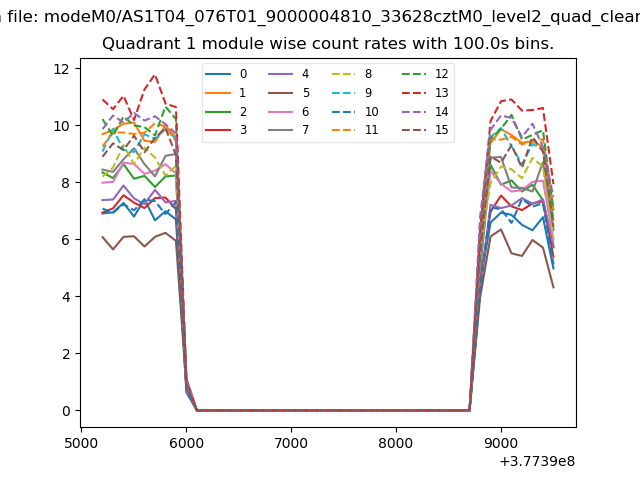
| Module-wise count rates for Quadrant A Data is divided into 100 sec bins |
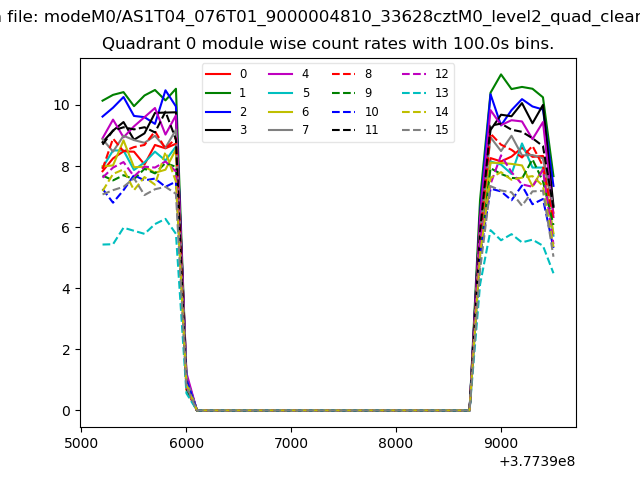 |
 |
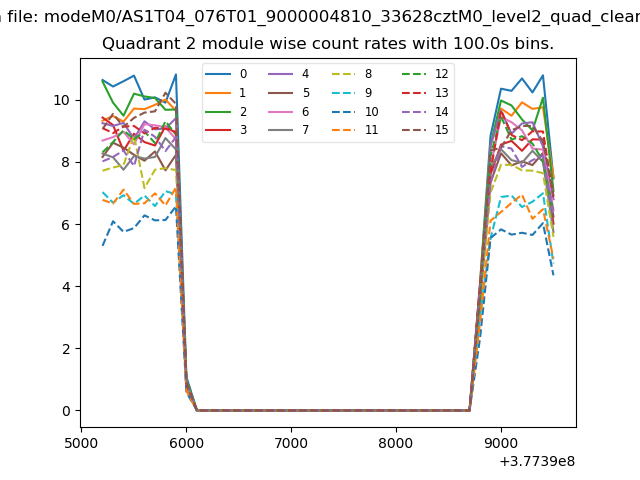
| Module-wise count rates for Quadrant B Data is divided into 100 sec bins |
 |
 |
| Module-wise count rates for Quadrant C Data is divided into 100 sec bins |
 |
 |
| Module-wise count rates for Quadrant D Data is divided into 100 sec bins |
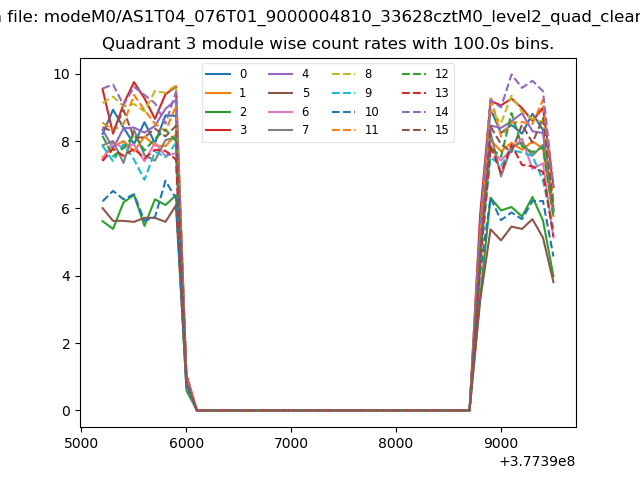 |
 |
| Parameter | Plot |
|---|---|
| CZT HV Monitor | 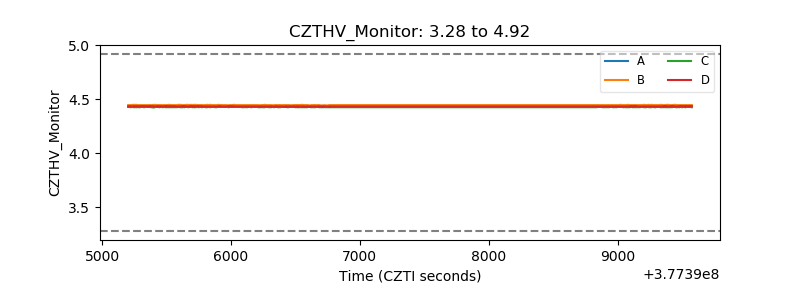 |
| D_VDD | 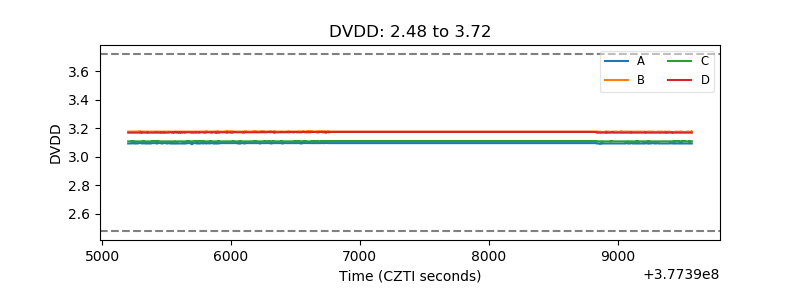 |
| Temperature 1 | 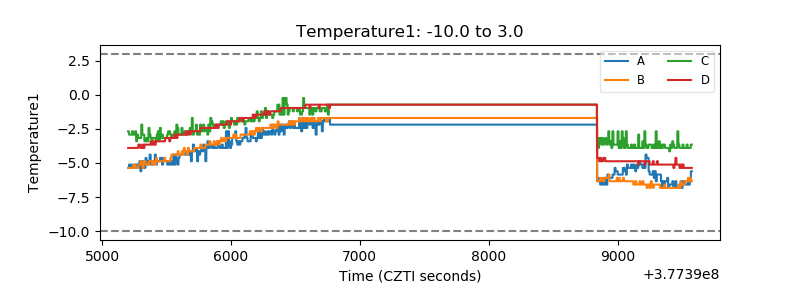 |
| Veto HV Monitor | 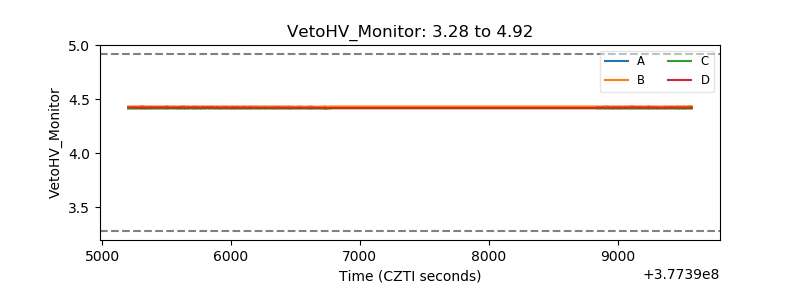 |
| Veto LLD | 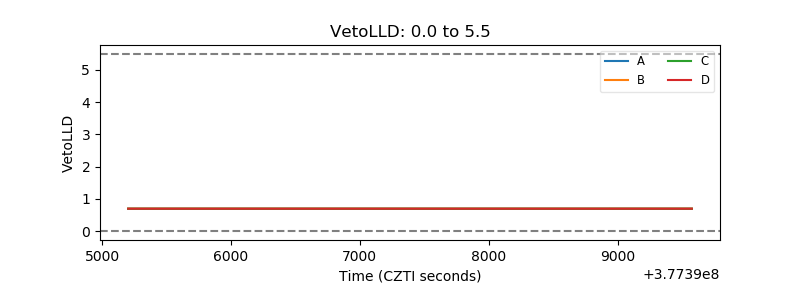 |
| Alpha Counter | 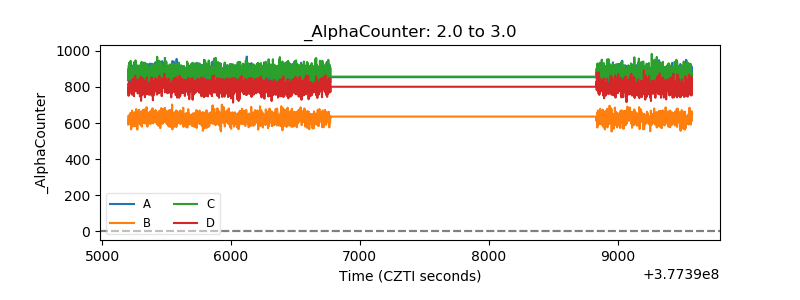 |
| _CPM_Rate | 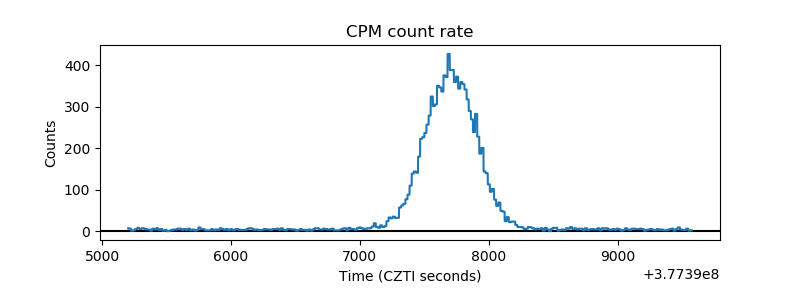 |
| CZT Counter | 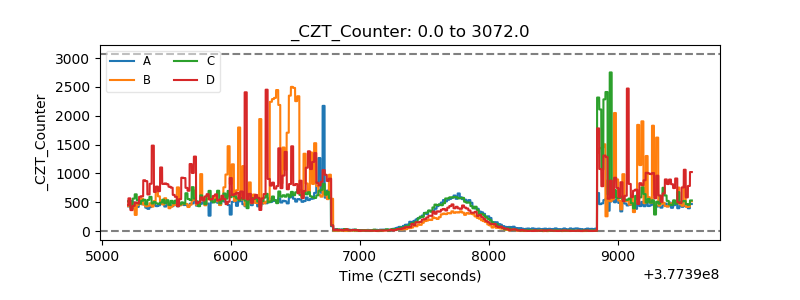 |
| +2.5 Volts monitor | 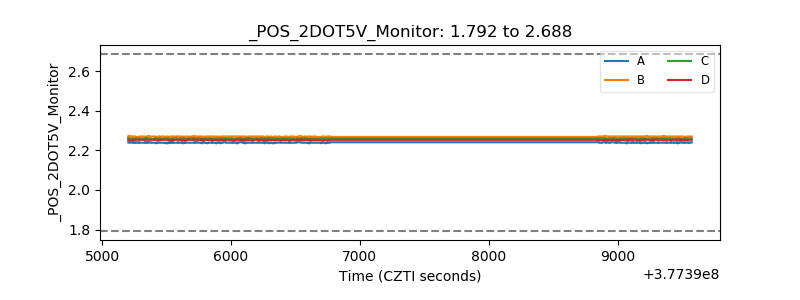 |
| +5 Volts monitor |  |
| _ROLL_ROT | 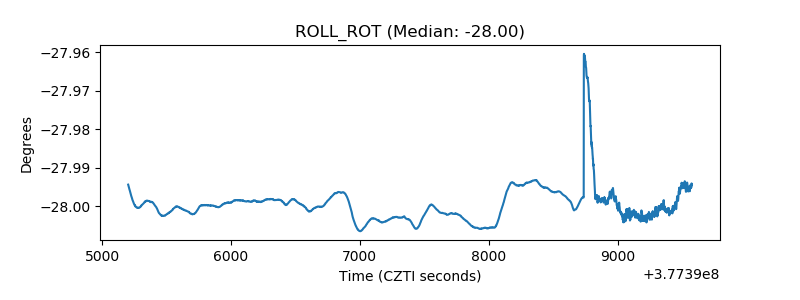 |
| _Roll_DEC | 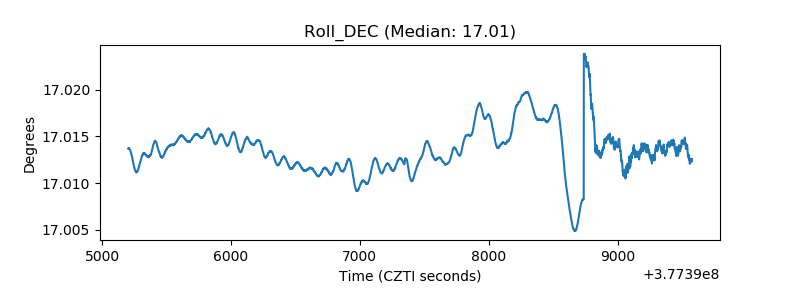 |
| _Roll_RA | 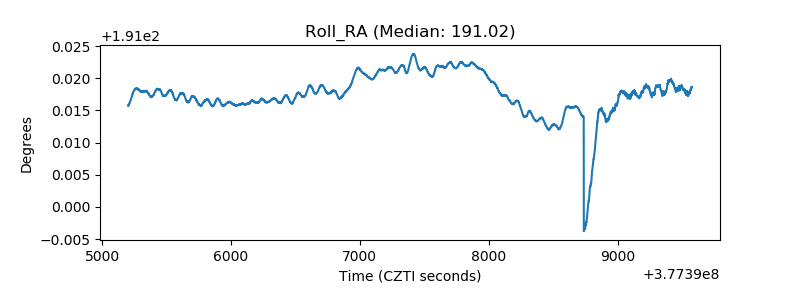 |
| Veto Counter | 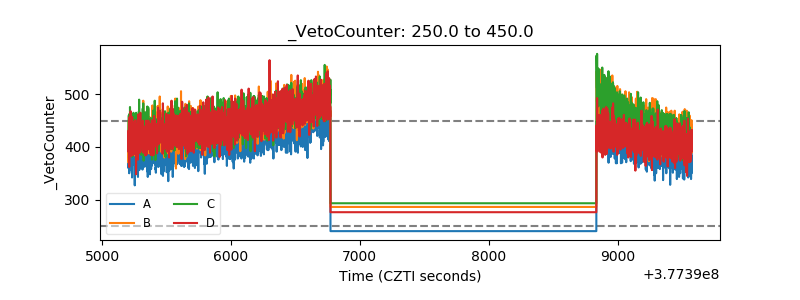 |