| Param | Original file | Final file |
|---|---|---|
| Filename | modeM0/AS1T04_076T01_9000004810_33629cztM0_level2.evt | modeM0/AS1T04_076T01_9000004810_33629cztM0_level2_quad_clean.evt |
| Size (bytes) | 497,453,760 | 79,384,320 |
| Size | 474.4 MB | 75.7 MB |
| Events in quadrant A | 2,537,996 | 518,845 |
| Events in quadrant B | 4,375,671 | 498,786 |
| Events in quadrant C | 3,342,533 | 513,330 |
| Events in quadrant D | 4,434,492 | 486,087 |
| Mode SS | |||
|---|---|---|---|
| Quadrant | BADHDUFLAG | Total packets | Discarded packets |
| A | 0 | 112 | 0 |
| B | 0 | 112 | 0 |
| C | 0 | 112 | 0 |
| D | 0 | 112 | 0 |
| Mode M9 | |||
|---|---|---|---|
| Quadrant | BADHDUFLAG | Total packets | Discarded packets |
| A | 0 | 29 | 0 |
| B | 0 | 29 | 0 |
| C | 0 | 29 | 0 |
| D | 0 | 30 | 0 |
| Mode M0 | |||
|---|---|---|---|
| Quadrant | BADHDUFLAG | Total packets | Discarded packets |
| A | 0 | 11235 | 3 |
| B | 0 | 16606 | 2 |
| C | 0 | 13313 | 2 |
| D | 0 | 17133 | 2 |
| Quadrant | Total seconds | Saturated seconds | Saturation percentage |
|---|---|---|---|
| A | 5528 | 6 | 0.108538% |
| B | 5528 | 616 | 11.143271% |
| C | 5528 | 139 | 2.514472% |
| D | 5528 | 138 | 2.496382% |
Noise dominated data is calculated using 1-second bins in cleaned event files. If a bin has >2000 counts, and if more than 50% of those come from <1% of pixels, then it is considered to be noise-dominated and hence unusable.
| Quadrant | # 1 sec bins | Bins with >0 counts | Bins with >2000 counts | High rate bins dominated by noise | Noise dominated (total time) | Noise dominated (detector-on time) | Marked lightcurve |
|---|---|---|---|---|---|---|---|
| A | 7322 | 5529 | 3 | 3 | 0.04% | 0.05% |  |
| B | 7321 | 5528 | 512 | 512 | 6.99% | 9.26% | 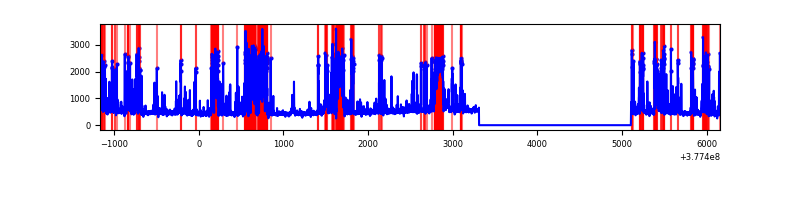 |
| C | 7322 | 5529 | 117 | 117 | 1.60% | 2.12% | 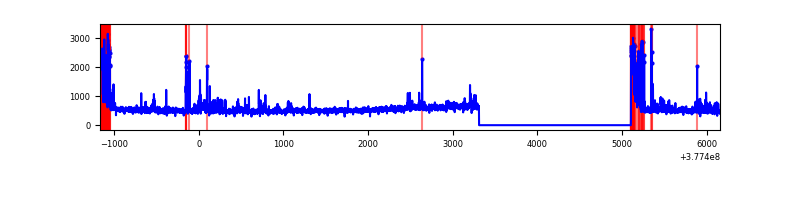 |
| D | 7322 | 5529 | 136 | 136 | 1.86% | 2.46% | 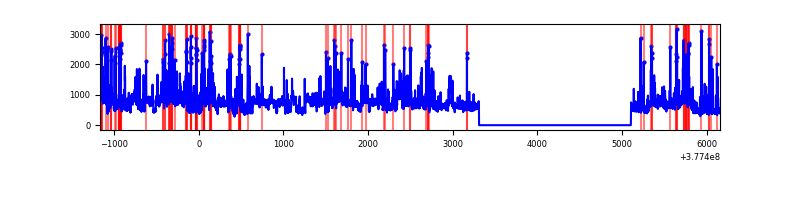 |
Top three noisy pixels from each quadrant. If the there are fewer than three noisy pixels in the level2.evt file, extra rows are filled as -1
| Pixel properties | Quadrant properties | ||||||
|---|---|---|---|---|---|---|---|
| Quadrant | DetID | PixID | Counts | Sigma | Mean | Median | Sigma |
| A | 15 | 237 | 16871 | 124.28 | 648 | 635 | 130.6 |
| A | 13 | 254 | 8782 | 62.36 | 648 | 635 | 130.6 |
| A | 10 | 83 | 7670 | 53.85 | 648 | 635 | 130.6 |
| B | 5 | 172 | 1248576 | 10382.29 | 615 | 598 | 120.2 |
| B | 5 | 255 | 463892 | 3854.28 | 615 | 598 | 120.2 |
| B | 4 | 251 | 136115 | 1127.41 | 615 | 598 | 120.2 |
| C | 0 | 10 | 376888 | 2617.31 | 626 | 633 | 143.8 |
| C | 15 | 214 | 254226 | 1764.05 | 626 | 633 | 143.8 |
| C | 3 | 233 | 140853 | 975.4 | 626 | 633 | 143.8 |
| D | 8 | 195 | 994070 | 5961.94 | 617 | 608 | 166.6 |
| D | 2 | 250 | 350743 | 2101.22 | 617 | 608 | 166.6 |
| D | 13 | 249 | 245331 | 1468.63 | 617 | 608 | 166.6 |
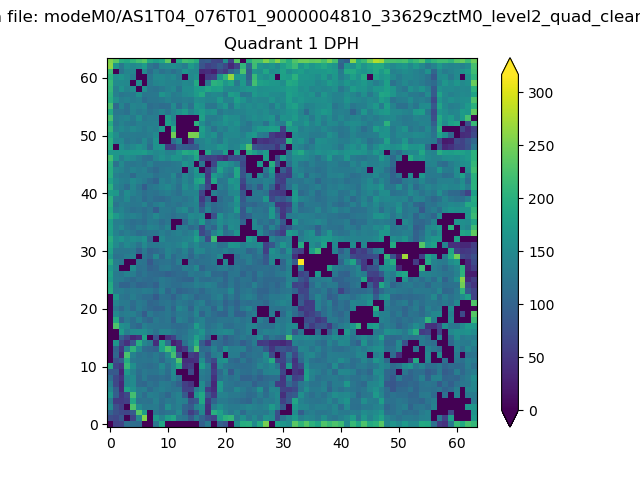
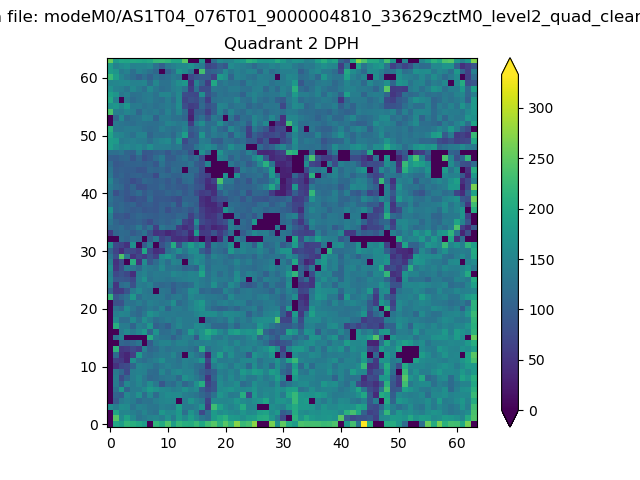
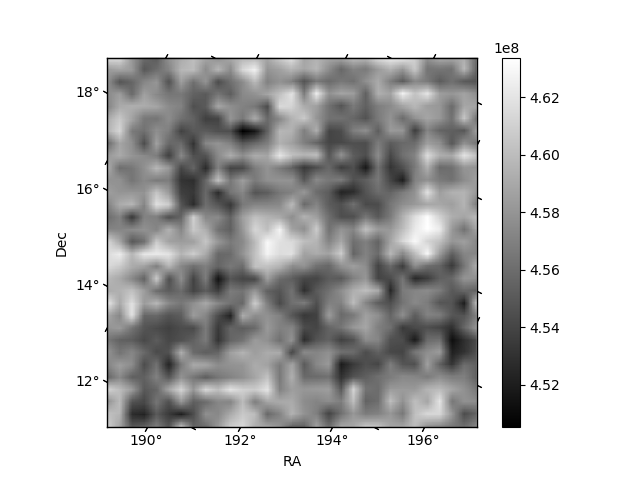
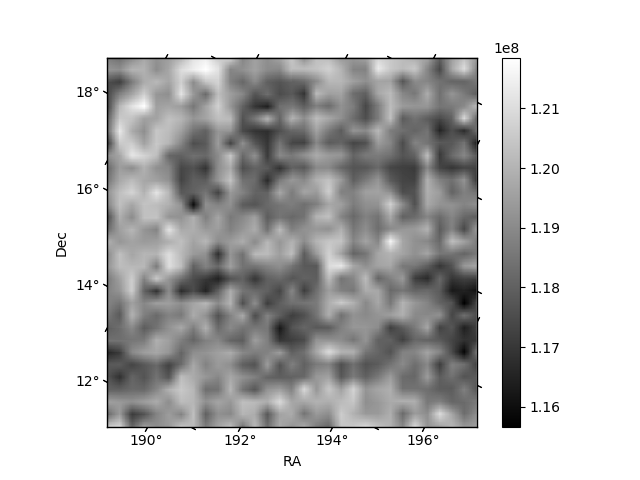
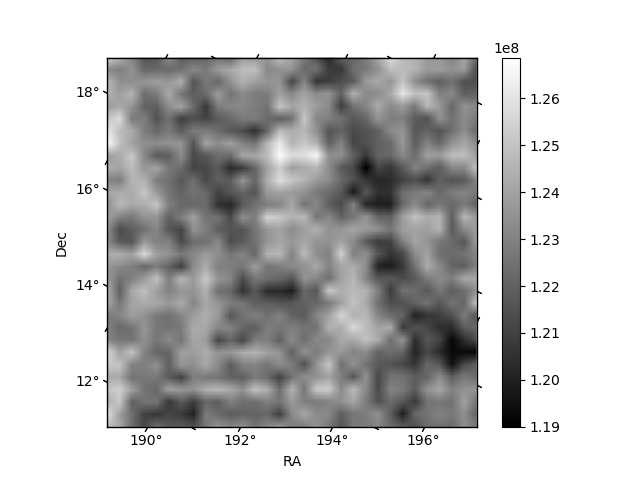
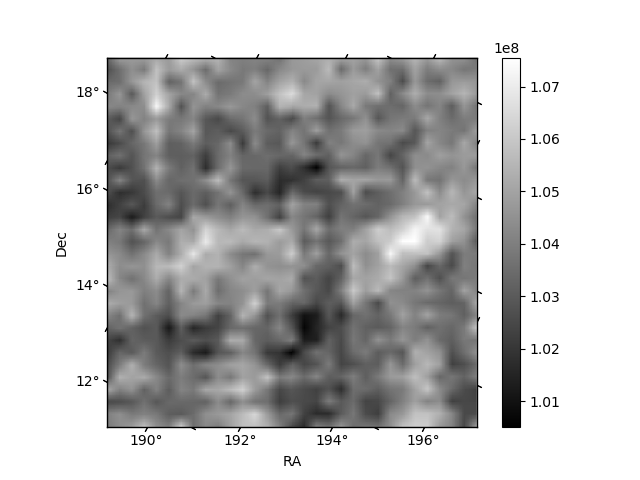
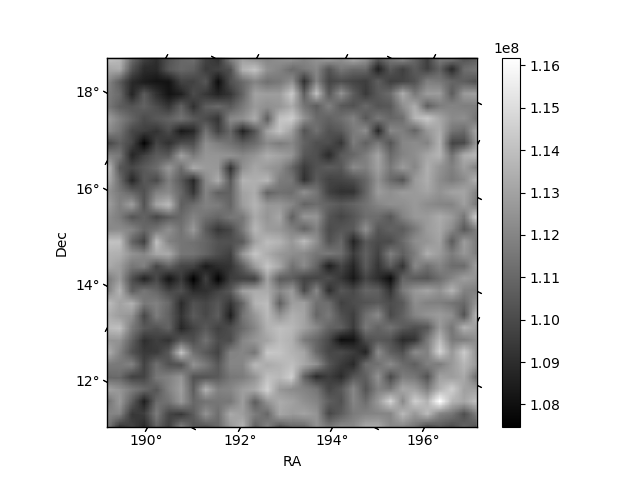
Histogram calculated using DETX and DETY for each event in the final _common_clean file
| Quadrant A | 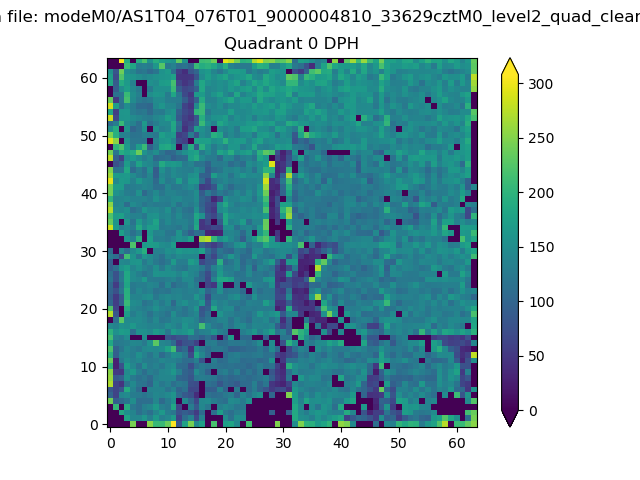 |
 |
Quadrant B |
|---|---|---|---|
| Quadrant D | 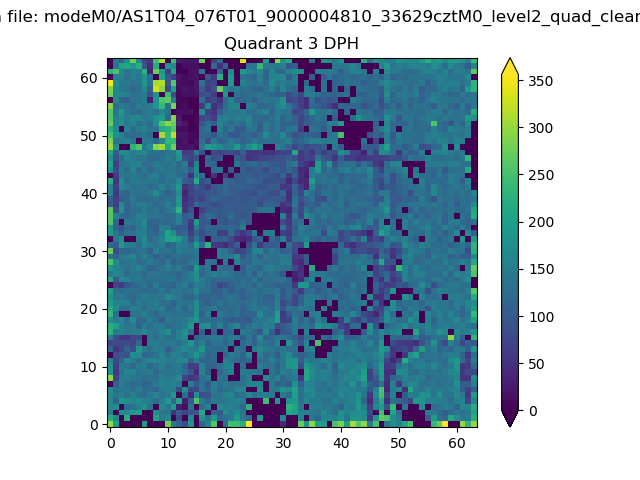 |
 |
Quadrant C |
| Plot type | Count rate plots | Images |
|---|---|---|
| Comparison with Poisson distribution Blue bars denote a histogram of data divided into 1 sec bins. Red curve is a Poisson curve with rate = median count rate of data. |
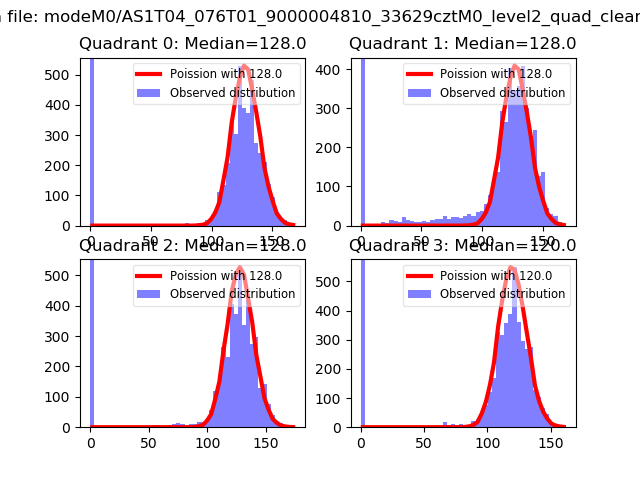 |
 |
| Quadrant-wise count rates Data is divided into 100 sec bins |
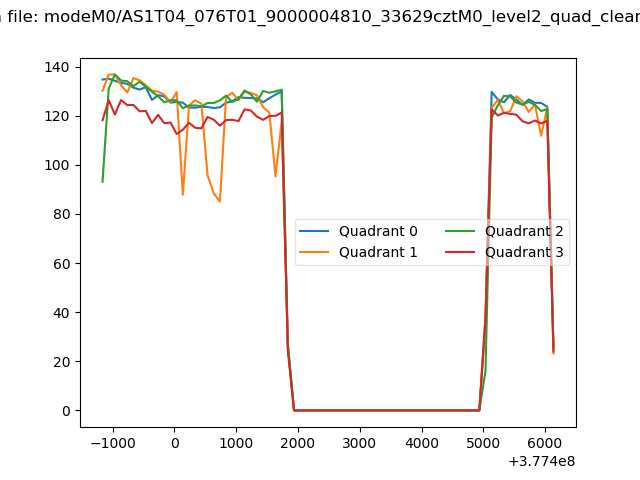 |
|
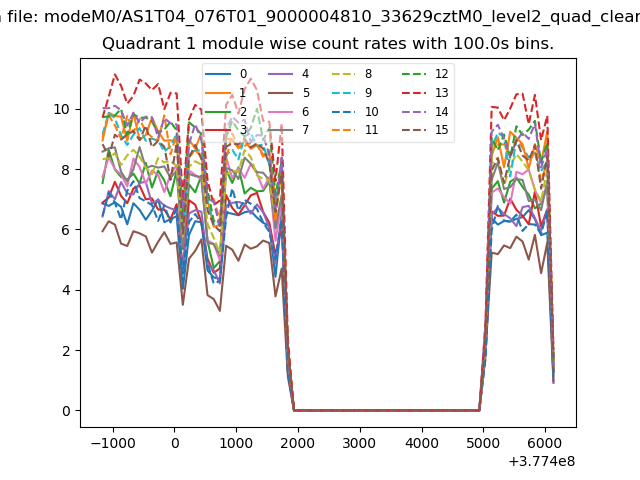
| Module-wise count rates for Quadrant A Data is divided into 100 sec bins |
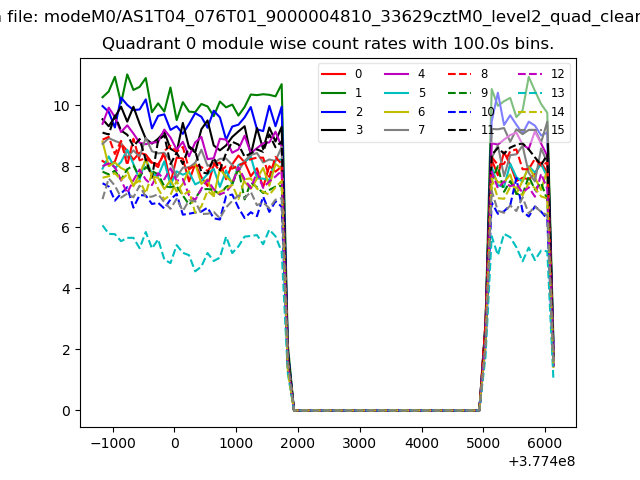 |
 |
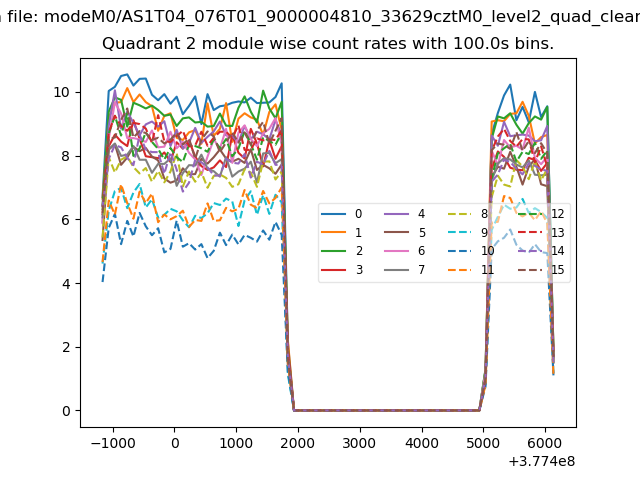
| Module-wise count rates for Quadrant B Data is divided into 100 sec bins |
 |
 |
| Module-wise count rates for Quadrant C Data is divided into 100 sec bins |
 |
 |
| Module-wise count rates for Quadrant D Data is divided into 100 sec bins |
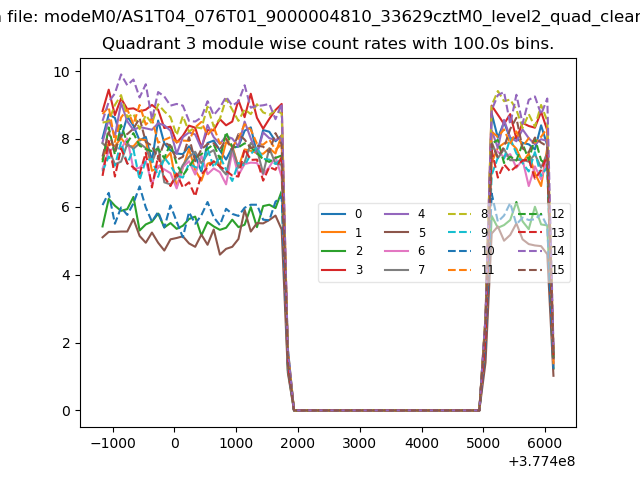 |
 |
| Parameter | Plot |
|---|---|
| CZT HV Monitor | 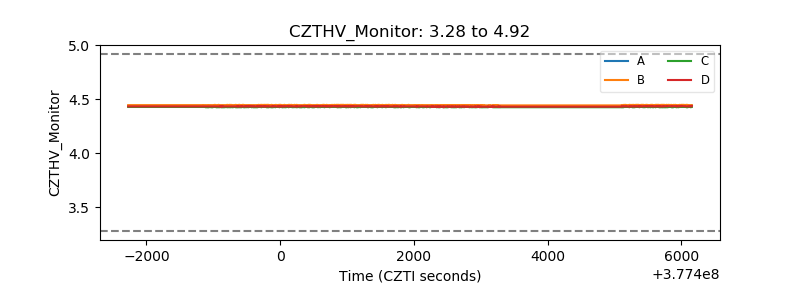 |
| D_VDD |  |
| Temperature 1 | 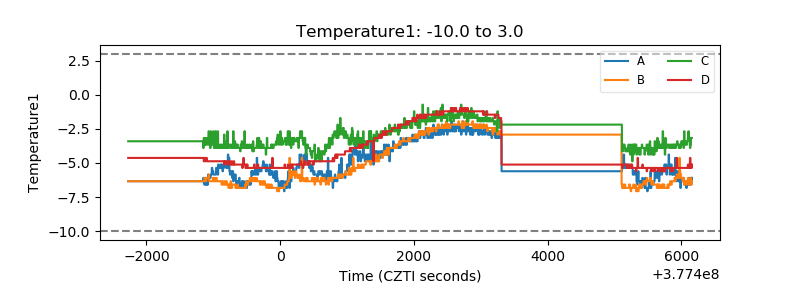 |
| Veto HV Monitor | 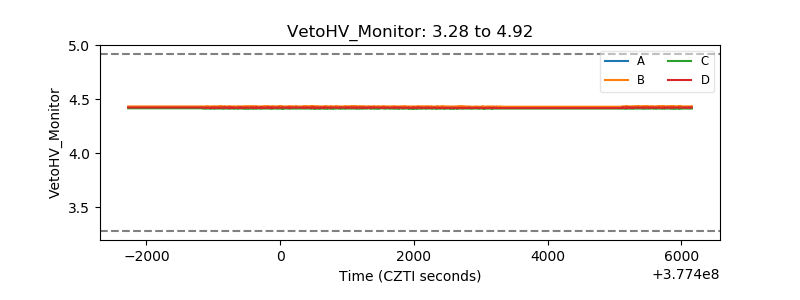 |
| Veto LLD | 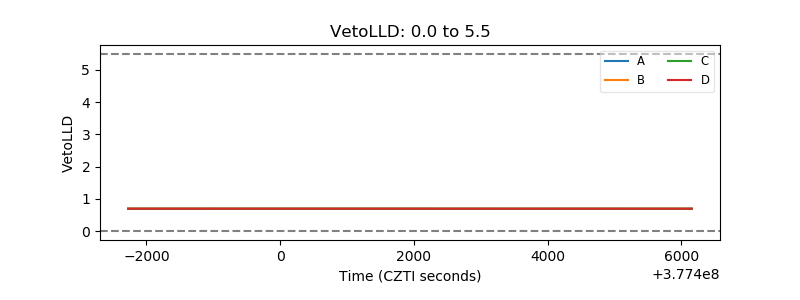 |
| Alpha Counter | 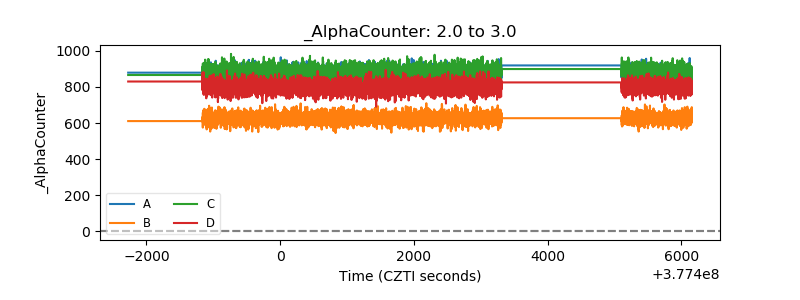 |
| _CPM_Rate | 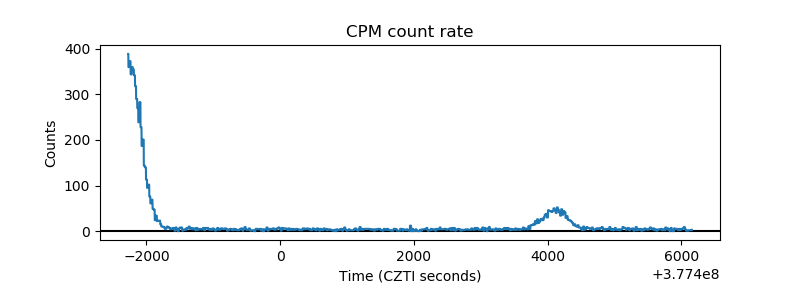 |
| CZT Counter | 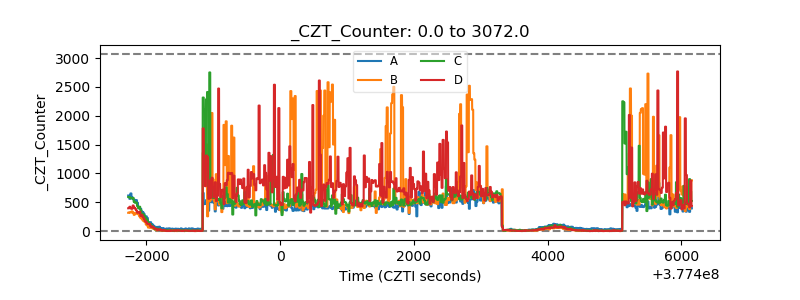 |
| +2.5 Volts monitor |  |
| +5 Volts monitor |  |
| _ROLL_ROT | 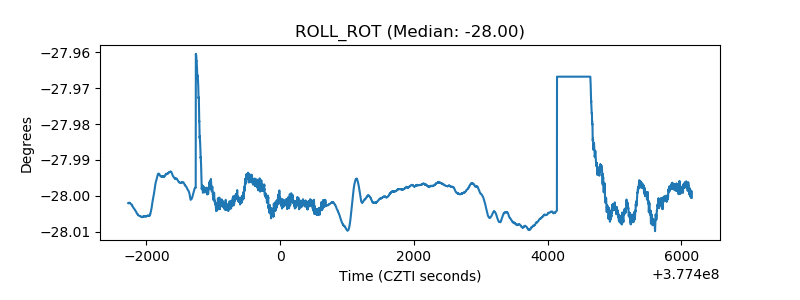 |
| _Roll_DEC |  |
| _Roll_RA | 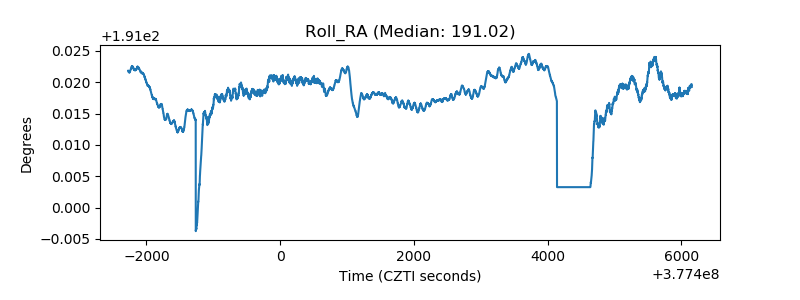 |
| Veto Counter | 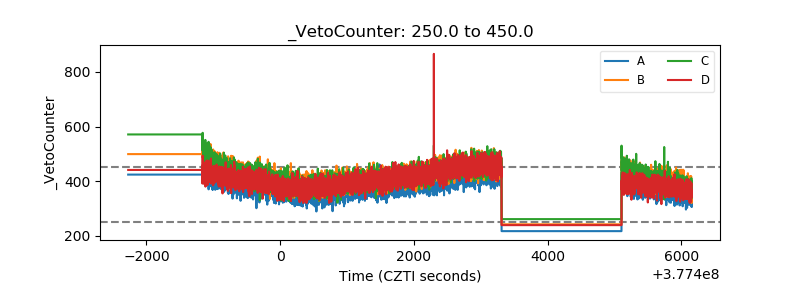 |