| Param | Original file | Final file |
|---|---|---|
| Filename | modeM0/AS1T04_076T01_9000004810_33630cztM0_level2.evt | modeM0/AS1T04_076T01_9000004810_33630cztM0_level2_quad_clean.evt |
| Size (bytes) | 556,113,600 | 71,858,880 |
| Size | 530.4 MB | 68.5 MB |
| Events in quadrant A | 2,751,754 | 455,225 |
| Events in quadrant B | 4,838,927 | 431,107 |
| Events in quadrant C | 3,786,538 | 449,240 |
| Events in quadrant D | 5,064,846 | 427,502 |
| Mode SS | |||
|---|---|---|---|
| Quadrant | BADHDUFLAG | Total packets | Discarded packets |
| A | 0 | 120 | 0 |
| B | 0 | 120 | 0 |
| C | 0 | 120 | 0 |
| D | 0 | 120 | 0 |
| Mode M9 | |||
|---|---|---|---|
| Quadrant | BADHDUFLAG | Total packets | Discarded packets |
| A | 0 | 18 | 0 |
| B | 0 | 18 | 0 |
| C | 0 | 18 | 0 |
| D | 0 | 19 | 0 |
| Mode M0 | |||
|---|---|---|---|
| Quadrant | BADHDUFLAG | Total packets | Discarded packets |
| A | 0 | 12199 | 3 |
| B | 0 | 18401 | 2 |
| C | 0 | 15212 | 2 |
| D | 0 | 19324 | 2 |
| Quadrant | Total seconds | Saturated seconds | Saturation percentage |
|---|---|---|---|
| A | 5905 | 31 | 0.524979% |
| B | 5905 | 658 | 11.143099% |
| C | 5905 | 103 | 1.744285% |
| D | 5905 | 439 | 7.434378% |
Noise dominated data is calculated using 1-second bins in cleaned event files. If a bin has >2000 counts, and if more than 50% of those come from <1% of pixels, then it is considered to be noise-dominated and hence unusable.
| Quadrant | # 1 sec bins | Bins with >0 counts | Bins with >2000 counts | High rate bins dominated by noise | Noise dominated (total time) | Noise dominated (detector-on time) | Marked lightcurve |
|---|---|---|---|---|---|---|---|
| A | 7368 | 5906 | 21 | 21 | 0.29% | 0.36% | 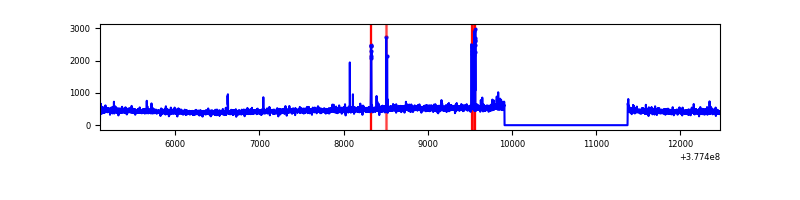 |
| B | 7368 | 5906 | 523 | 523 | 7.10% | 8.86% | 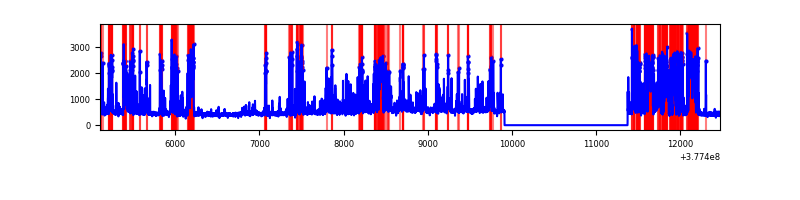 |
| C | 7368 | 5906 | 92 | 92 | 1.25% | 1.56% | 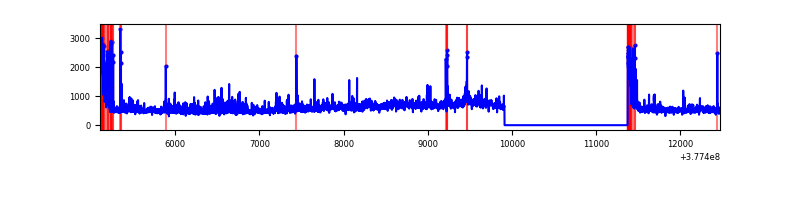 |
| D | 7368 | 5906 | 394 | 394 | 5.35% | 6.67% | 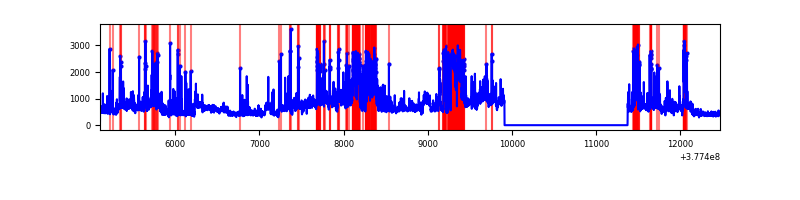 |
Top three noisy pixels from each quadrant. If the there are fewer than three noisy pixels in the level2.evt file, extra rows are filled as -1
| Pixel properties | Quadrant properties | ||||||
|---|---|---|---|---|---|---|---|
| Quadrant | DetID | PixID | Counts | Sigma | Mean | Median | Sigma |
| A | 15 | 237 | 62677 | 446.37 | 686 | 672 | 138.9 |
| A | 15 | 169 | 22090 | 154.19 | 686 | 672 | 138.9 |
| A | 13 | 254 | 8804 | 58.54 | 686 | 672 | 138.9 |
| B | 5 | 172 | 1505667 | 11905.81 | 655 | 638 | 126.4 |
| B | 5 | 255 | 495755 | 3916.72 | 655 | 638 | 126.4 |
| B | 4 | 251 | 94719 | 744.25 | 655 | 638 | 126.4 |
| C | 0 | 10 | 487274 | 3168.08 | 664 | 670 | 153.6 |
| C | 3 | 233 | 328147 | 2132.07 | 664 | 670 | 153.6 |
| C | 15 | 214 | 272659 | 1770.81 | 664 | 670 | 153.6 |
| D | 8 | 195 | 1002274 | 5789.42 | 646 | 634 | 173.0 |
| D | 13 | 249 | 644025 | 3718.76 | 646 | 634 | 173.0 |
| D | 2 | 250 | 330020 | 1903.83 | 646 | 634 | 173.0 |
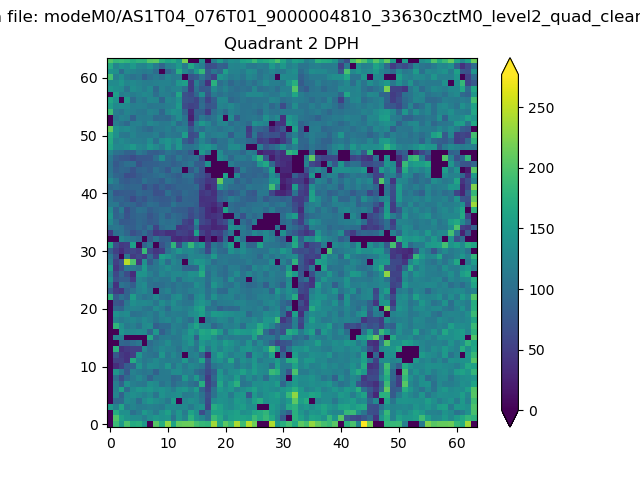
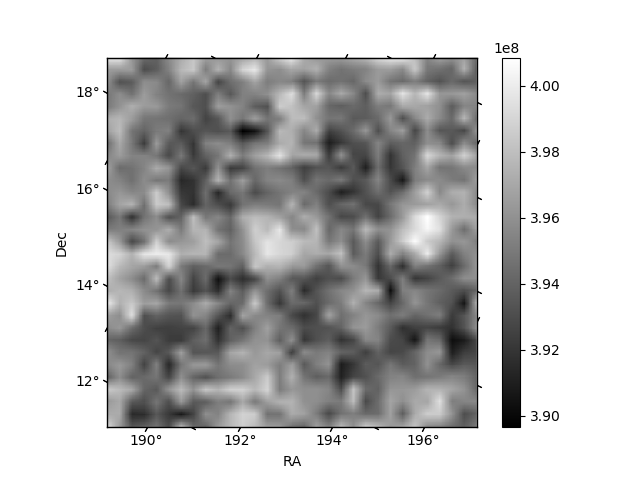
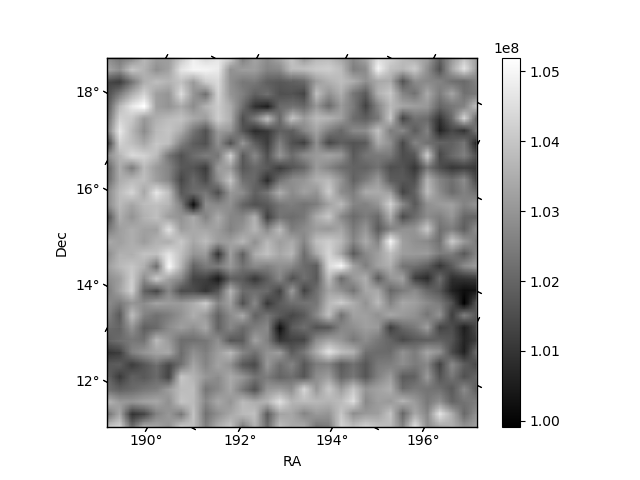
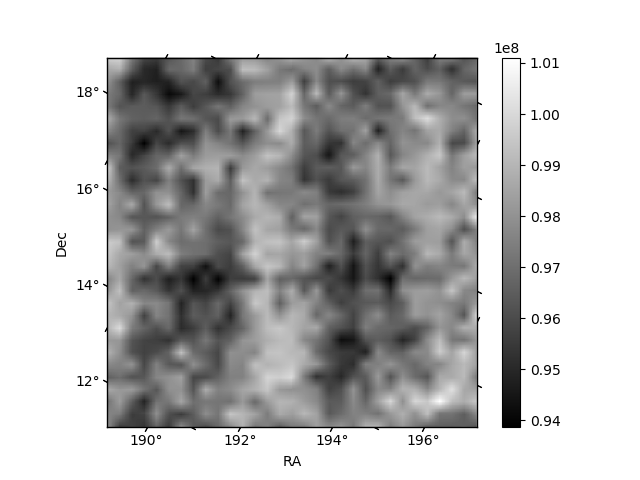
Histogram calculated using DETX and DETY for each event in the final _common_clean file
| Quadrant A | 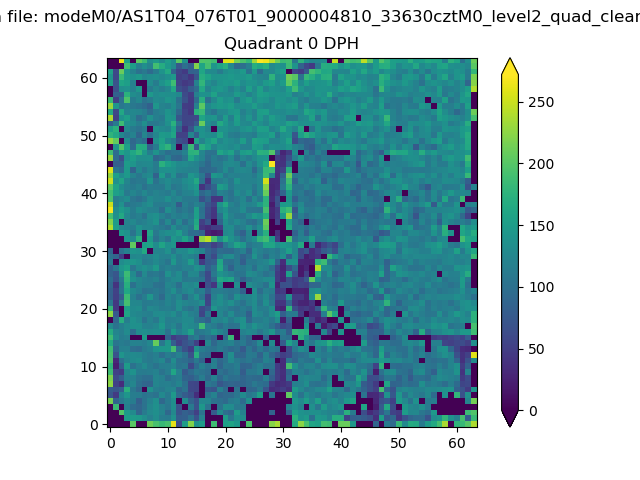 |
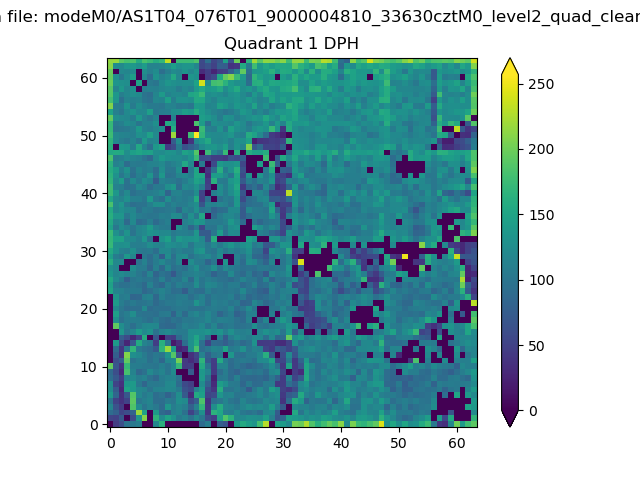 |
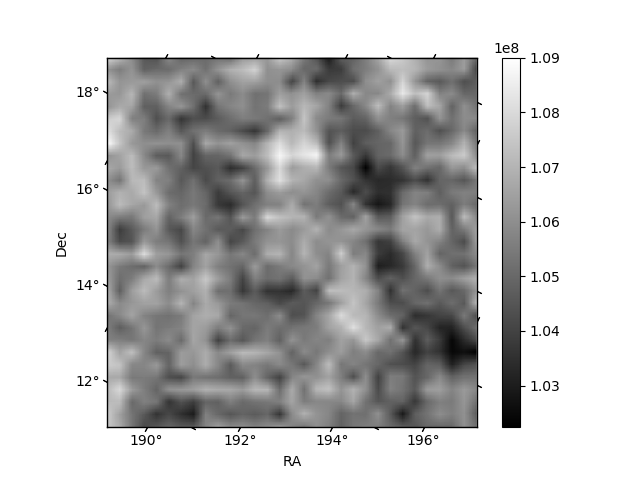
Quadrant B |
|---|---|---|---|
| Quadrant D | 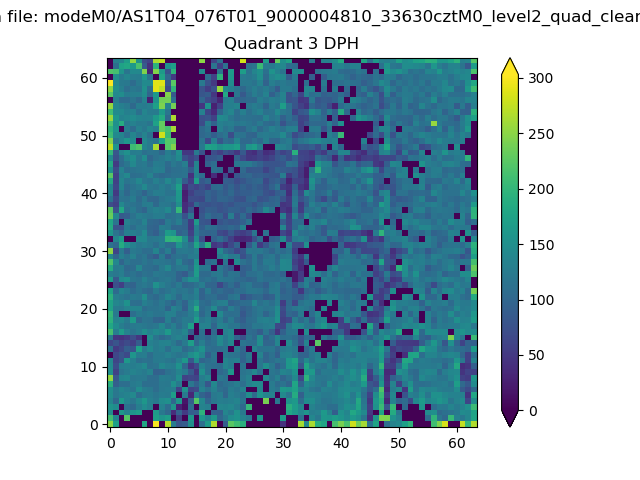 |
 |
Quadrant C |
| Plot type | Count rate plots | Images |
|---|---|---|
| Comparison with Poisson distribution Blue bars denote a histogram of data divided into 1 sec bins. Red curve is a Poisson curve with rate = median count rate of data. |
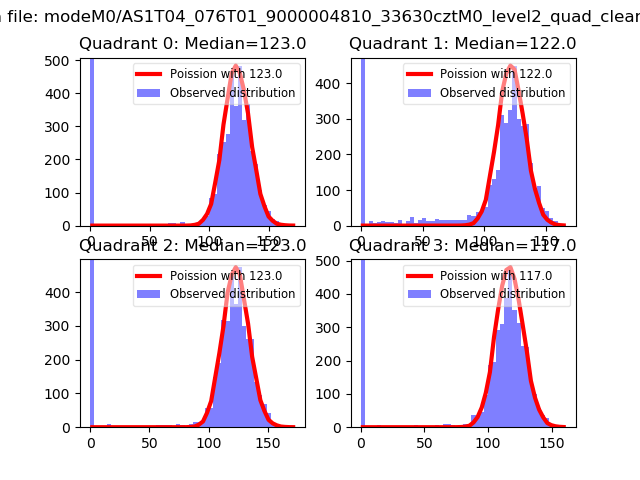 |
 |
| Quadrant-wise count rates Data is divided into 100 sec bins |
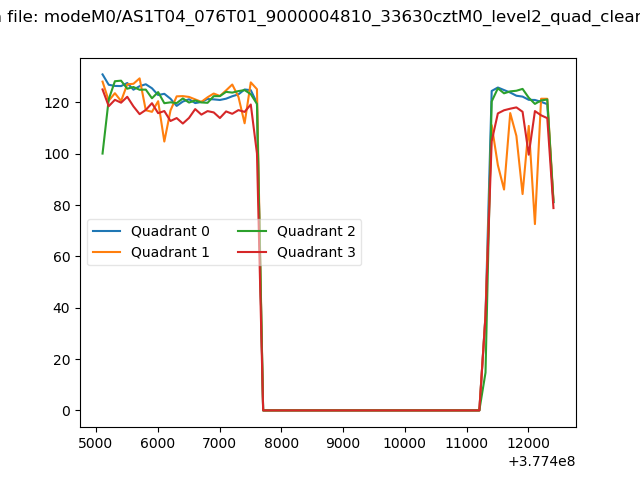 |
|
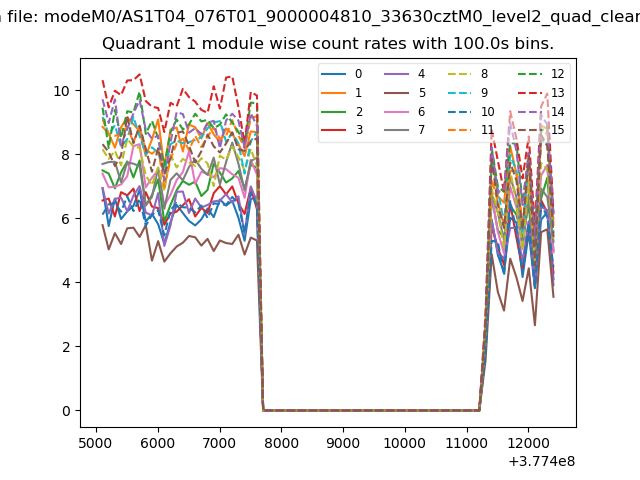
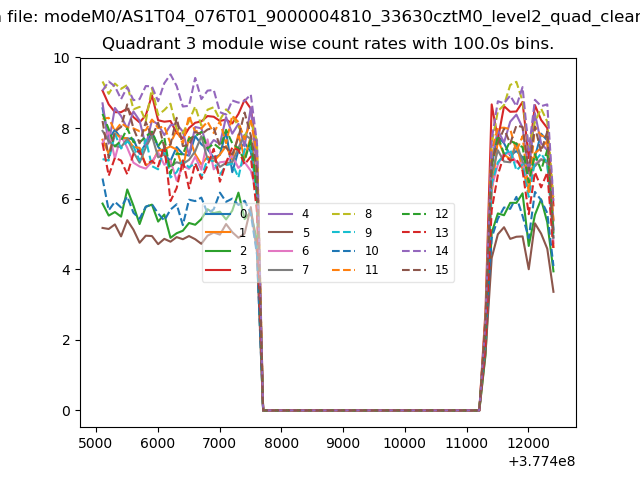
| Module-wise count rates for Quadrant A Data is divided into 100 sec bins |
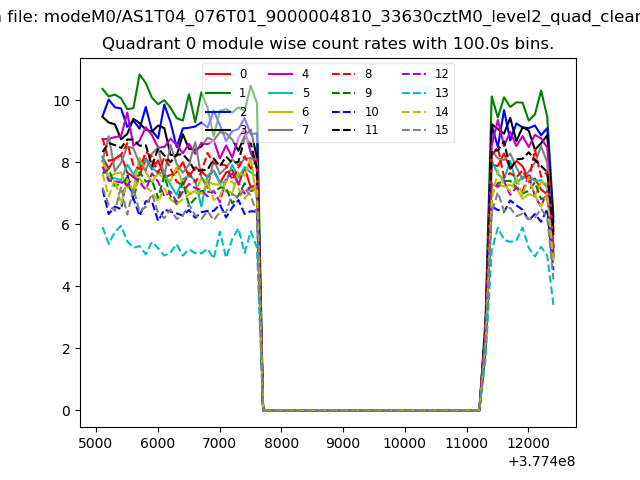 |
 |
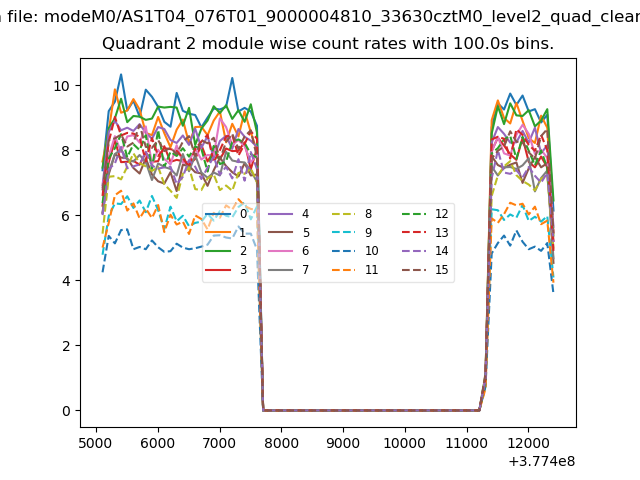
| Module-wise count rates for Quadrant B Data is divided into 100 sec bins |
 |
 |
| Module-wise count rates for Quadrant C Data is divided into 100 sec bins |
 |
 |
| Module-wise count rates for Quadrant D Data is divided into 100 sec bins |
 |
 |
| Parameter | Plot |
|---|---|
| CZT HV Monitor | 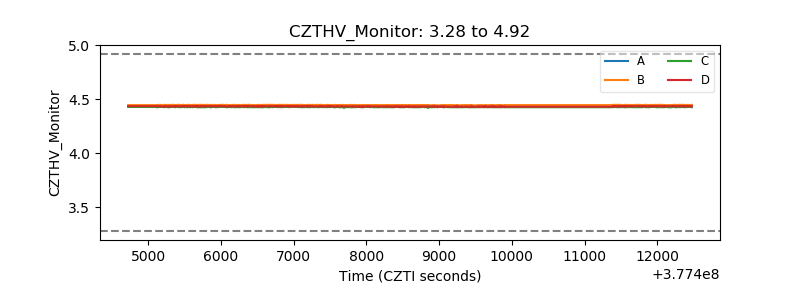 |
| D_VDD | 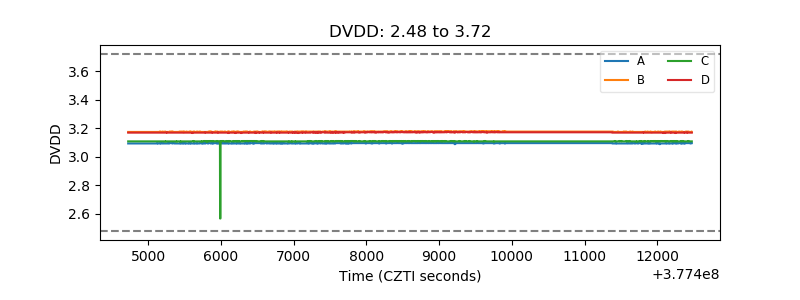 |
| Temperature 1 | 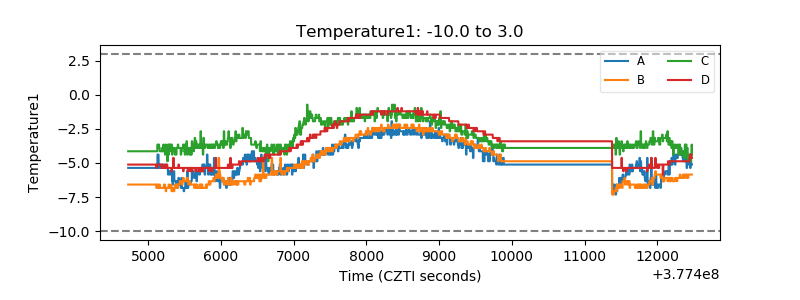 |
| Veto HV Monitor | 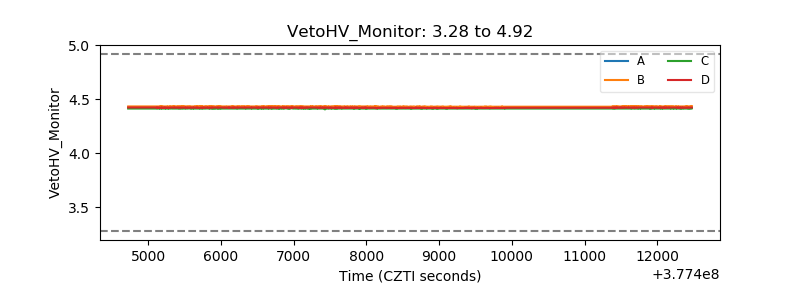 |
| Veto LLD | 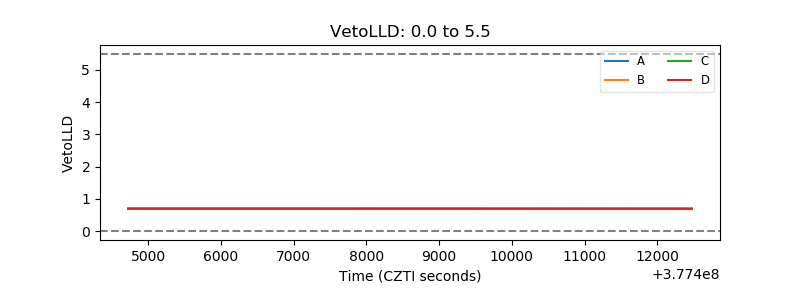 |
| Alpha Counter | 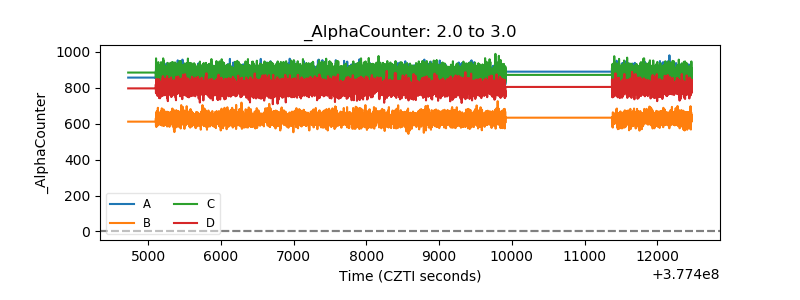 |
| _CPM_Rate | 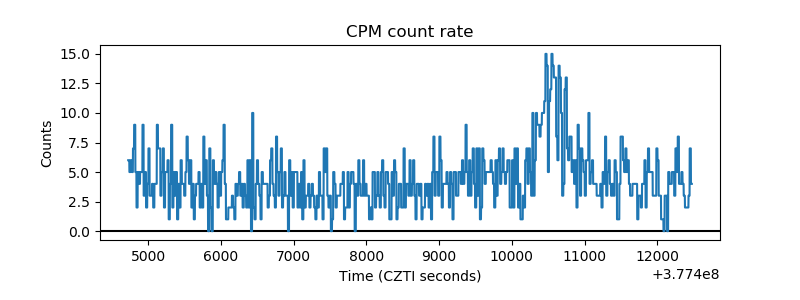 |
| CZT Counter | 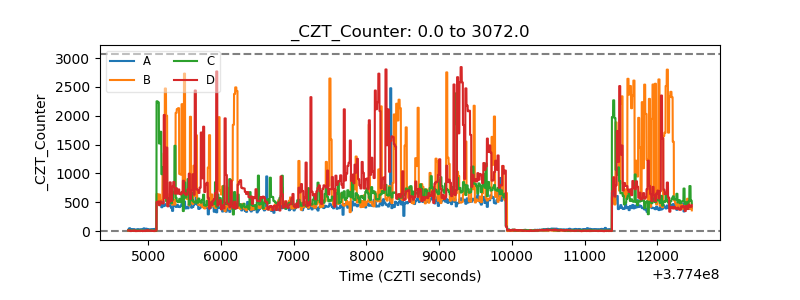 |
| +2.5 Volts monitor |  |
| +5 Volts monitor |  |
| _ROLL_ROT | 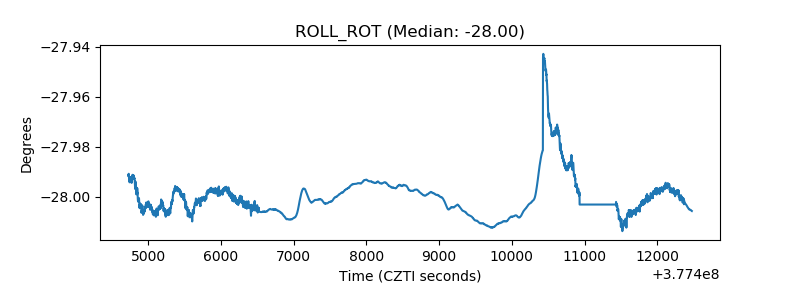 |
| _Roll_DEC | 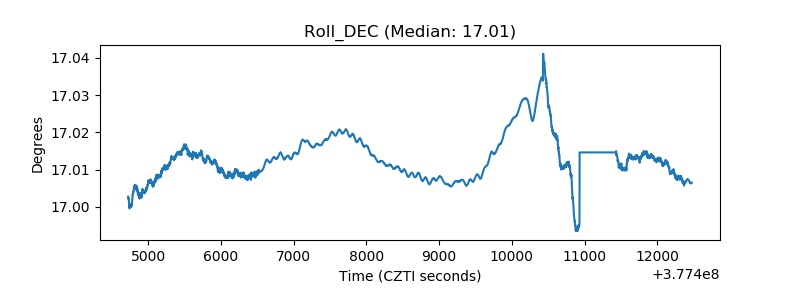 |
| _Roll_RA | 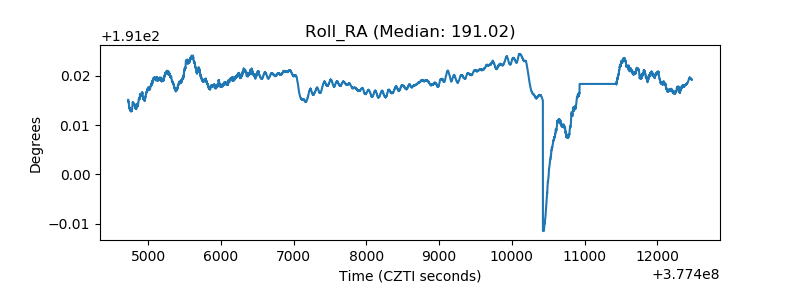 |
| Veto Counter | 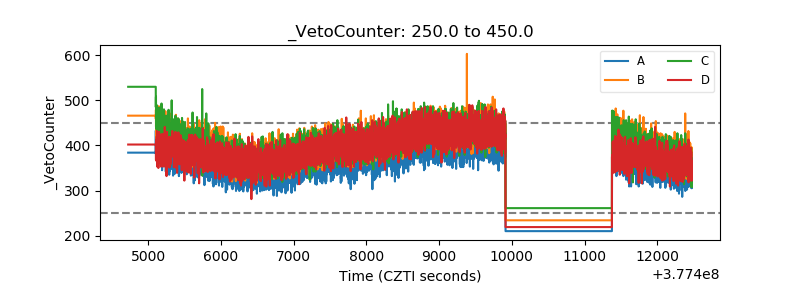 |