| Param | Original file | Final file |
|---|---|---|
| Filename | modeM0/AS1T04_076T01_9000004810_33631cztM0_level2.evt | modeM0/AS1T04_076T01_9000004810_33631cztM0_level2_quad_clean.evt |
| Size (bytes) | 530,038,080 | 71,818,560 |
| Size | 505.5 MB | 68.5 MB |
| Events in quadrant A | 2,900,324 | 451,086 |
| Events in quadrant B | 4,595,743 | 431,161 |
| Events in quadrant C | 3,638,094 | 453,049 |
| Events in quadrant D | 4,513,990 | 422,446 |
| Mode SS | |||
|---|---|---|---|
| Quadrant | BADHDUFLAG | Total packets | Discarded packets |
| A | 0 | 120 | 0 |
| B | 0 | 120 | 0 |
| C | 0 | 120 | 0 |
| D | 0 | 120 | 0 |
| Mode M9 | |||
|---|---|---|---|
| Quadrant | BADHDUFLAG | Total packets | Discarded packets |
| A | 0 | 13 | 0 |
| B | 0 | 13 | 0 |
| C | 0 | 13 | 0 |
| D | 0 | 13 | 0 |
| Mode M0 | |||
|---|---|---|---|
| Quadrant | BADHDUFLAG | Total packets | Discarded packets |
| A | 0 | 12509 | 2 |
| B | 0 | 17613 | 1 |
| C | 0 | 14822 | 1 |
| D | 0 | 17611 | 1 |
| Quadrant | Total seconds | Saturated seconds | Saturation percentage |
|---|---|---|---|
| A | 5968 | 18 | 0.301609% |
| B | 5968 | 574 | 9.617962% |
| C | 5968 | 47 | 0.787534% |
| D | 5968 | 249 | 4.172252% |
Noise dominated data is calculated using 1-second bins in cleaned event files. If a bin has >2000 counts, and if more than 50% of those come from <1% of pixels, then it is considered to be noise-dominated and hence unusable.
| Quadrant | # 1 sec bins | Bins with >0 counts | Bins with >2000 counts | High rate bins dominated by noise | Noise dominated (total time) | Noise dominated (detector-on time) | Marked lightcurve |
|---|---|---|---|---|---|---|---|
| A | 7281 | 5969 | 13 | 13 | 0.18% | 0.22% |  |
| B | 7281 | 5969 | 460 | 460 | 6.32% | 7.71% | 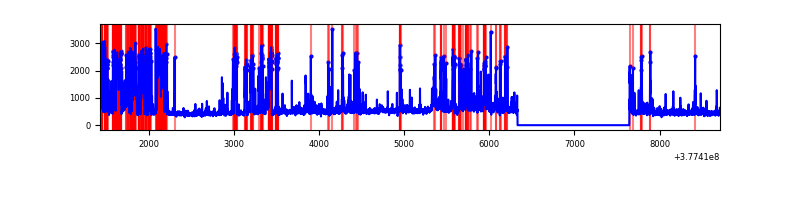 |
| C | 7281 | 5969 | 38 | 38 | 0.52% | 0.64% | 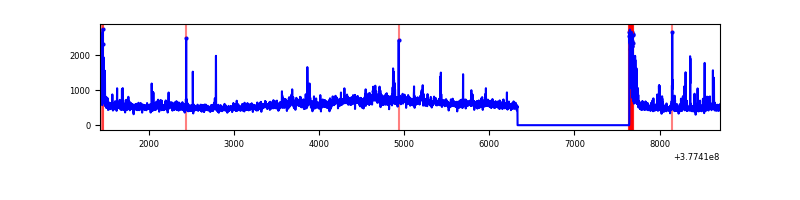 |
| D | 7281 | 5969 | 230 | 230 | 3.16% | 3.85% | 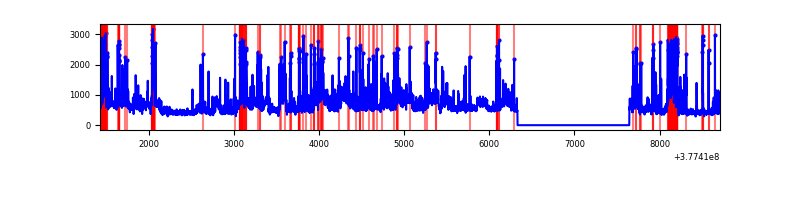 |
Top three noisy pixels from each quadrant. If the there are fewer than three noisy pixels in the level2.evt file, extra rows are filled as -1
| Pixel properties | Quadrant properties | ||||||
|---|---|---|---|---|---|---|---|
| Quadrant | DetID | PixID | Counts | Sigma | Mean | Median | Sigma |
| A | 7 | 16 | 96766 | 679.55 | 695 | 679 | 141.4 |
| A | 15 | 169 | 69754 | 488.52 | 695 | 679 | 141.4 |
| A | 15 | 237 | 21817 | 149.49 | 695 | 679 | 141.4 |
| B | 5 | 172 | 1396774 | 10845.04 | 667 | 651 | 128.7 |
| B | 5 | 255 | 329089 | 2551.3 | 667 | 651 | 128.7 |
| B | 4 | 171 | 52367 | 401.73 | 667 | 651 | 128.7 |
| C | 3 | 233 | 406562 | 2605.11 | 675 | 681 | 155.8 |
| C | 15 | 214 | 273919 | 1753.75 | 675 | 681 | 155.8 |
| C | 0 | 10 | 245498 | 1571.33 | 675 | 681 | 155.8 |
| D | 8 | 195 | 707912 | 4129.16 | 662 | 646 | 171.3 |
| D | 2 | 250 | 516643 | 3012.49 | 662 | 646 | 171.3 |
| D | 13 | 249 | 302352 | 1761.42 | 662 | 646 | 171.3 |
Histogram calculated using DETX and DETY for each event in the final _common_clean file
| Quadrant A | 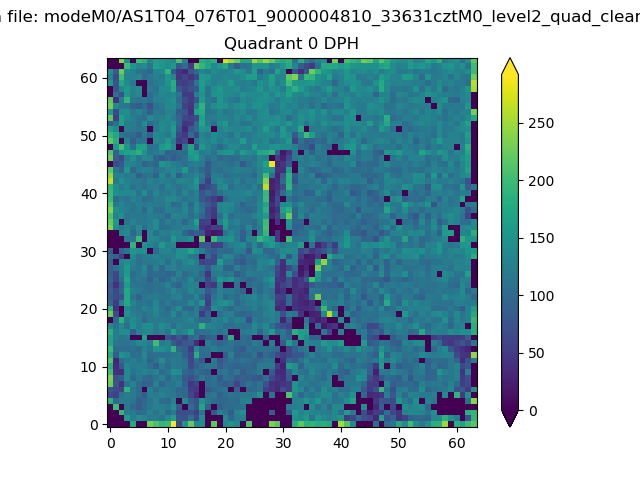 |
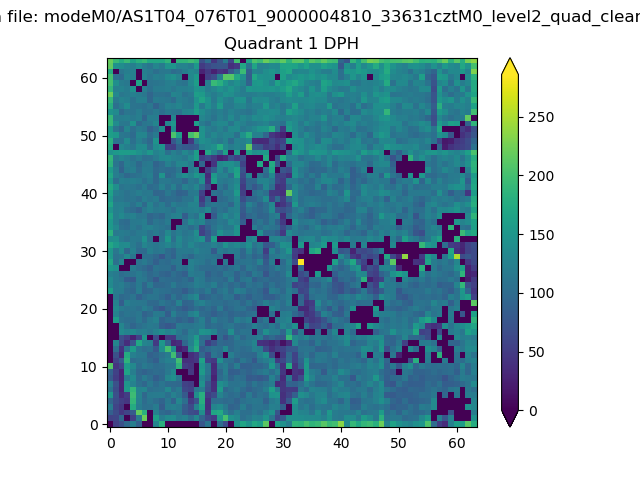 |
Quadrant B |
|---|---|---|---|
| Quadrant D | 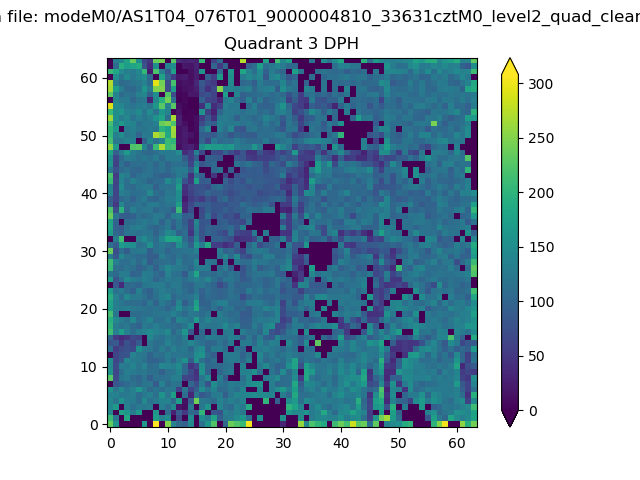 |
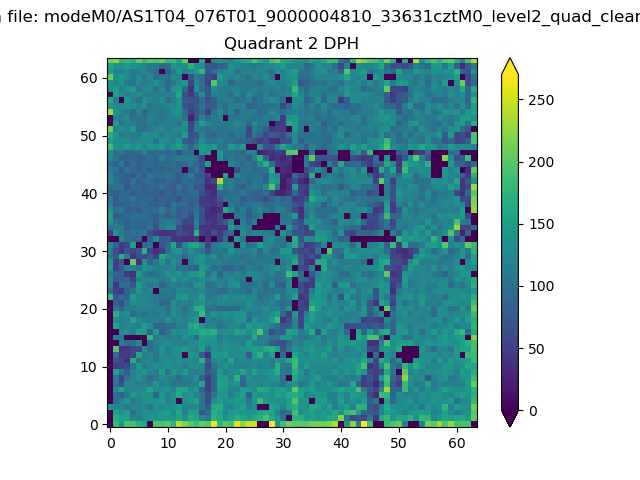 |
Quadrant C |
| Plot type | Count rate plots | Images |
|---|---|---|
| Comparison with Poisson distribution Blue bars denote a histogram of data divided into 1 sec bins. Red curve is a Poisson curve with rate = median count rate of data. |
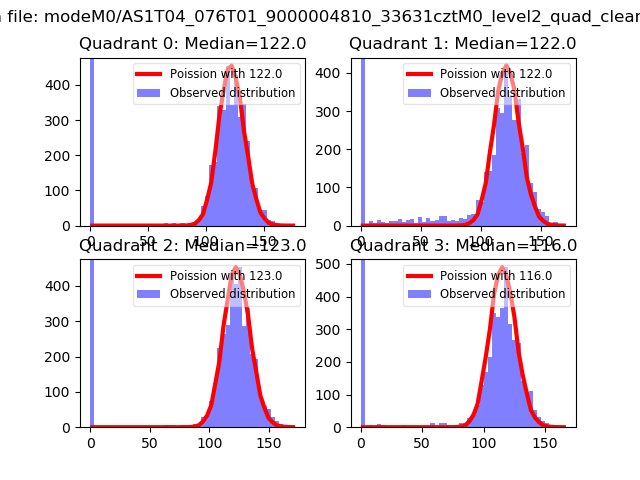 |
 |
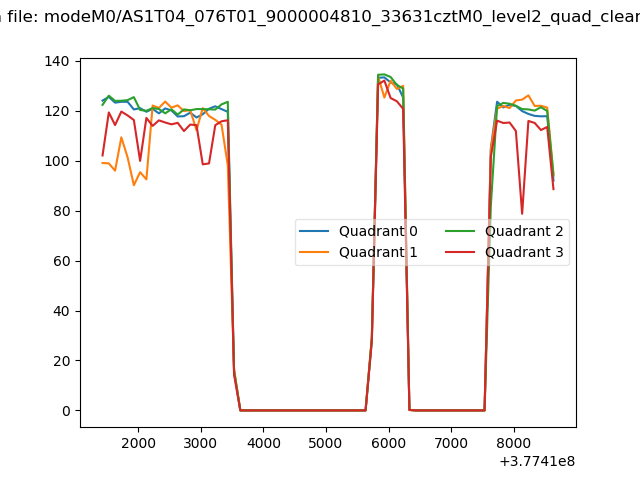
| Quadrant-wise count rates Data is divided into 100 sec bins |
 |
|
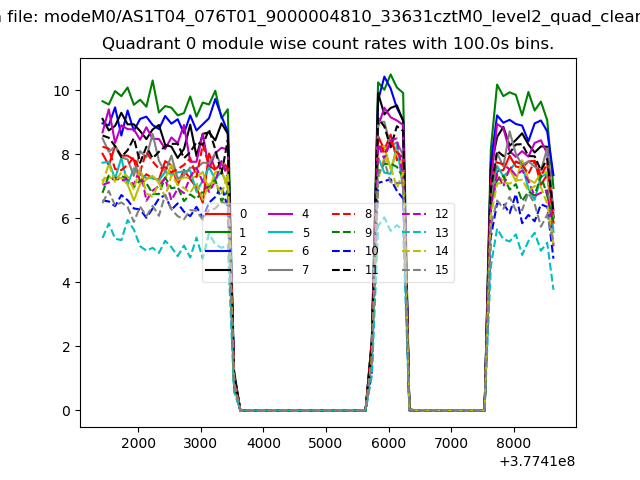
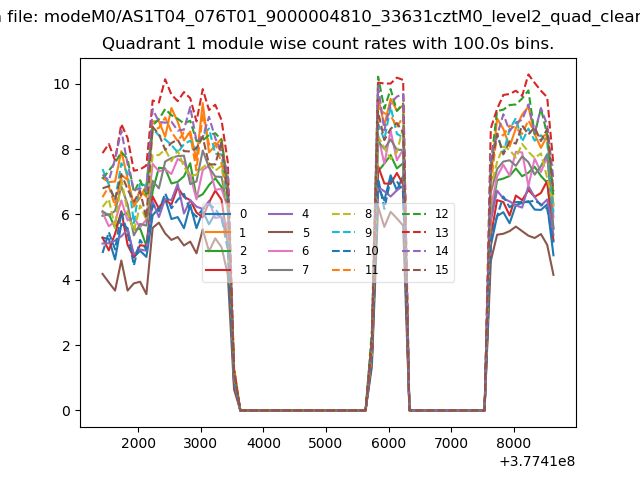
| Module-wise count rates for Quadrant A Data is divided into 100 sec bins |
 |
 |
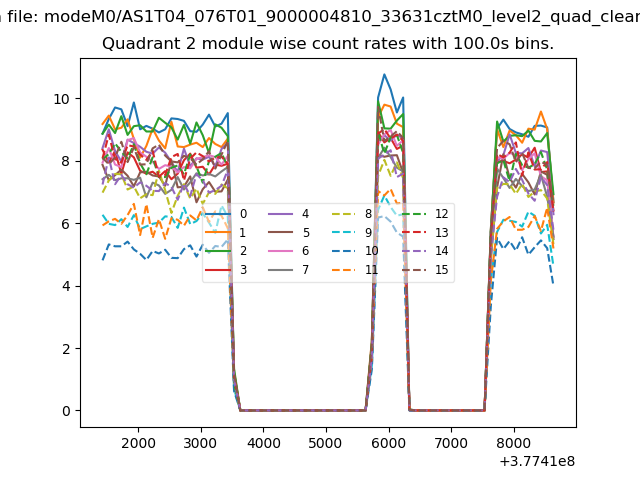
| Module-wise count rates for Quadrant B Data is divided into 100 sec bins |
 |
 |
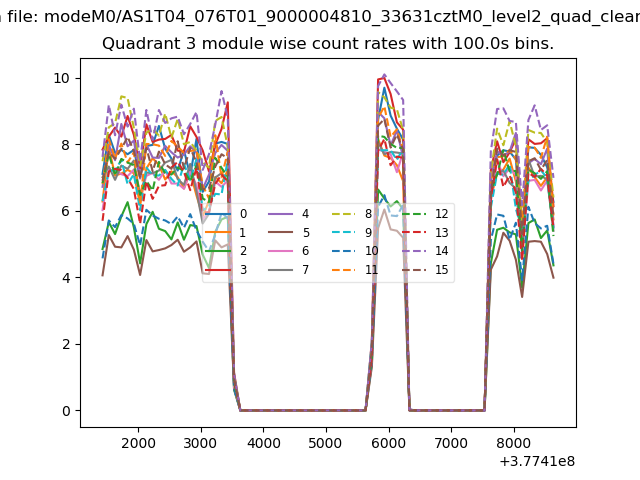
| Module-wise count rates for Quadrant C Data is divided into 100 sec bins |
 |
 |
| Module-wise count rates for Quadrant D Data is divided into 100 sec bins |
 |
 |
| Parameter | Plot |
|---|---|
| CZT HV Monitor | 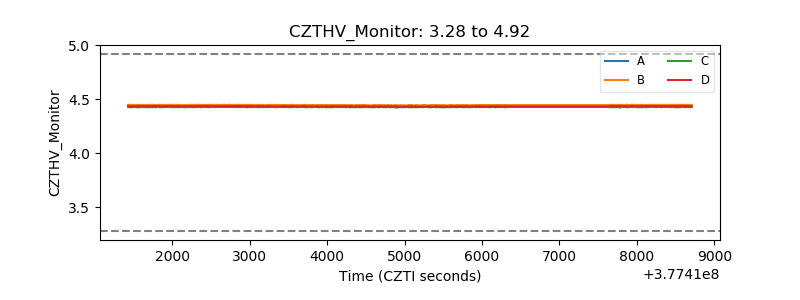 |
| D_VDD | 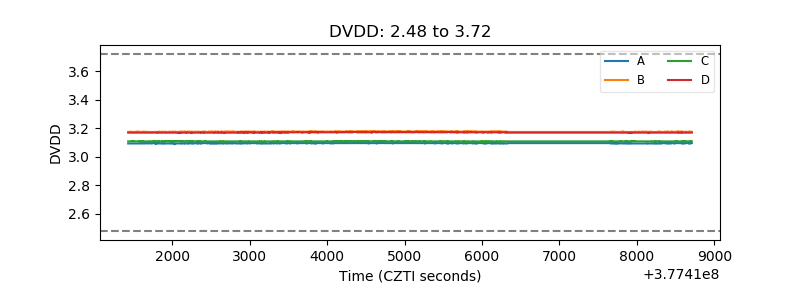 |
| Temperature 1 | 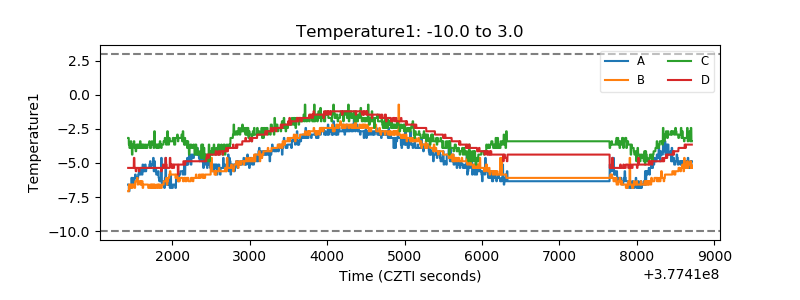 |
| Veto HV Monitor |  |
| Veto LLD | 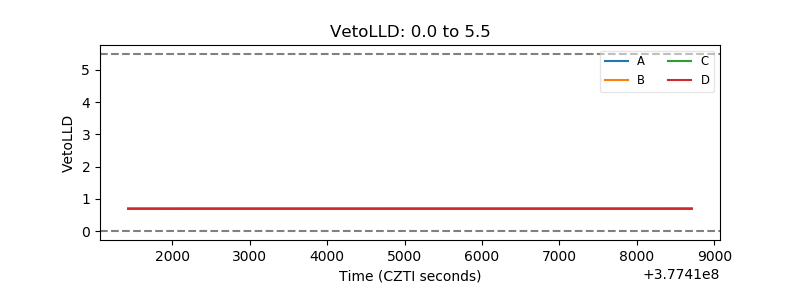 |
| Alpha Counter | 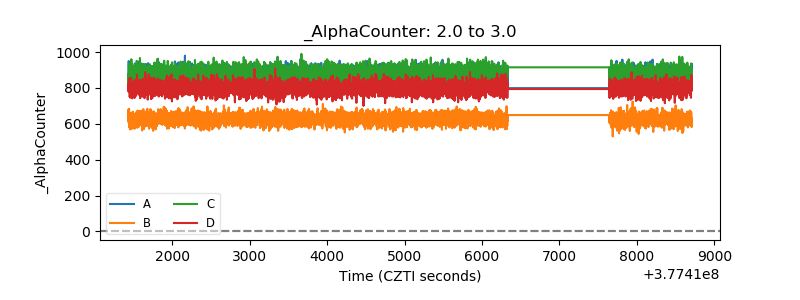 |
| _CPM_Rate | 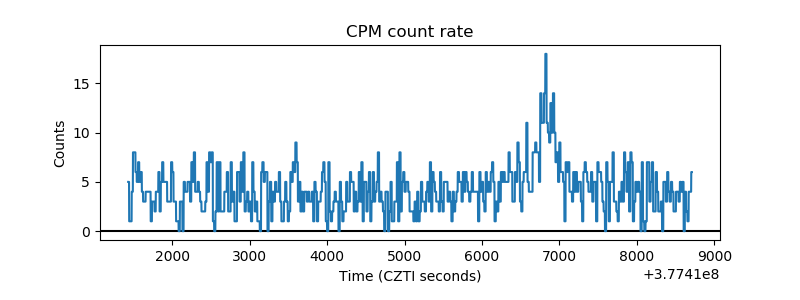 |
| CZT Counter | 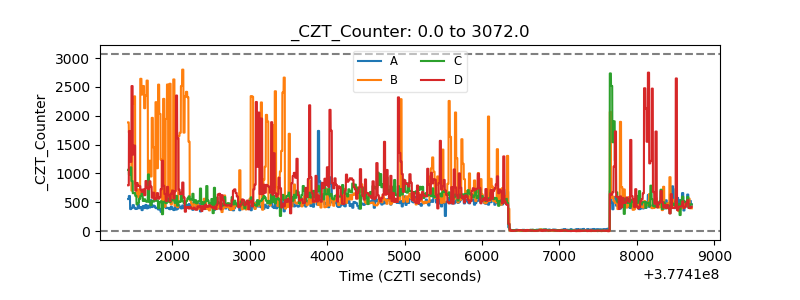 |
| +2.5 Volts monitor |  |
| +5 Volts monitor |  |
| _ROLL_ROT | 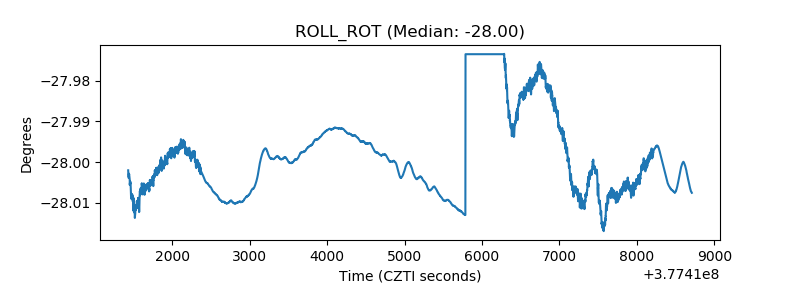 |
| _Roll_DEC | 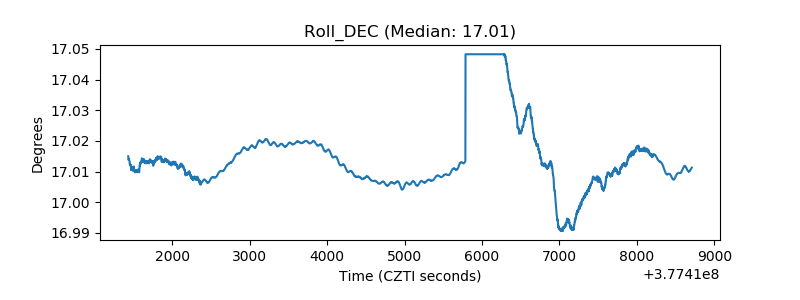 |
| _Roll_RA | 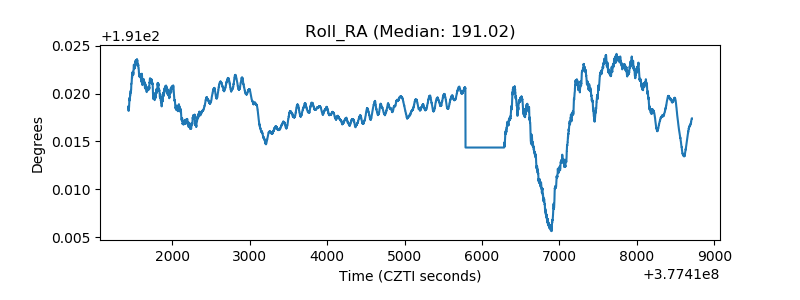 |
| Veto Counter | 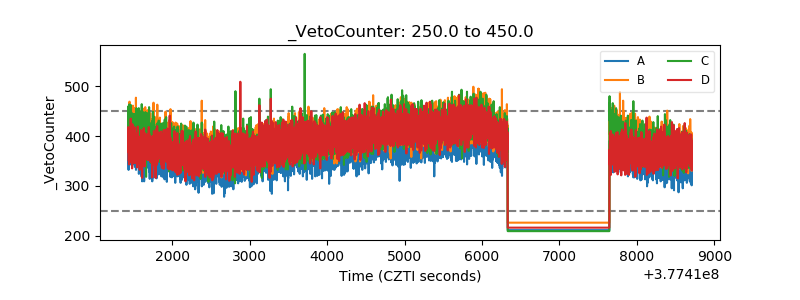 |