| Param | Original file | Final file |
|---|---|---|
| Filename | modeM0/AS1T04_076T01_9000004810_33632cztM0_level2.evt | modeM0/AS1T04_076T01_9000004810_33632cztM0_level2_quad_clean.evt |
| Size (bytes) | 560,456,640 | 74,018,880 |
| Size | 534.5 MB | 70.6 MB |
| Events in quadrant A | 3,035,388 | 461,959 |
| Events in quadrant B | 3,864,826 | 464,799 |
| Events in quadrant C | 3,925,436 | 460,371 |
| Events in quadrant D | 5,739,676 | 432,799 |
| Mode SS | |||
|---|---|---|---|
| Quadrant | BADHDUFLAG | Total packets | Discarded packets |
| A | 0 | 126 | 0 |
| B | 0 | 126 | 0 |
| C | 0 | 126 | 0 |
| D | 0 | 126 | 0 |
| Mode M9 | |||
|---|---|---|---|
| Quadrant | BADHDUFLAG | Total packets | Discarded packets |
| A | 0 | 26 | 0 |
| B | 0 | 26 | 0 |
| C | 0 | 26 | 0 |
| D | 0 | 26 | 0 |
| Mode M0 | |||
|---|---|---|---|
| Quadrant | BADHDUFLAG | Total packets | Discarded packets |
| A | 0 | 12732 | 3 |
| B | 0 | 15338 | 2 |
| C | 0 | 15697 | 2 |
| D | 0 | 21343 | 2 |
| Quadrant | Total seconds | Saturated seconds | Saturation percentage |
|---|---|---|---|
| A | 6025 | 25 | 0.414938% |
| B | 6025 | 294 | 4.879668% |
| C | 6025 | 87 | 1.443983% |
| D | 6025 | 630 | 10.456432% |
Noise dominated data is calculated using 1-second bins in cleaned event files. If a bin has >2000 counts, and if more than 50% of those come from <1% of pixels, then it is considered to be noise-dominated and hence unusable.
| Quadrant | # 1 sec bins | Bins with >0 counts | Bins with >2000 counts | High rate bins dominated by noise | Noise dominated (total time) | Noise dominated (detector-on time) | Marked lightcurve |
|---|---|---|---|---|---|---|---|
| A | 8650 | 6027 | 19 | 19 | 0.22% | 0.32% | 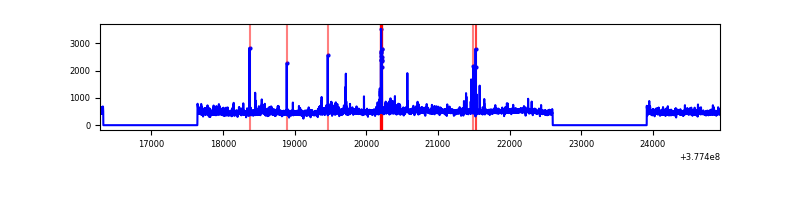 |
| B | 8650 | 6027 | 225 | 225 | 2.60% | 3.73% |  |
| C | 8650 | 6027 | 76 | 76 | 0.88% | 1.26% | 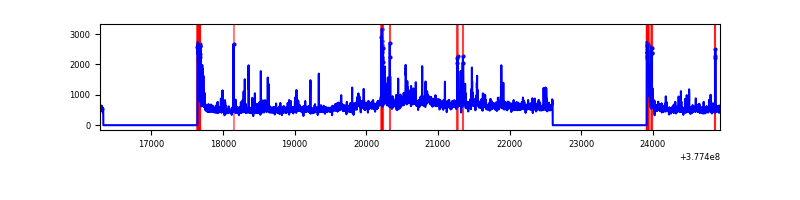 |
| D | 8650 | 6027 | 582 | 582 | 6.73% | 9.66% | 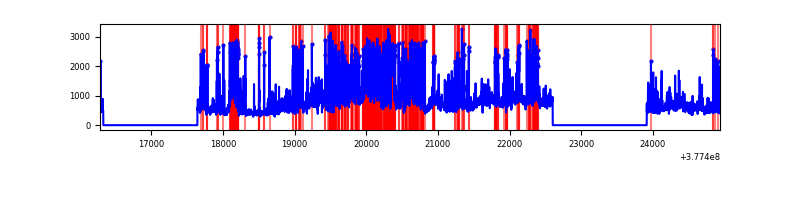 |
Top three noisy pixels from each quadrant. If the there are fewer than three noisy pixels in the level2.evt file, extra rows are filled as -1
| Pixel properties | Quadrant properties | ||||||
|---|---|---|---|---|---|---|---|
| Quadrant | DetID | PixID | Counts | Sigma | Mean | Median | Sigma |
| A | 15 | 169 | 175904 | 1232.36 | 705 | 691 | 142.2 |
| A | 15 | 237 | 72590 | 505.7 | 705 | 691 | 142.2 |
| A | 7 | 16 | 28409 | 194.95 | 705 | 691 | 142.2 |
| B | 5 | 172 | 906203 | 6762.7 | 693 | 674 | 133.9 |
| B | 0 | 213 | 40172 | 294.98 | 693 | 674 | 133.9 |
| B | 0 | 190 | 37062 | 271.75 | 693 | 674 | 133.9 |
| C | 3 | 233 | 670552 | 4194.25 | 685 | 689 | 159.7 |
| C | 15 | 214 | 279192 | 1743.81 | 685 | 689 | 159.7 |
| C | 0 | 10 | 226182 | 1411.89 | 685 | 689 | 159.7 |
| D | 7 | 223 | 1143594 | 6611.89 | 661 | 645 | 172.9 |
| D | 8 | 195 | 854200 | 4937.77 | 661 | 645 | 172.9 |
| D | 2 | 250 | 569478 | 3290.67 | 661 | 645 | 172.9 |
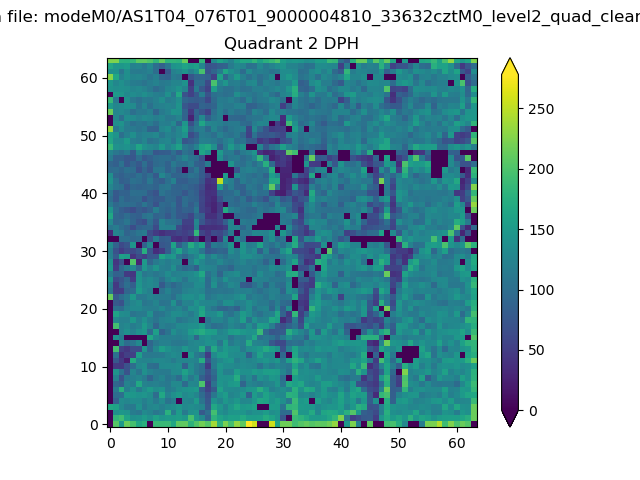
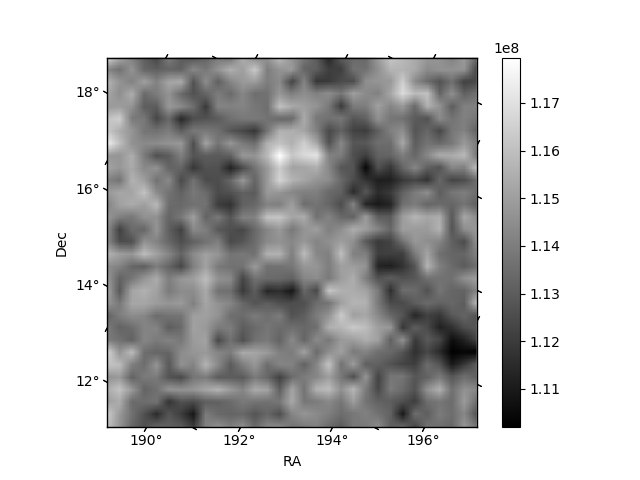
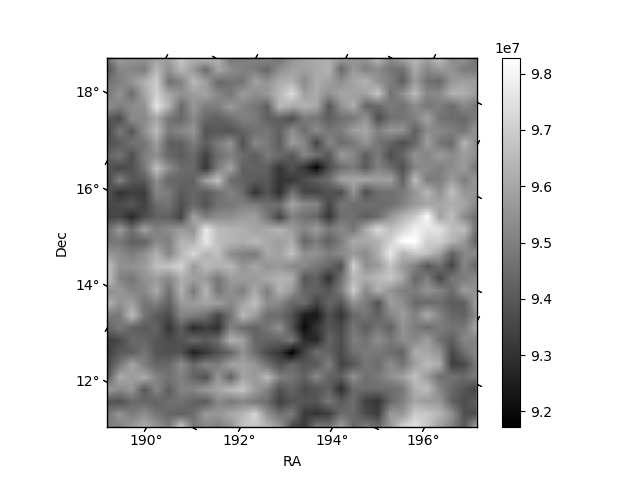
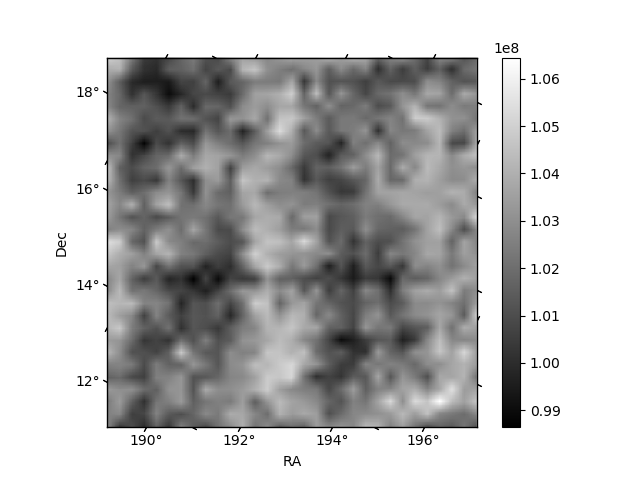
Histogram calculated using DETX and DETY for each event in the final _common_clean file
| Quadrant A | 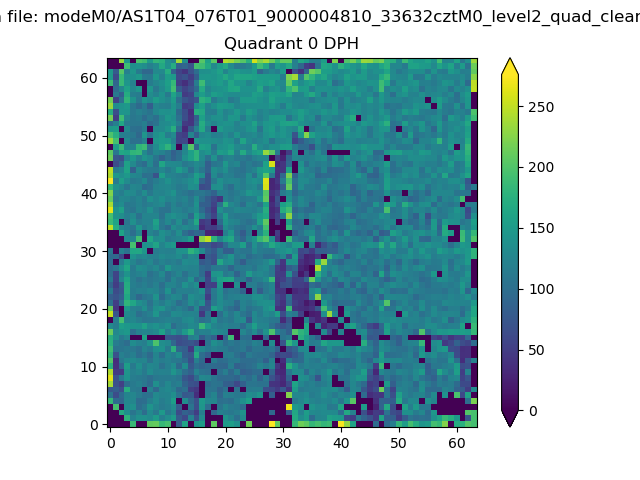 |
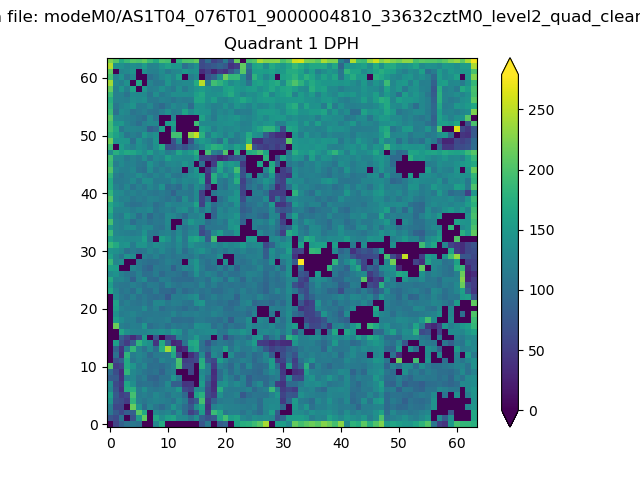 |
Quadrant B |
|---|---|---|---|
| Quadrant D | 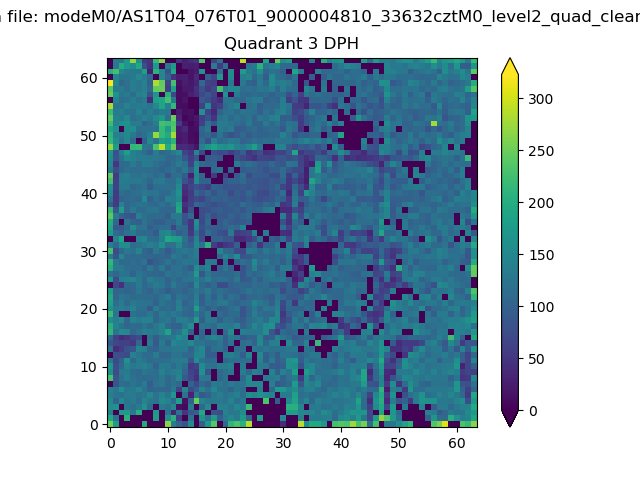 |
 |
Quadrant C |
| Plot type | Count rate plots | Images |
|---|---|---|
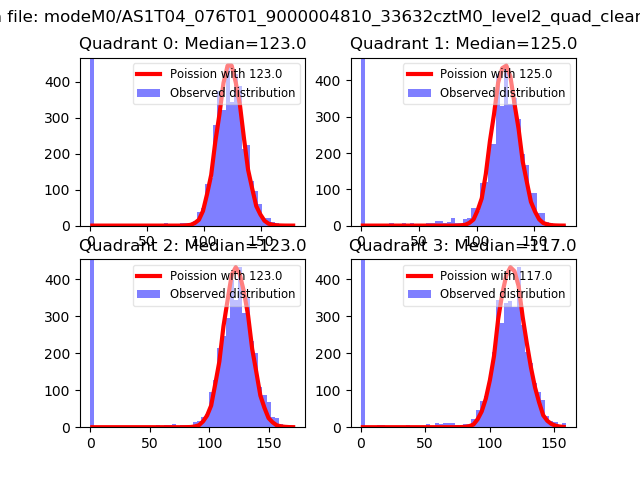
| Comparison with Poisson distribution Blue bars denote a histogram of data divided into 1 sec bins. Red curve is a Poisson curve with rate = median count rate of data. |
 |
 |
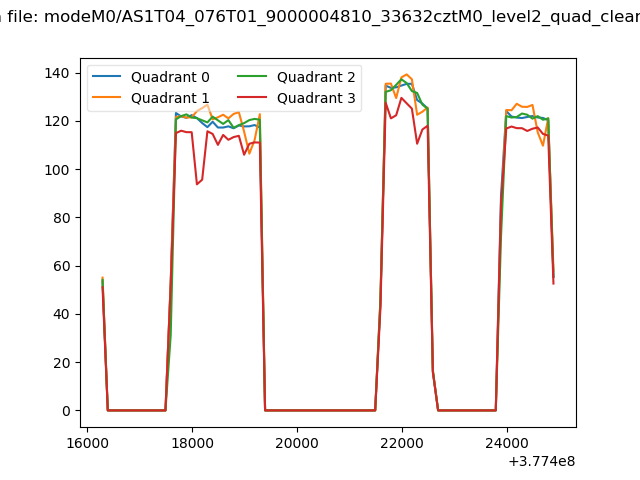
| Quadrant-wise count rates Data is divided into 100 sec bins |
 |
|
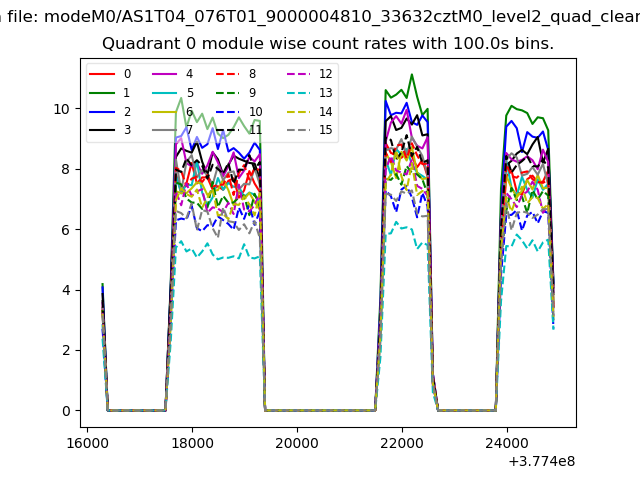
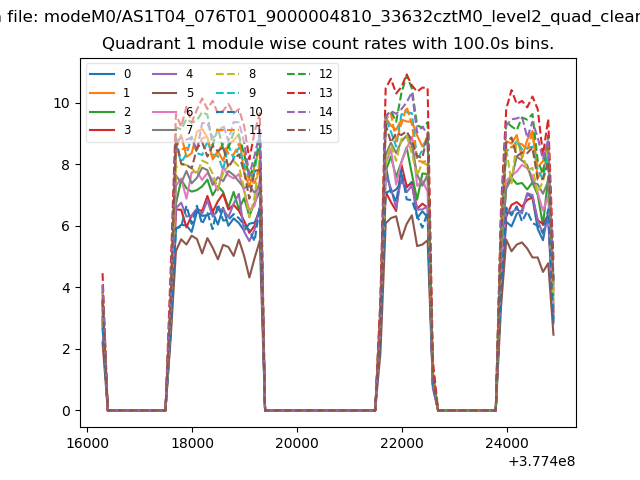
| Module-wise count rates for Quadrant A Data is divided into 100 sec bins |
 |
 |
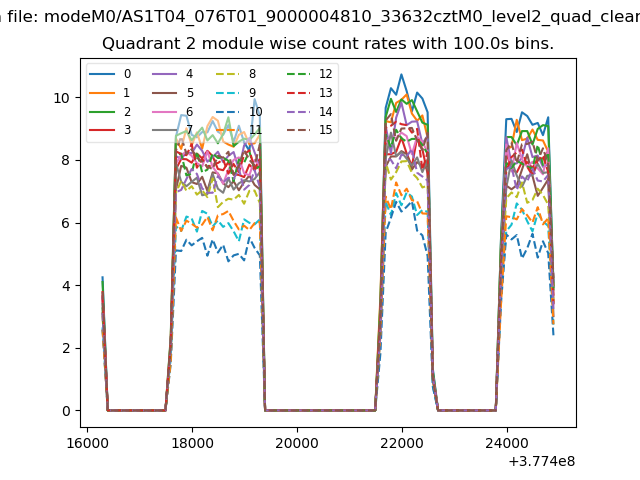
| Module-wise count rates for Quadrant B Data is divided into 100 sec bins |
 |
 |
| Module-wise count rates for Quadrant C Data is divided into 100 sec bins |
 |
 |
| Module-wise count rates for Quadrant D Data is divided into 100 sec bins |
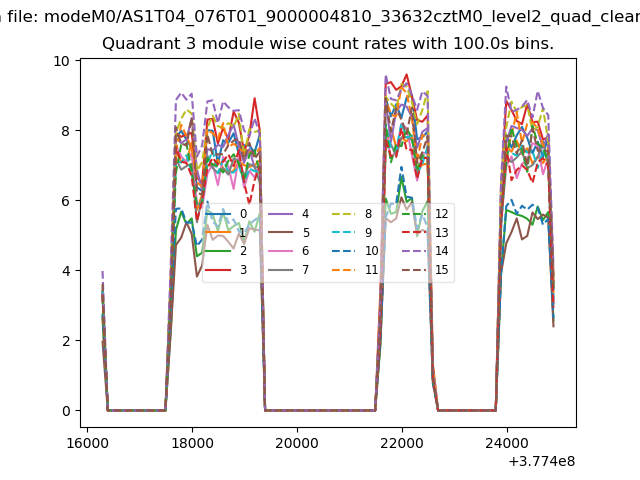 |
 |
| Parameter | Plot |
|---|---|
| CZT HV Monitor | 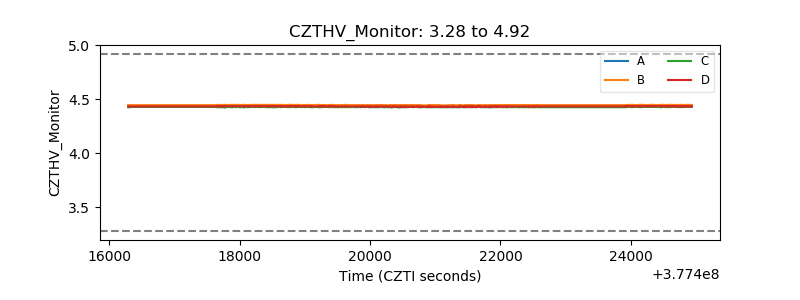 |
| D_VDD | 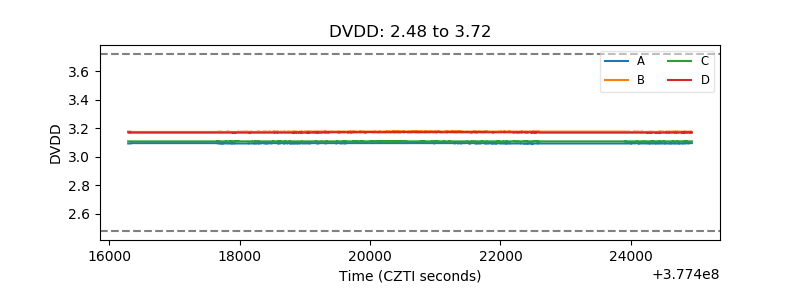 |
| Temperature 1 |  |
| Veto HV Monitor |  |
| Veto LLD | 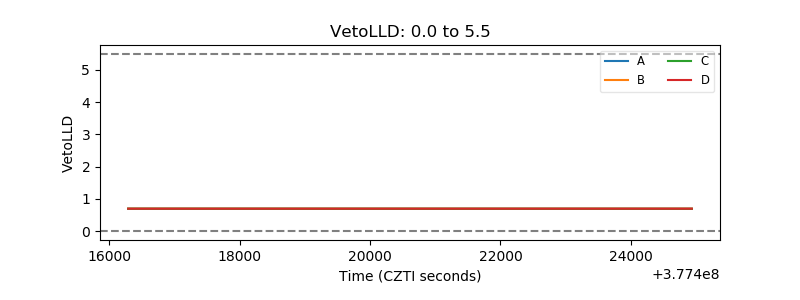 |
| Alpha Counter | 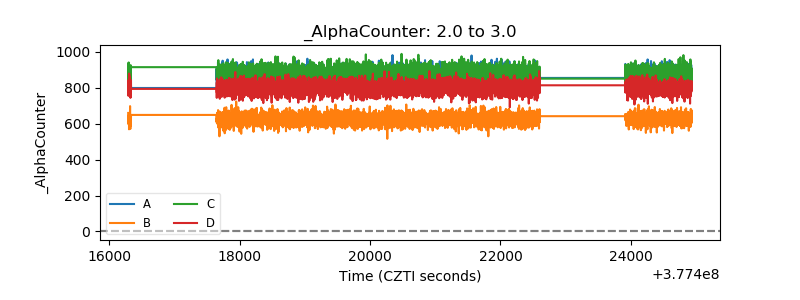 |
| _CPM_Rate | 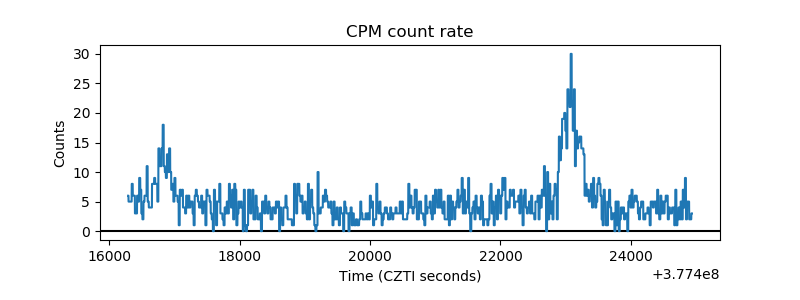 |
| CZT Counter | 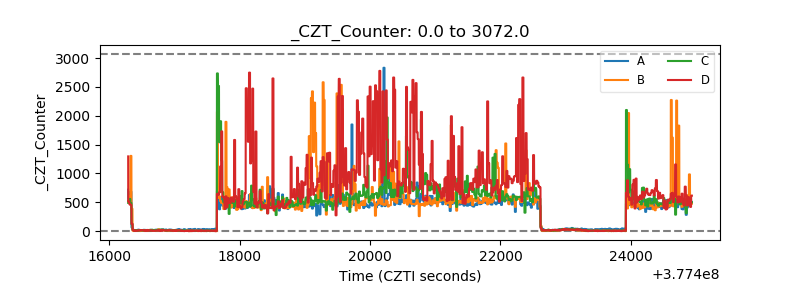 |
| +2.5 Volts monitor |  |
| +5 Volts monitor |  |
| _ROLL_ROT | 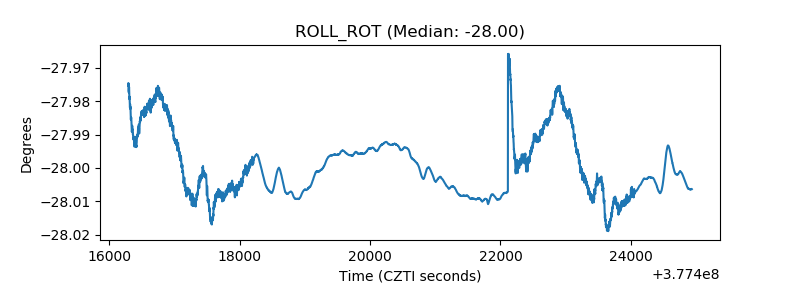 |
| _Roll_DEC | 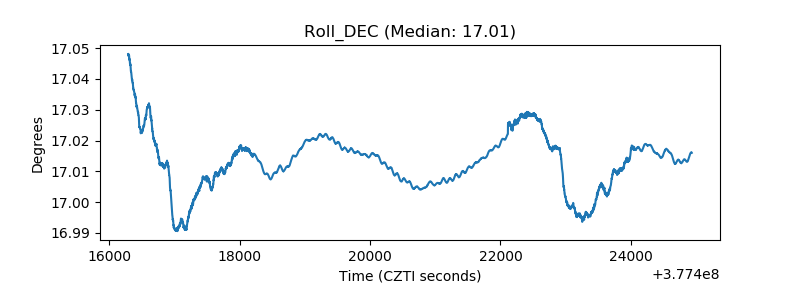 |
| _Roll_RA | 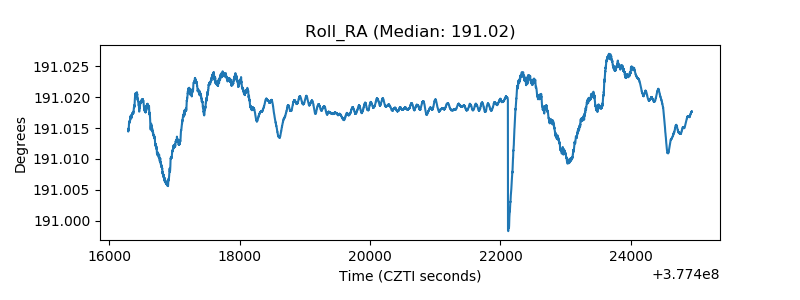 |
| Veto Counter | 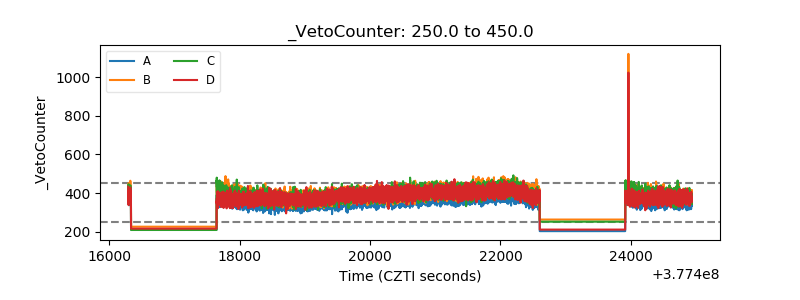 |