| Param | Original file | Final file |
|---|---|---|
| Filename | modeM0/AS1T04_076T01_9000004810_33634cztM0_level2.evt | modeM0/AS1T04_076T01_9000004810_33634cztM0_level2_quad_clean.evt |
| Size (bytes) | 943,856,640 | 116,579,520 |
| Size | 900.1 MB | 111.2 MB |
| Events in quadrant A | 5,346,361 | 712,571 |
| Events in quadrant B | 7,390,405 | 699,921 |
| Events in quadrant C | 7,087,693 | 707,288 |
| Events in quadrant D | 8,042,839 | 674,294 |
| Mode SS | |||
|---|---|---|---|
| Quadrant | BADHDUFLAG | Total packets | Discarded packets |
| A | 0 | 216 | 0 |
| B | 0 | 216 | 0 |
| C | 0 | 216 | 0 |
| D | 0 | 216 | 0 |
| Mode M9 | |||
|---|---|---|---|
| Quadrant | BADHDUFLAG | Total packets | Discarded packets |
| A | 0 | 37 | 0 |
| B | 0 | 37 | 0 |
| C | 0 | 37 | 0 |
| D | 0 | 38 | 0 |
| Mode M0 | |||
|---|---|---|---|
| Quadrant | BADHDUFLAG | Total packets | Discarded packets |
| A | 0 | 22416 | 4 |
| B | 0 | 28637 | 3 |
| C | 0 | 27989 | 3 |
| D | 0 | 31657 | 3 |
| Quadrant | Total seconds | Saturated seconds | Saturation percentage |
|---|---|---|---|
| A | 10634 | 91 | 0.855746% |
| B | 10634 | 752 | 7.071657% |
| C | 10634 | 184 | 1.730299% |
| D | 10634 | 306 | 2.877563% |
Noise dominated data is calculated using 1-second bins in cleaned event files. If a bin has >2000 counts, and if more than 50% of those come from <1% of pixels, then it is considered to be noise-dominated and hence unusable.
| Quadrant | # 1 sec bins | Bins with >0 counts | Bins with >2000 counts | High rate bins dominated by noise | Noise dominated (total time) | Noise dominated (detector-on time) | Marked lightcurve |
|---|---|---|---|---|---|---|---|
| A | 13470 | 10636 | 80 | 80 | 0.59% | 0.75% | 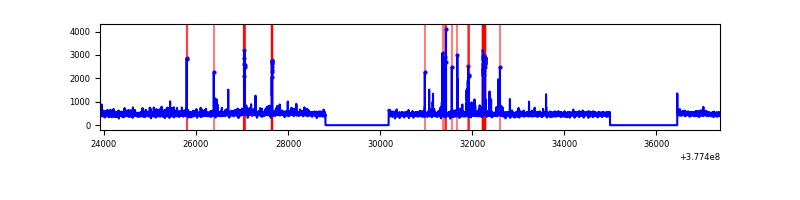 |
| B | 13470 | 10636 | 583 | 583 | 4.33% | 5.48% | 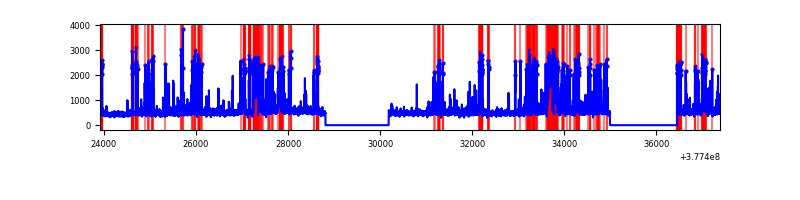 |
| C | 13470 | 10636 | 156 | 156 | 1.16% | 1.47% | 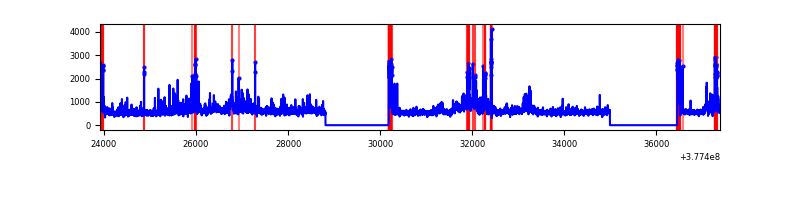 |
| D | 13470 | 10636 | 269 | 269 | 2.00% | 2.53% | 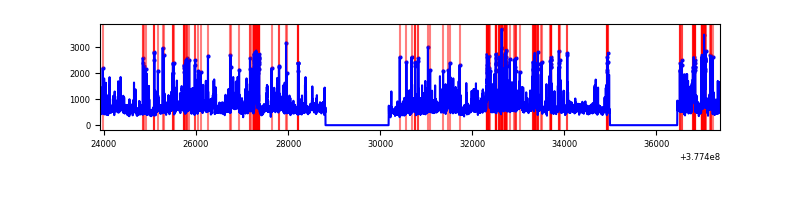 |
Top three noisy pixels from each quadrant. If the there are fewer than three noisy pixels in the level2.evt file, extra rows are filled as -1
| Pixel properties | Quadrant properties | ||||||
|---|---|---|---|---|---|---|---|
| Quadrant | DetID | PixID | Counts | Sigma | Mean | Median | Sigma |
| A | 15 | 237 | 259894 | 1026.82 | 1258 | 1234 | 251.9 |
| A | 15 | 169 | 139554 | 549.1 | 1258 | 1234 | 251.9 |
| A | 9 | 143 | 64294 | 250.33 | 1258 | 1234 | 251.9 |
| B | 5 | 172 | 1615395 | 6806.88 | 1227 | 1195 | 237.1 |
| B | 5 | 200 | 231082 | 969.41 | 1227 | 1195 | 237.1 |
| B | 0 | 182 | 230503 | 966.96 | 1227 | 1195 | 237.1 |
| C | 3 | 233 | 1232609 | 4333.79 | 1223 | 1232 | 284.1 |
| C | 15 | 214 | 491727 | 1726.28 | 1223 | 1232 | 284.1 |
| C | 0 | 10 | 349431 | 1225.47 | 1223 | 1232 | 284.1 |
| D | 8 | 195 | 1245342 | 3907.13 | 1214 | 1183 | 318.4 |
| D | 7 | 223 | 486473 | 1524.0 | 1214 | 1183 | 318.4 |
| D | 13 | 249 | 329801 | 1031.99 | 1214 | 1183 | 318.4 |
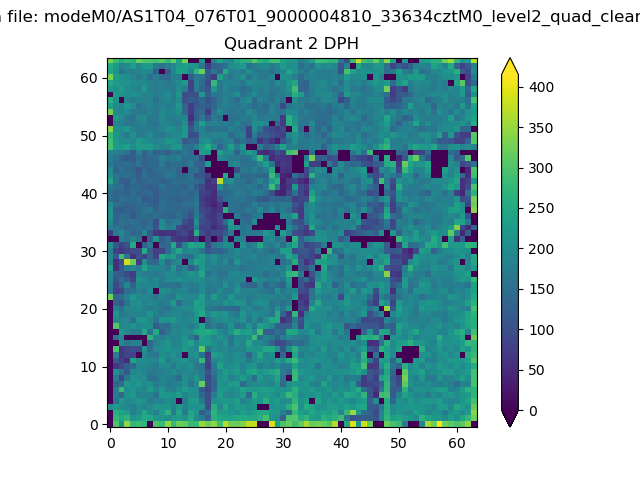
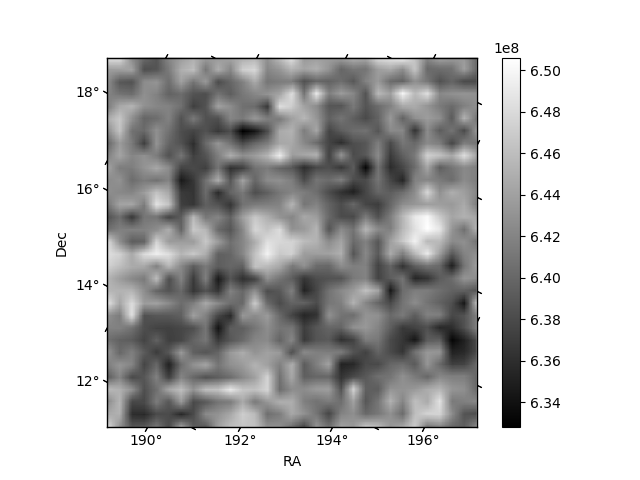
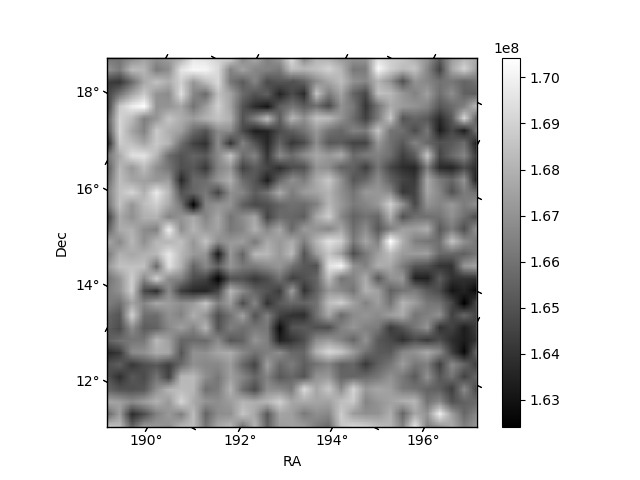
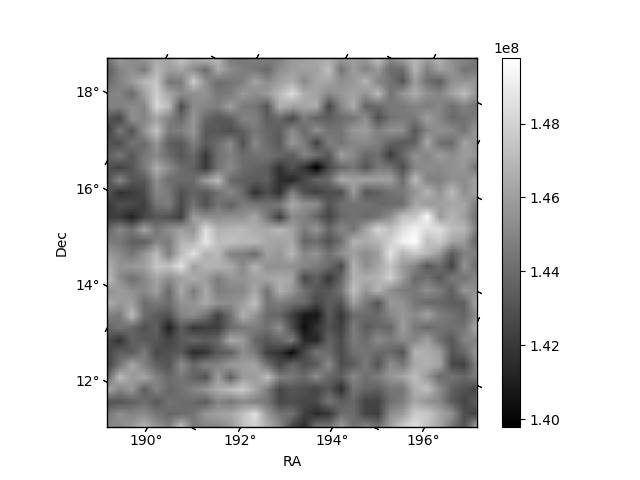
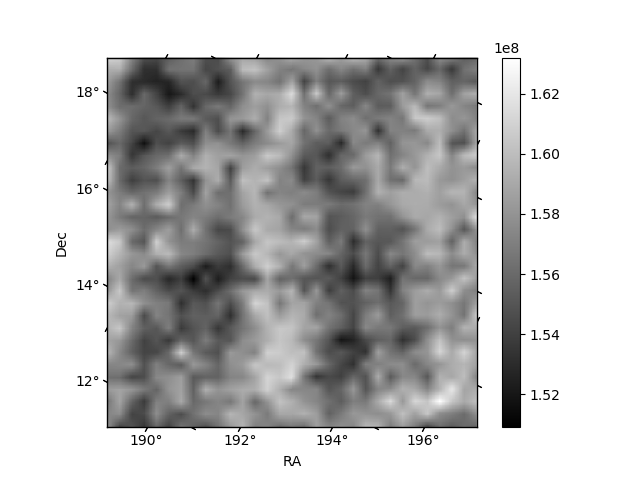
Histogram calculated using DETX and DETY for each event in the final _common_clean file
| Quadrant A | 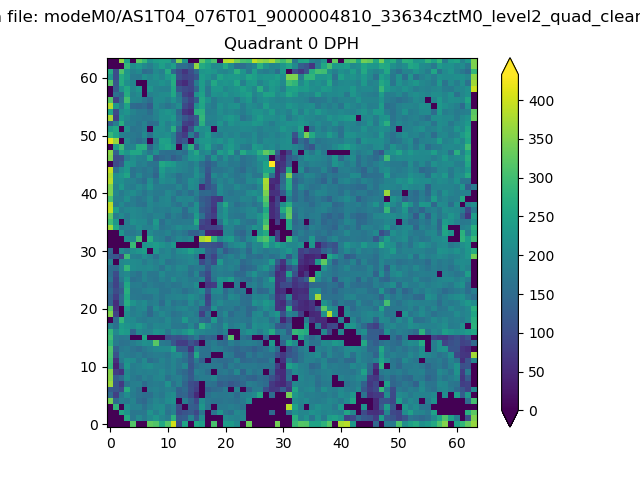 |
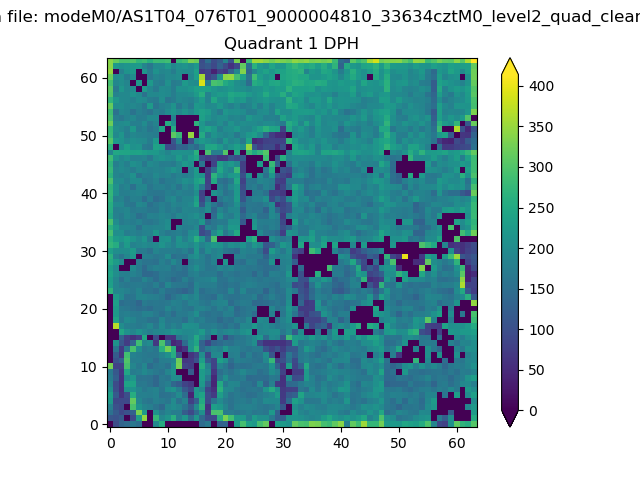 |
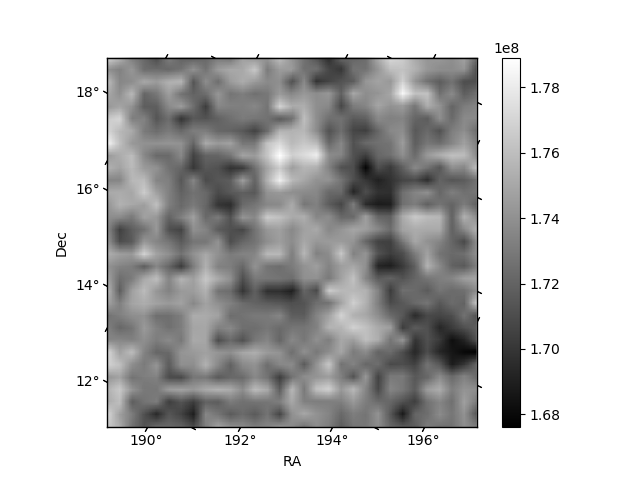
Quadrant B |
|---|---|---|---|
| Quadrant D | 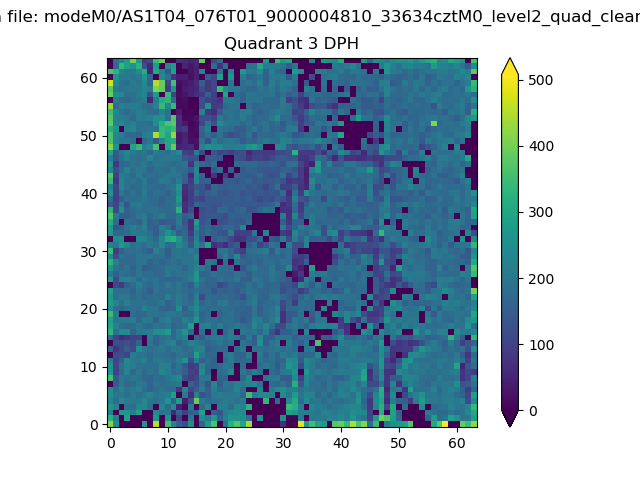 |
 |
Quadrant C |
| Plot type | Count rate plots | Images |
|---|---|---|
| Comparison with Poisson distribution Blue bars denote a histogram of data divided into 1 sec bins. Red curve is a Poisson curve with rate = median count rate of data. |
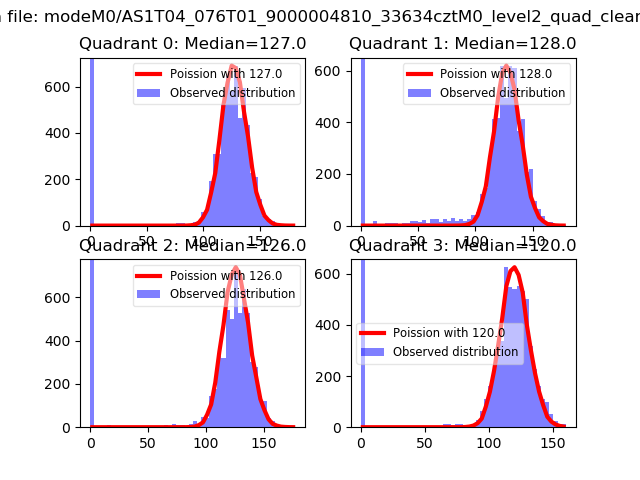 |
 |
| Quadrant-wise count rates Data is divided into 100 sec bins |
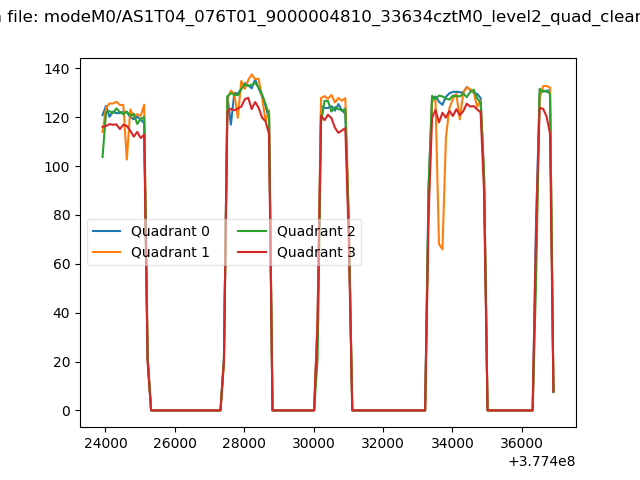 |
|
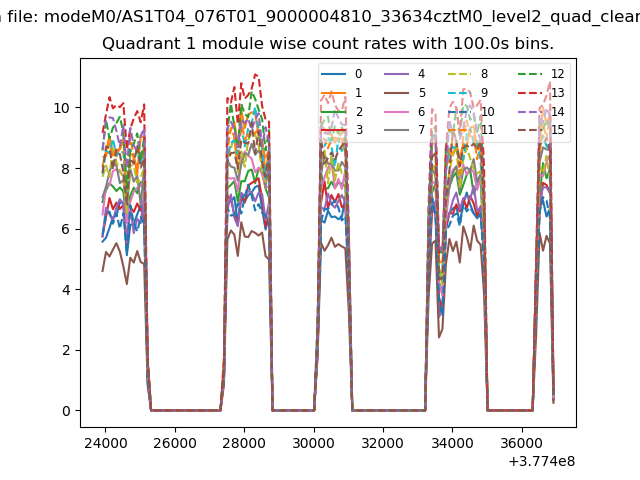
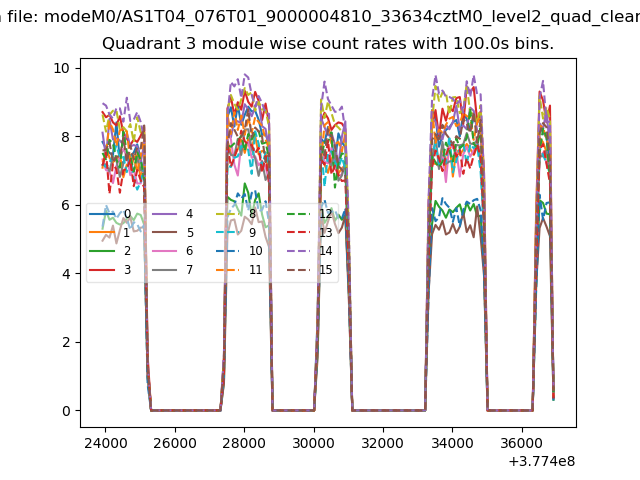
| Module-wise count rates for Quadrant A Data is divided into 100 sec bins |
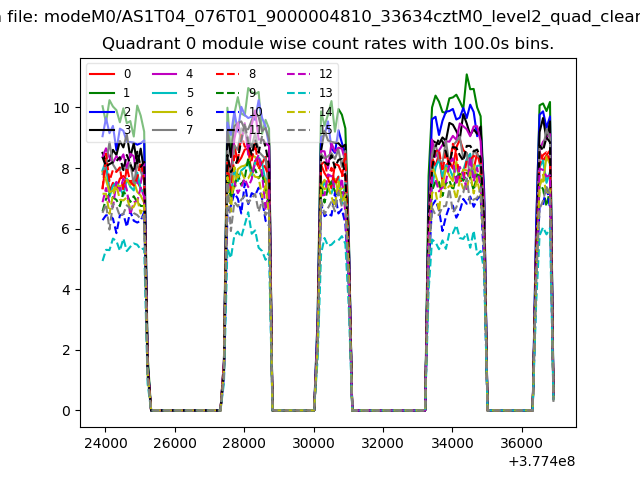 |
 |
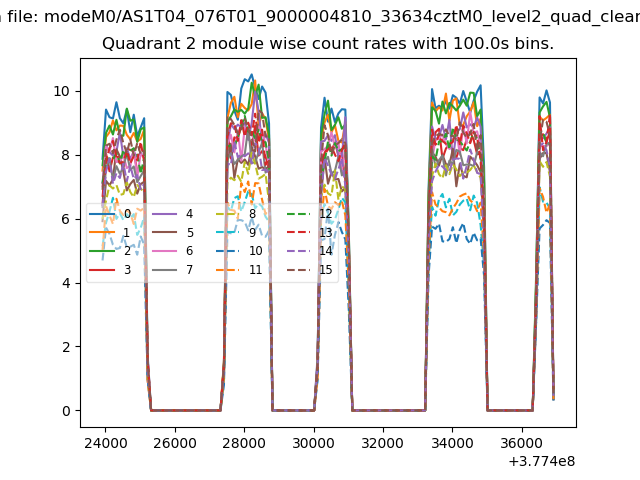
| Module-wise count rates for Quadrant B Data is divided into 100 sec bins |
 |
 |
| Module-wise count rates for Quadrant C Data is divided into 100 sec bins |
 |
 |
| Module-wise count rates for Quadrant D Data is divided into 100 sec bins |
 |
 |
| Parameter | Plot |
|---|---|
| CZT HV Monitor | 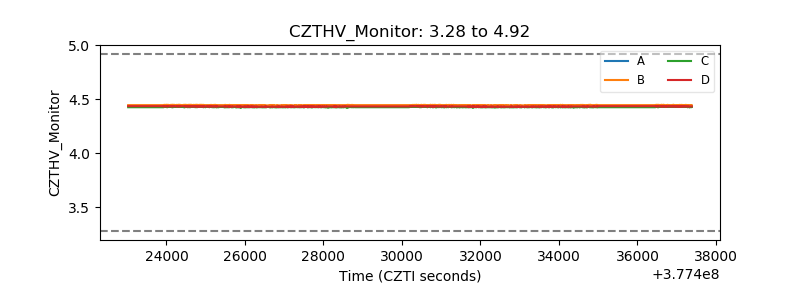 |
| D_VDD | 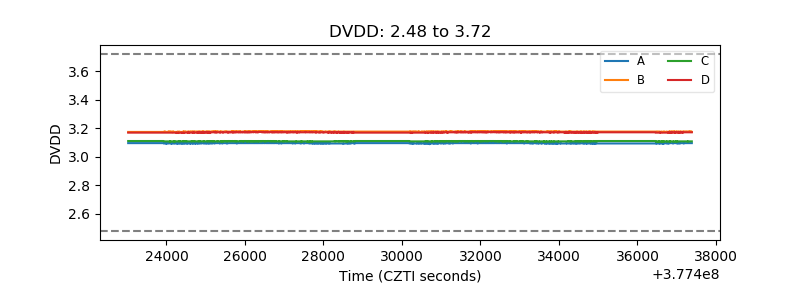 |
| Temperature 1 | 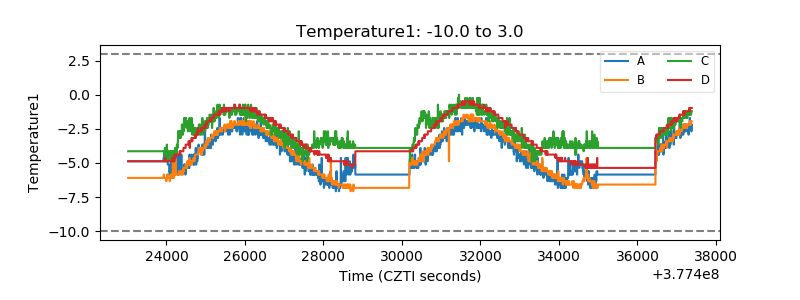 |
| Veto HV Monitor |  |
| Veto LLD | 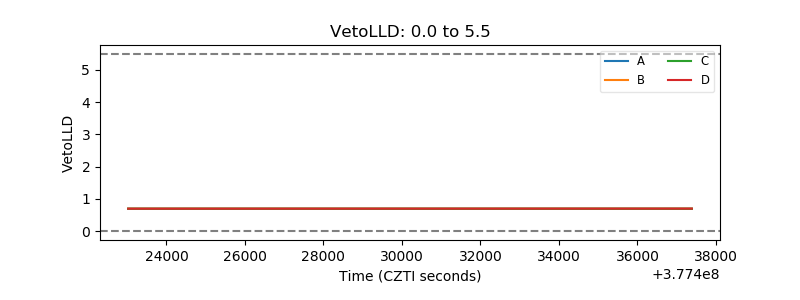 |
| Alpha Counter | 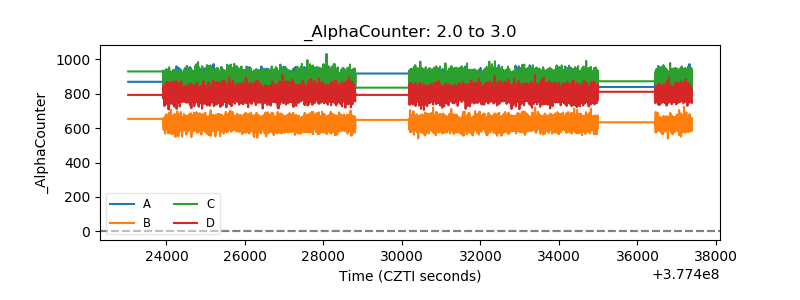 |
| _CPM_Rate | 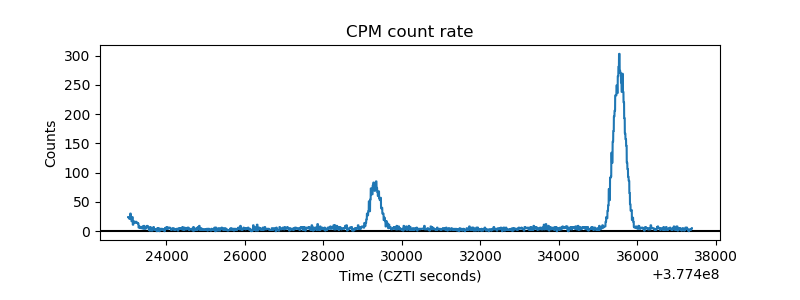 |
| CZT Counter | 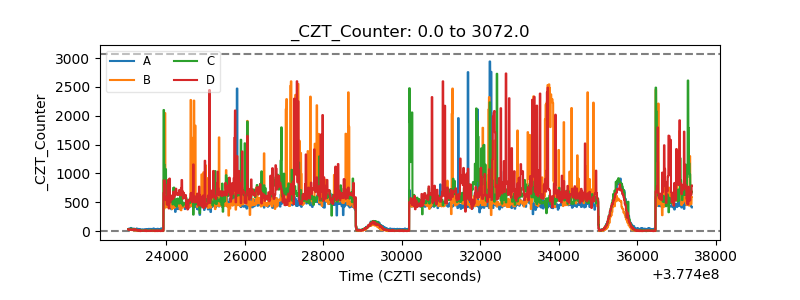 |
| +2.5 Volts monitor |  |
| +5 Volts monitor |  |
| _ROLL_ROT | 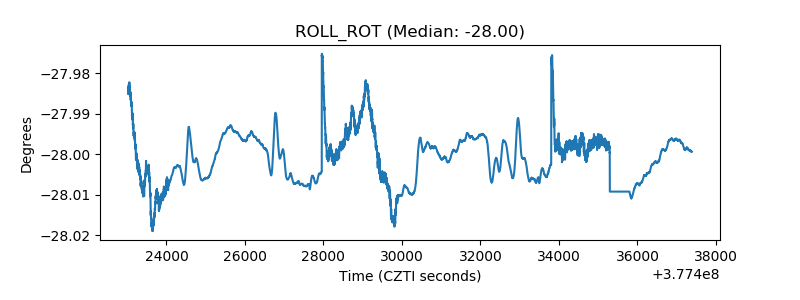 |
| _Roll_DEC |  |
| _Roll_RA | 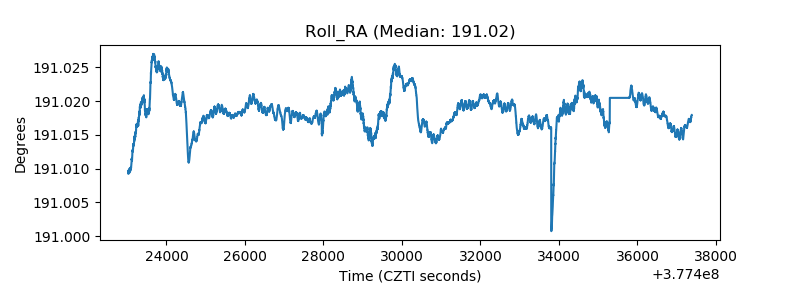 |
| Veto Counter | 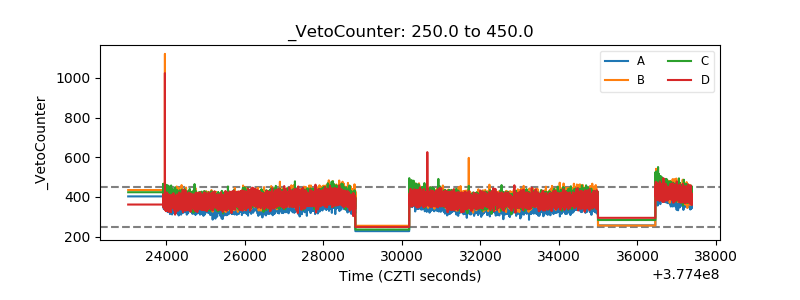 |