| Param | Original file | Final file |
|---|---|---|
| Filename | modeM0/AS1T04_076T01_9000004810_33635cztM0_level2.evt | modeM0/AS1T04_076T01_9000004810_33635cztM0_level2_quad_clean.evt |
| Size (bytes) | 562,285,440 | 53,156,160 |
| Size | 536.2 MB | 50.7 MB |
| Events in quadrant A | 2,691,381 | 316,514 |
| Events in quadrant B | 5,305,552 | 296,708 |
| Events in quadrant C | 4,286,032 | 305,026 |
| Events in quadrant D | 4,366,408 | 298,601 |
| Mode SS | |||
|---|---|---|---|
| Quadrant | BADHDUFLAG | Total packets | Discarded packets |
| A | 0 | 114 | 0 |
| B | 0 | 114 | 0 |
| C | 0 | 114 | 0 |
| D | 0 | 114 | 0 |
| Mode M9 | |||
|---|---|---|---|
| Quadrant | BADHDUFLAG | Total packets | Discarded packets |
| A | 0 | 18 | 0 |
| B | 0 | 18 | 0 |
| C | 0 | 18 | 0 |
| D | 0 | 19 | 0 |
| Mode M0 | |||
|---|---|---|---|
| Quadrant | BADHDUFLAG | Total packets | Discarded packets |
| A | 0 | 11490 | 2 |
| B | 0 | 19260 | 1 |
| C | 0 | 16665 | 1 |
| D | 0 | 17000 | 1 |
| Quadrant | Total seconds | Saturated seconds | Saturation percentage |
|---|---|---|---|
| A | 5606 | 10 | 0.178380% |
| B | 5606 | 1049 | 18.712094% |
| C | 5606 | 166 | 2.961113% |
| D | 5606 | 202 | 3.603282% |
Noise dominated data is calculated using 1-second bins in cleaned event files. If a bin has >2000 counts, and if more than 50% of those come from <1% of pixels, then it is considered to be noise-dominated and hence unusable.
| Quadrant | # 1 sec bins | Bins with >0 counts | Bins with >2000 counts | High rate bins dominated by noise | Noise dominated (total time) | Noise dominated (detector-on time) | Marked lightcurve |
|---|---|---|---|---|---|---|---|
| A | 7189 | 5607 | 2 | 2 | 0.03% | 0.04% | 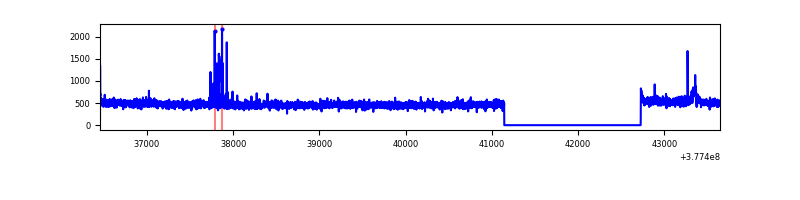 |
| B | 7189 | 5607 | 893 | 893 | 12.42% | 15.93% | 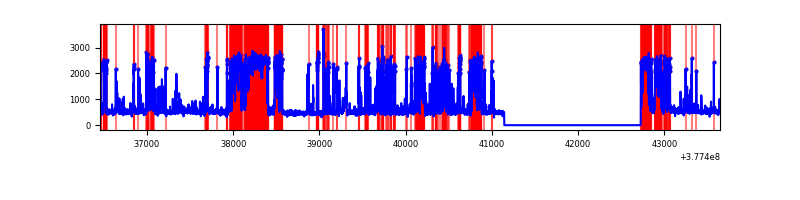 |
| C | 7189 | 5607 | 141 | 141 | 1.96% | 2.51% | 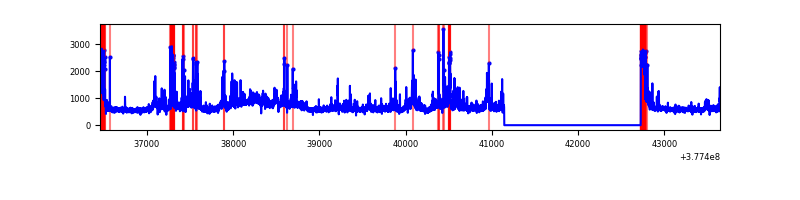 |
| D | 7189 | 5607 | 177 | 177 | 2.46% | 3.16% | 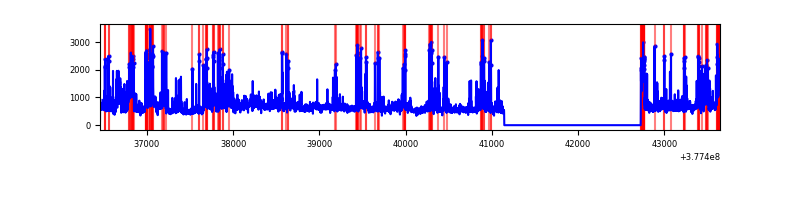 |
Top three noisy pixels from each quadrant. If the there are fewer than three noisy pixels in the level2.evt file, extra rows are filled as -1
| Pixel properties | Quadrant properties | ||||||
|---|---|---|---|---|---|---|---|
| Quadrant | DetID | PixID | Counts | Sigma | Mean | Median | Sigma |
| A | 15 | 237 | 30358 | 218.86 | 677 | 662 | 135.7 |
| A | 15 | 169 | 25639 | 184.08 | 677 | 662 | 135.7 |
| A | 13 | 6 | 12819 | 89.6 | 677 | 662 | 135.7 |
| B | 5 | 172 | 2681573 | 22392.92 | 618 | 602 | 119.7 |
| B | 0 | 213 | 51168 | 422.35 | 618 | 602 | 119.7 |
| B | 0 | 190 | 27299 | 222.99 | 618 | 602 | 119.7 |
| C | 3 | 233 | 1182736 | 7782.66 | 651 | 657 | 151.9 |
| C | 15 | 214 | 257802 | 1693.01 | 651 | 657 | 151.9 |
| C | 0 | 10 | 256740 | 1686.02 | 651 | 657 | 151.9 |
| D | 8 | 195 | 716681 | 4032.38 | 651 | 637 | 177.6 |
| D | 2 | 250 | 267941 | 1505.31 | 651 | 637 | 177.6 |
| D | 7 | 223 | 199281 | 1118.66 | 651 | 637 | 177.6 |
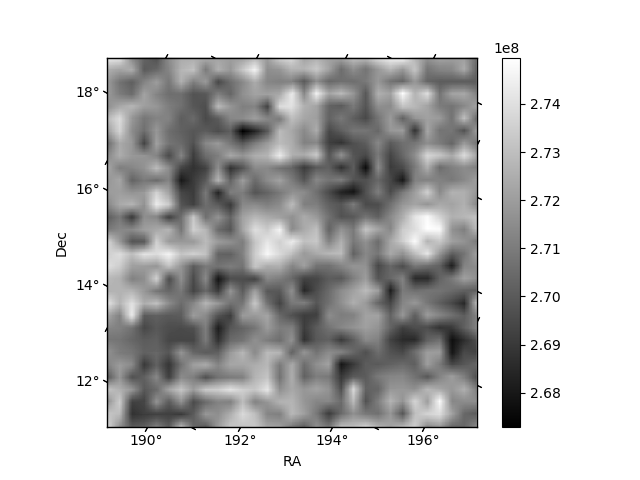
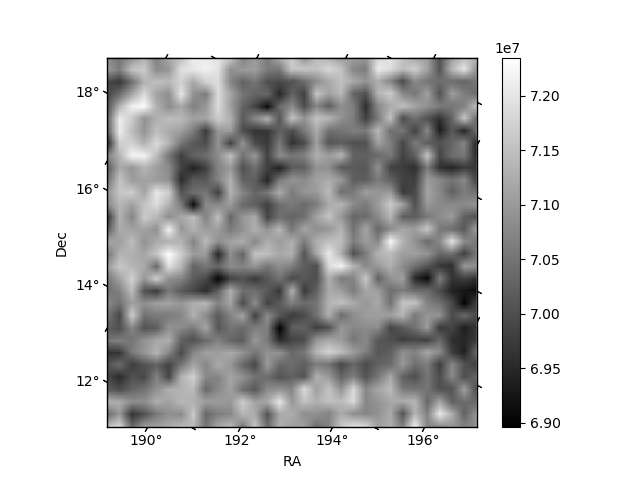
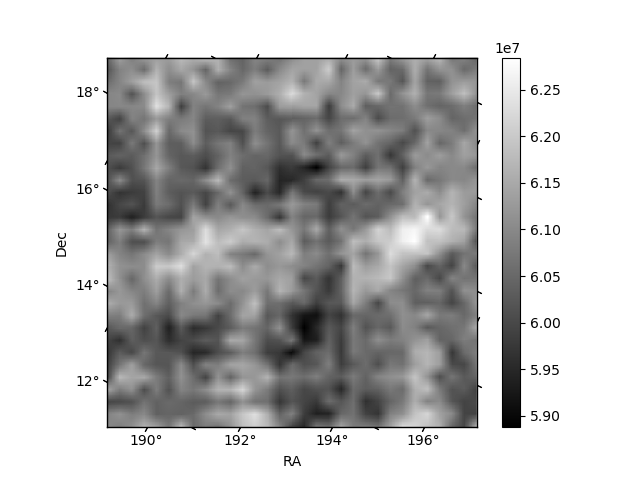
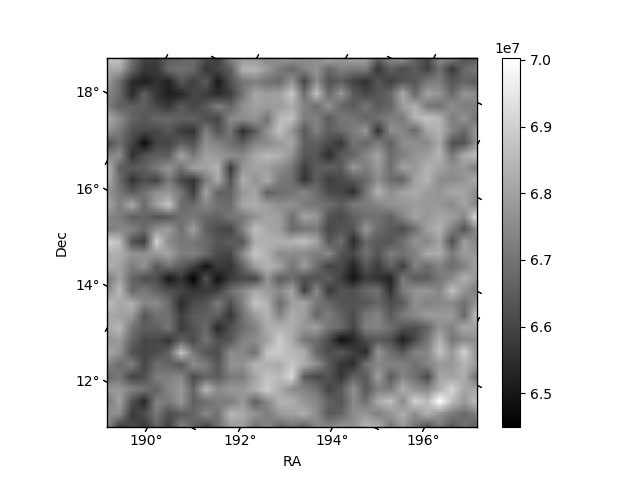
Histogram calculated using DETX and DETY for each event in the final _common_clean file
| Quadrant A | 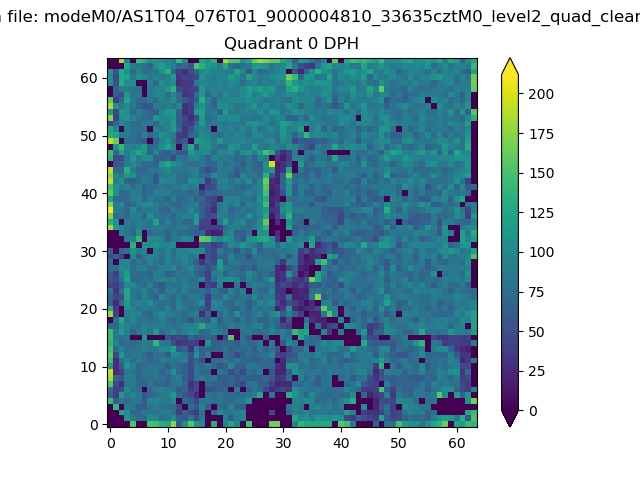 |
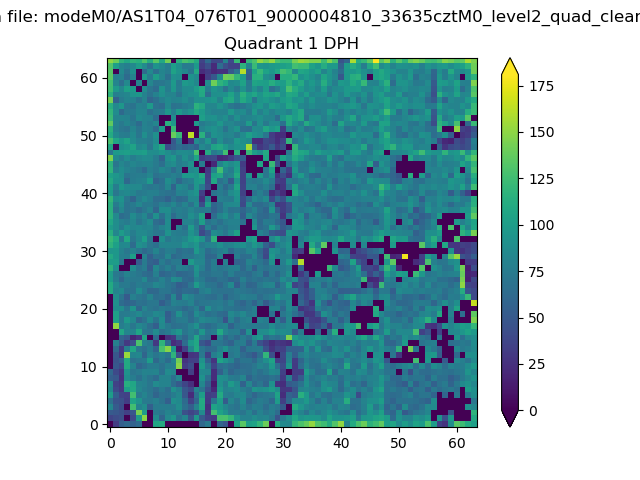 |
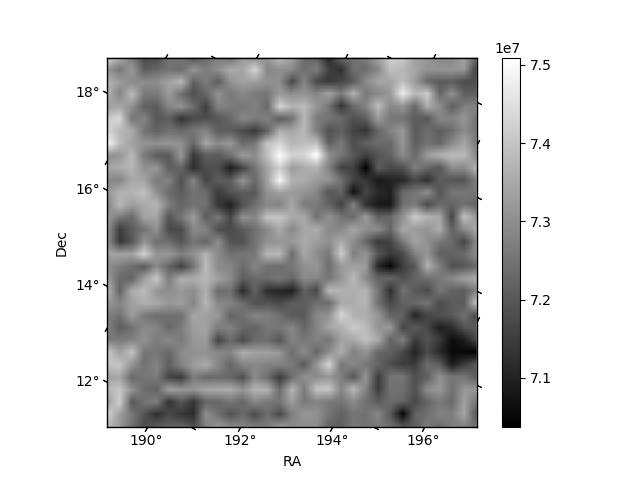
Quadrant B |
|---|---|---|---|
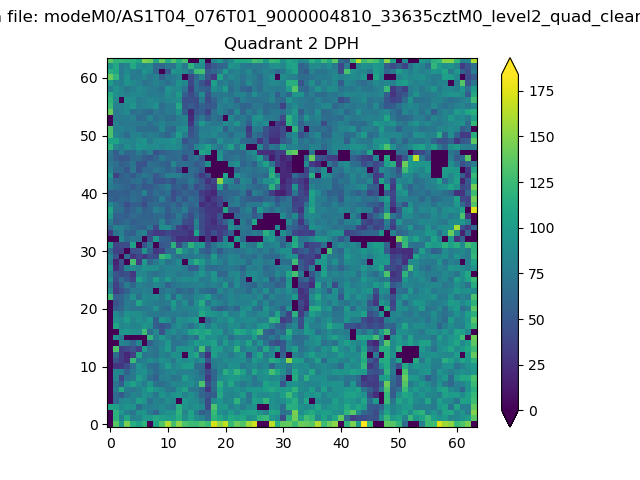
| Quadrant D | 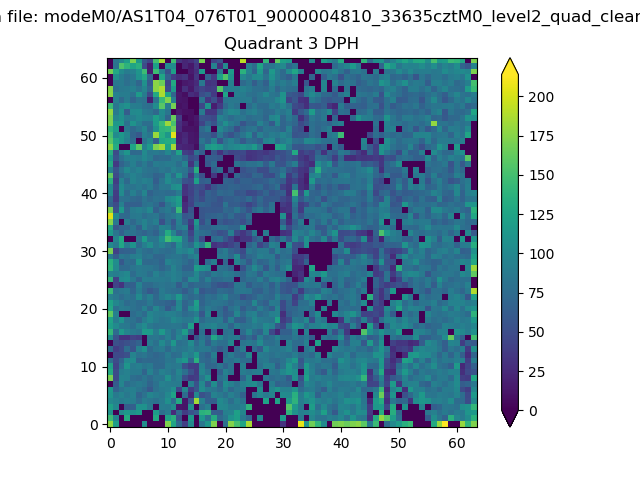 |
 |
Quadrant C |
| Plot type | Count rate plots | Images |
|---|---|---|
| Comparison with Poisson distribution Blue bars denote a histogram of data divided into 1 sec bins. Red curve is a Poisson curve with rate = median count rate of data. |
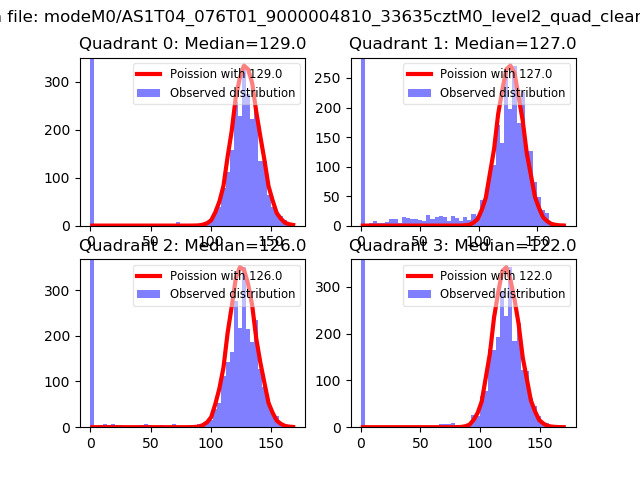 |
 |
| Quadrant-wise count rates Data is divided into 100 sec bins |
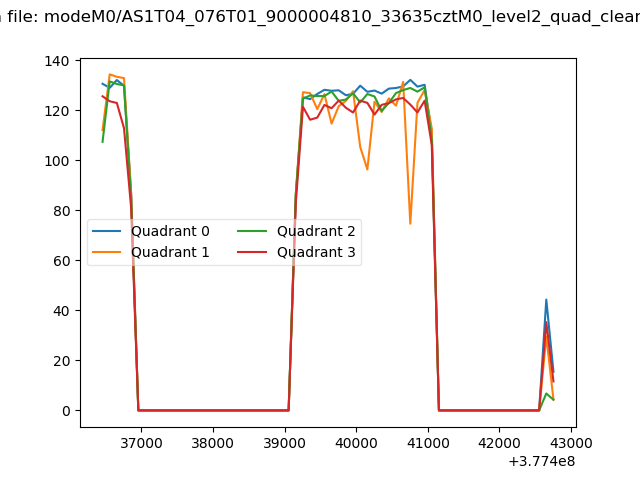 |
|
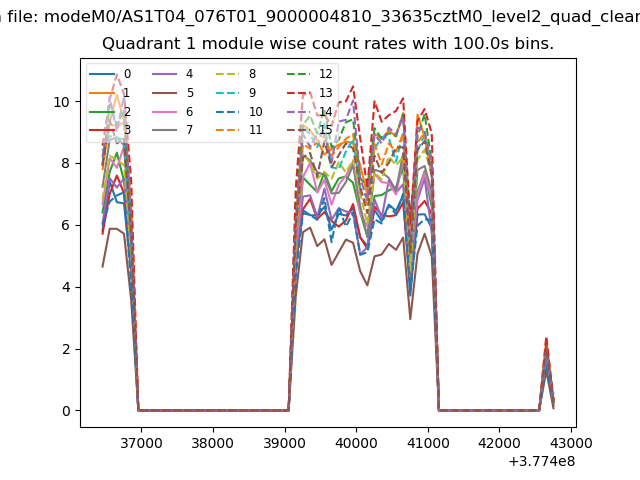
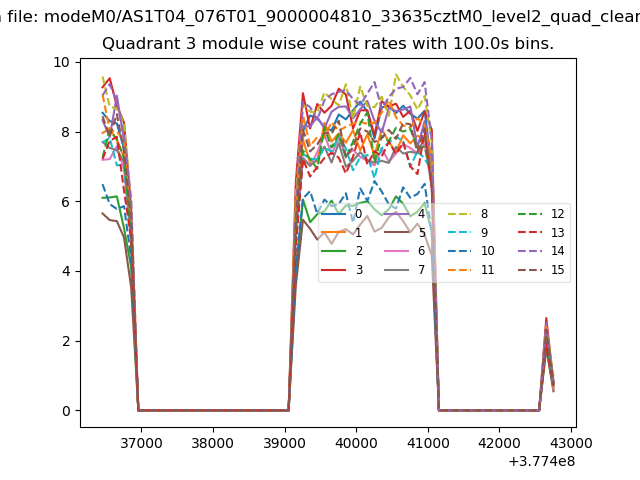
| Module-wise count rates for Quadrant A Data is divided into 100 sec bins |
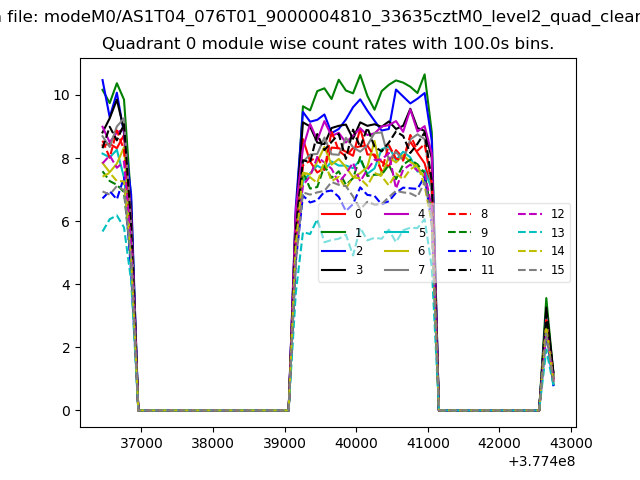 |
 |
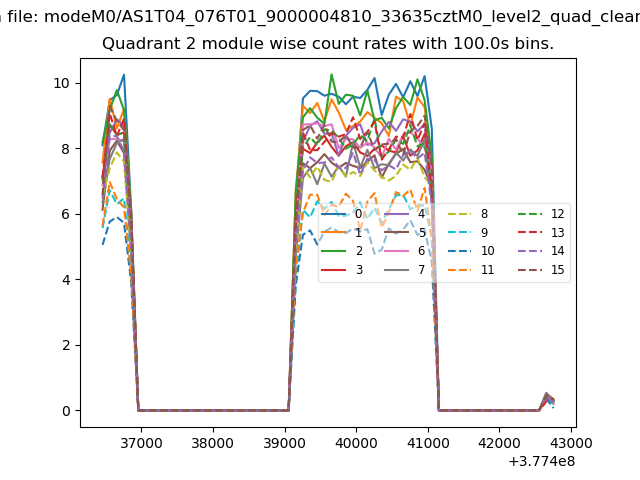
| Module-wise count rates for Quadrant B Data is divided into 100 sec bins |
 |
 |
| Module-wise count rates for Quadrant C Data is divided into 100 sec bins |
 |
 |
| Module-wise count rates for Quadrant D Data is divided into 100 sec bins |
 |
 |
| Parameter | Plot |
|---|---|
| CZT HV Monitor | 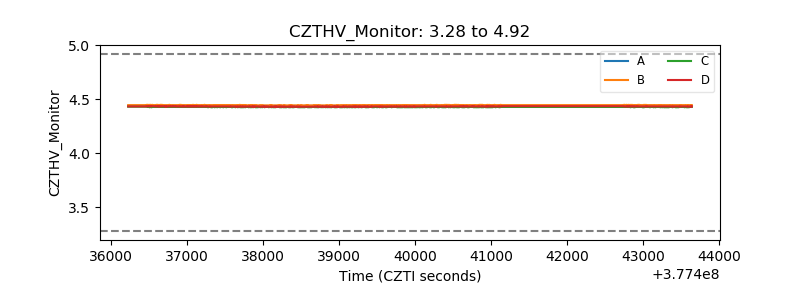 |
| D_VDD | 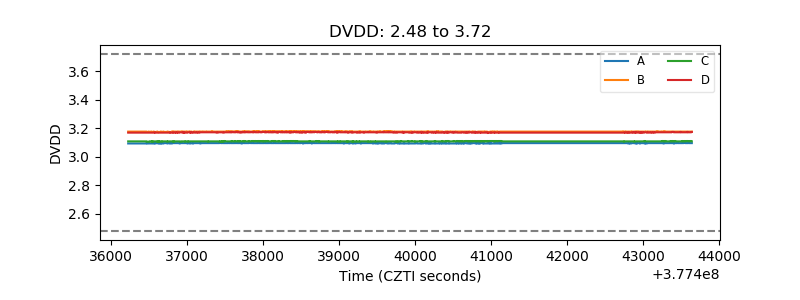 |
| Temperature 1 | 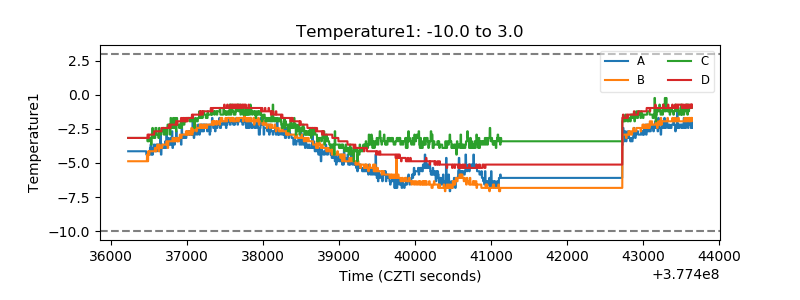 |
| Veto HV Monitor | 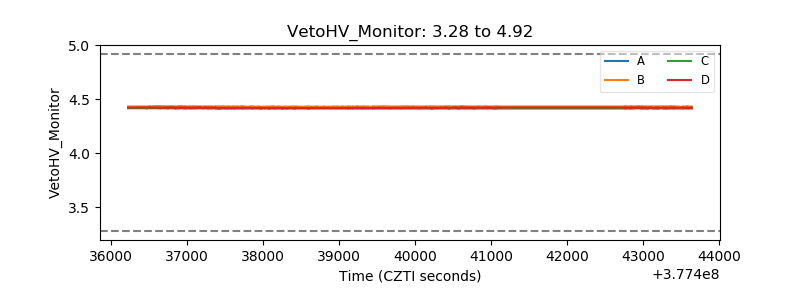 |
| Veto LLD | 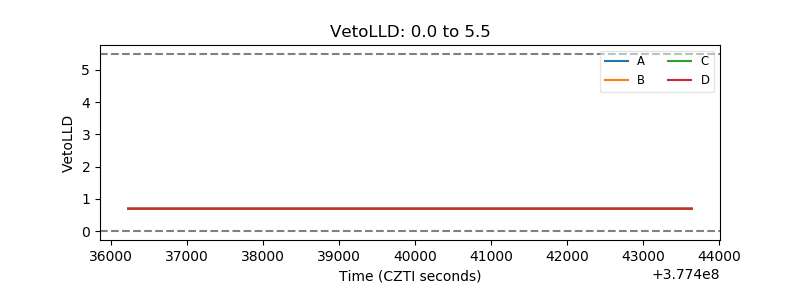 |
| Alpha Counter | 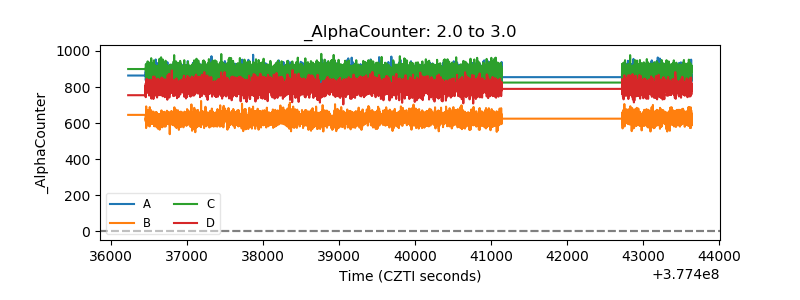 |
| _CPM_Rate | 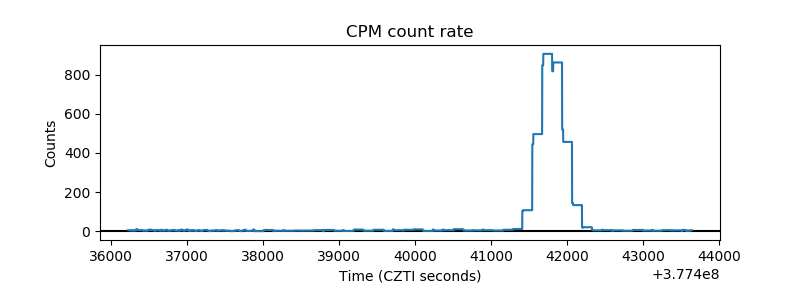 |
| CZT Counter | 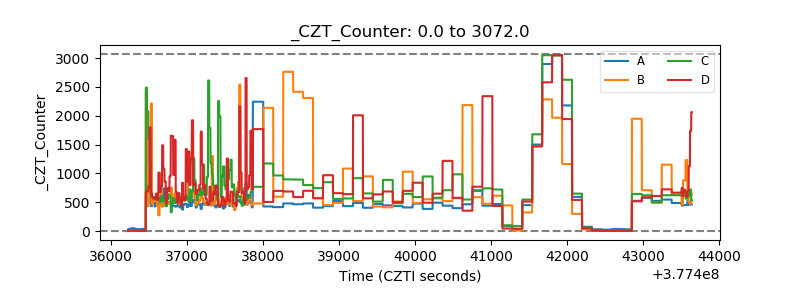 |
| +2.5 Volts monitor |  |
| +5 Volts monitor | 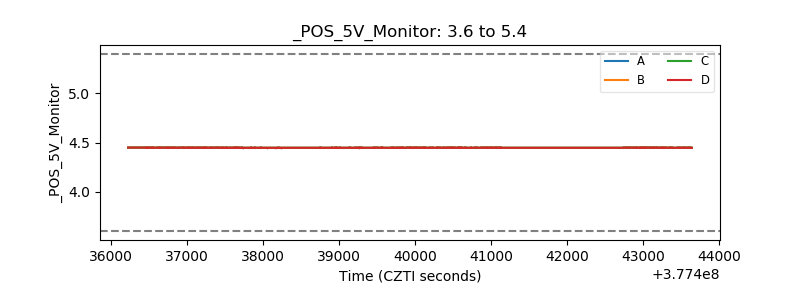 |
| _ROLL_ROT | 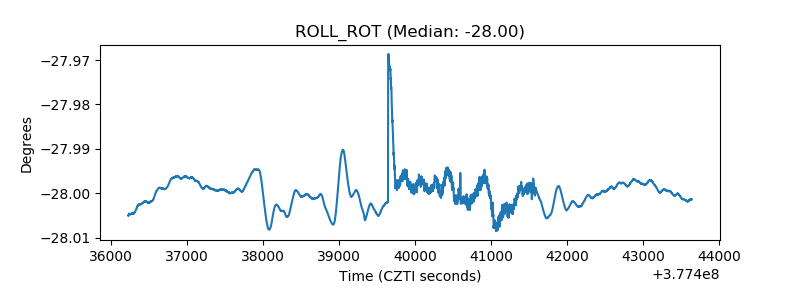 |
| _Roll_DEC | 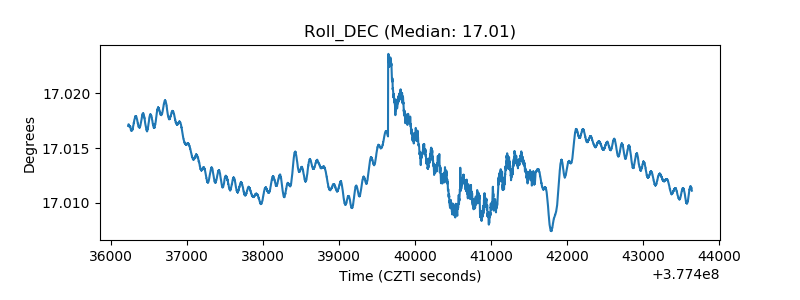 |
| _Roll_RA | 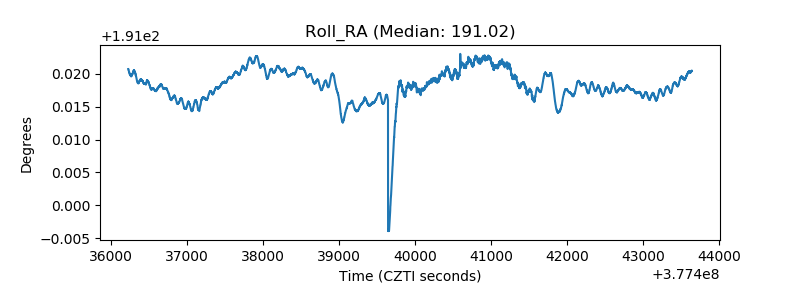 |
| Veto Counter | 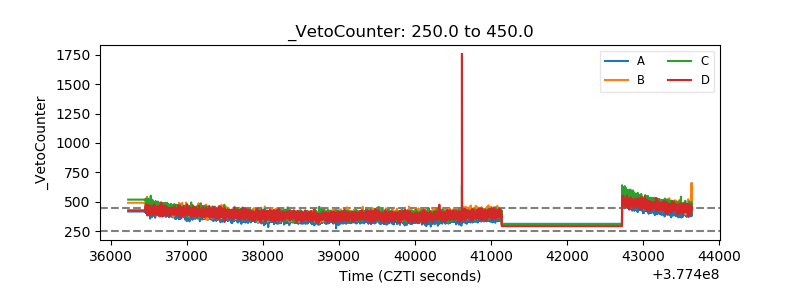 |