| Param | Original file | Final file |
|---|---|---|
| Filename | modeM0/AS1T04_076T01_9000004810_33636cztM0_level2.evt | modeM0/AS1T04_076T01_9000004810_33636cztM0_level2_quad_clean.evt |
| Size (bytes) | 550,195,200 | 50,388,480 |
| Size | 524.7 MB | 48.1 MB |
| Events in quadrant A | 2,646,321 | 295,272 |
| Events in quadrant B | 5,684,178 | 286,614 |
| Events in quadrant C | 3,747,511 | 287,984 |
| Events in quadrant D | 4,219,326 | 277,815 |
| Mode SS | |||
|---|---|---|---|
| Quadrant | BADHDUFLAG | Total packets | Discarded packets |
| A | 0 | 110 | 0 |
| B | 0 | 110 | 0 |
| C | 0 | 110 | 0 |
| D | 0 | 110 | 0 |
| Mode M9 | |||
|---|---|---|---|
| Quadrant | BADHDUFLAG | Total packets | Discarded packets |
| A | 0 | 19 | 0 |
| B | 0 | 19 | 0 |
| C | 0 | 19 | 0 |
| D | 0 | 20 | 0 |
| Mode M0 | |||
|---|---|---|---|
| Quadrant | BADHDUFLAG | Total packets | Discarded packets |
| A | 0 | 11233 | 2 |
| B | 0 | 20420 | 1 |
| C | 0 | 14846 | 1 |
| D | 0 | 16400 | 1 |
| Quadrant | Total seconds | Saturated seconds | Saturation percentage |
|---|---|---|---|
| A | 5391 | 6 | 0.111297% |
| B | 5391 | 1225 | 22.723057% |
| C | 5391 | 168 | 3.116305% |
| D | 5391 | 222 | 4.117974% |
Noise dominated data is calculated using 1-second bins in cleaned event files. If a bin has >2000 counts, and if more than 50% of those come from <1% of pixels, then it is considered to be noise-dominated and hence unusable.
| Quadrant | # 1 sec bins | Bins with >0 counts | Bins with >2000 counts | High rate bins dominated by noise | Noise dominated (total time) | Noise dominated (detector-on time) | Marked lightcurve |
|---|---|---|---|---|---|---|---|
| A | 7124 | 5392 | 0 | 0 | 0.00% | 0.00% | 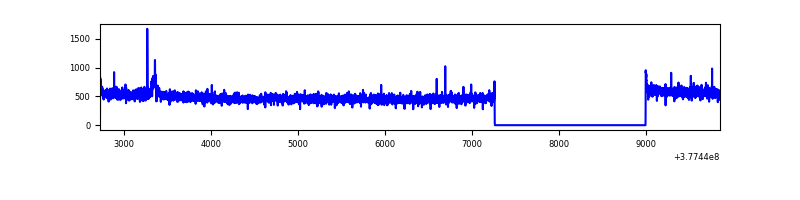 |
| B | 7124 | 5392 | 1090 | 1090 | 15.30% | 20.22% | 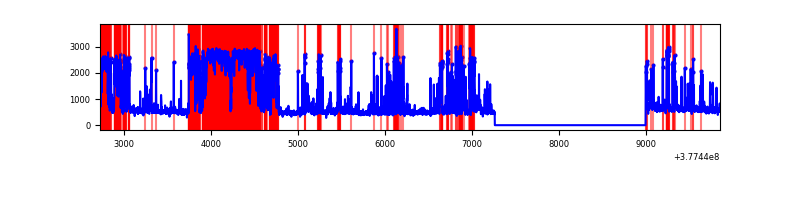 |
| C | 7124 | 5392 | 143 | 143 | 2.01% | 2.65% |  |
| D | 7124 | 5392 | 194 | 194 | 2.72% | 3.60% | 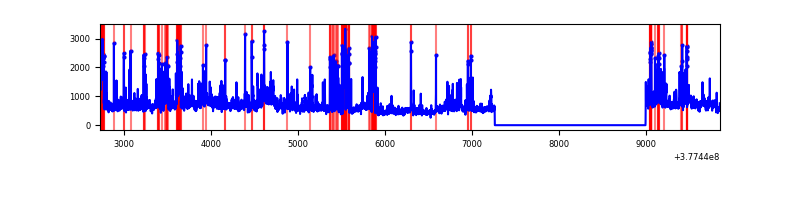 |
Top three noisy pixels from each quadrant. If the there are fewer than three noisy pixels in the level2.evt file, extra rows are filled as -1
| Pixel properties | Quadrant properties | ||||||
|---|---|---|---|---|---|---|---|
| Quadrant | DetID | PixID | Counts | Sigma | Mean | Median | Sigma |
| A | 15 | 169 | 25394 | 183.73 | 670 | 655 | 134.6 |
| A | 13 | 6 | 18131 | 129.79 | 670 | 655 | 134.6 |
| A | 13 | 254 | 9182 | 63.33 | 670 | 655 | 134.6 |
| B | 5 | 172 | 3159965 | 28091.5 | 586 | 573 | 112.5 |
| B | 5 | 207 | 73531 | 648.7 | 586 | 573 | 112.5 |
| B | 5 | 255 | 29665 | 258.67 | 586 | 573 | 112.5 |
| C | 3 | 233 | 543503 | 3677.93 | 643 | 649 | 147.6 |
| C | 0 | 10 | 356936 | 2413.91 | 643 | 649 | 147.6 |
| C | 15 | 214 | 246867 | 1668.17 | 643 | 649 | 147.6 |
| D | 8 | 195 | 715656 | 4197.31 | 645 | 628 | 170.4 |
| D | 7 | 223 | 186357 | 1090.25 | 645 | 628 | 170.4 |
| D | 5 | 236 | 175514 | 1026.6 | 645 | 628 | 170.4 |
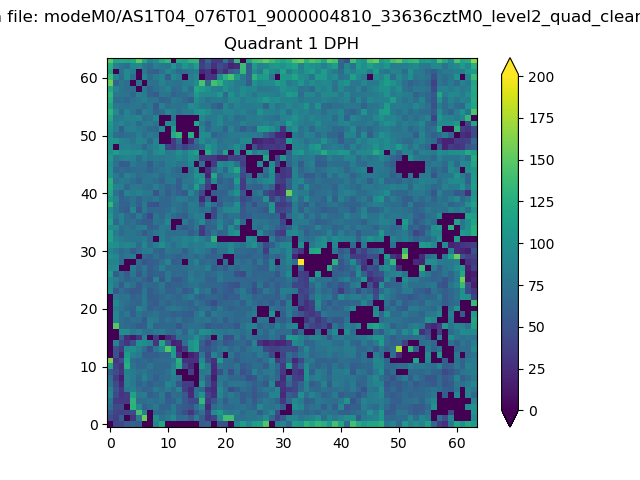
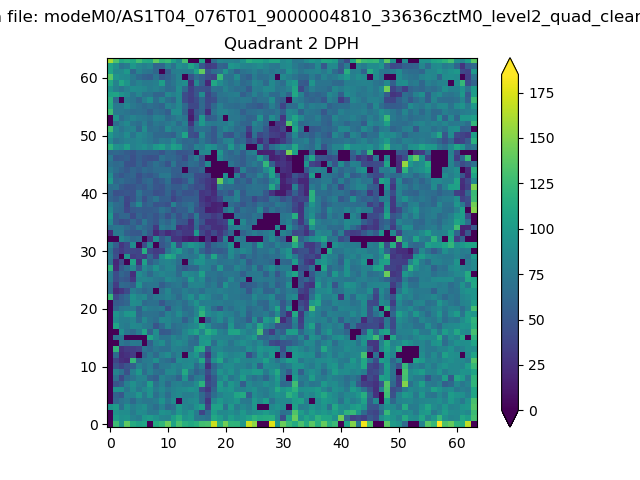
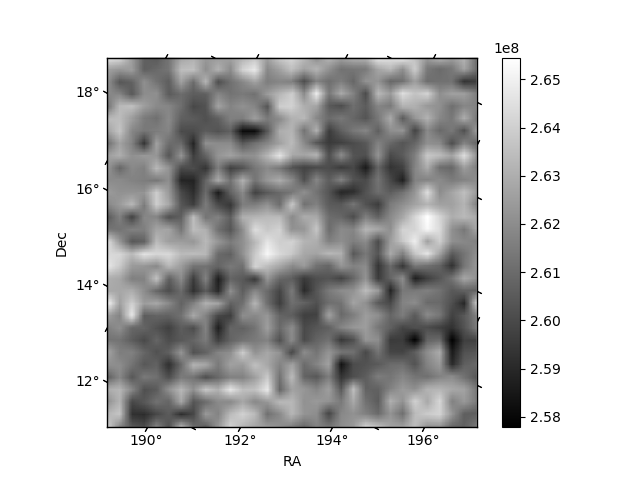
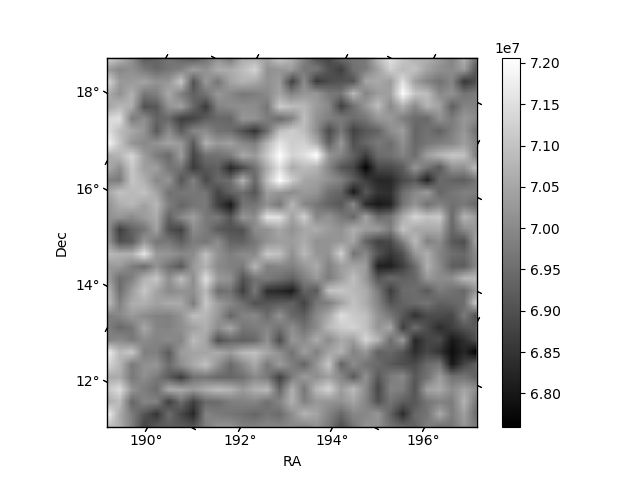
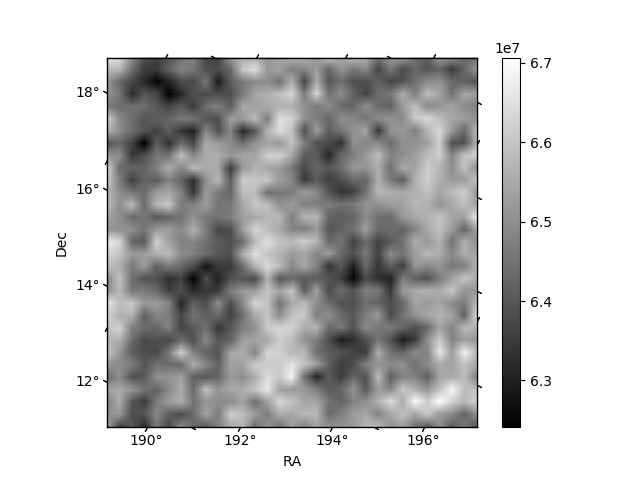
Histogram calculated using DETX and DETY for each event in the final _common_clean file
| Quadrant A | 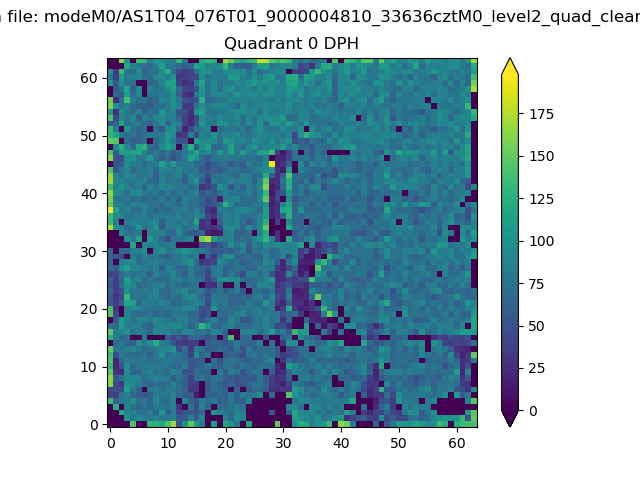 |
 |
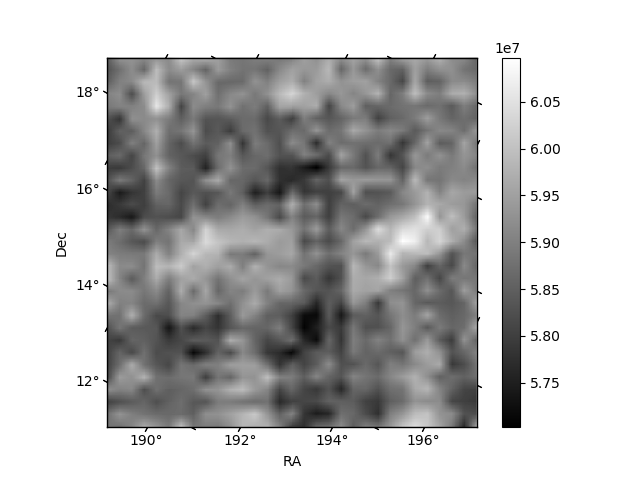
Quadrant B |
|---|---|---|---|
| Quadrant D | 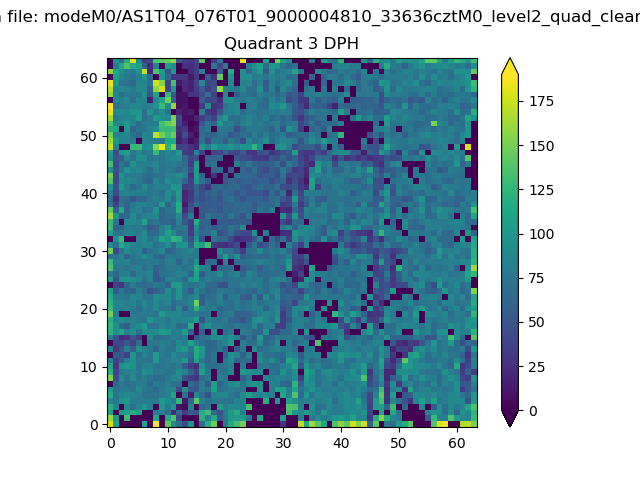 |
 |
Quadrant C |
| Plot type | Count rate plots | Images |
|---|---|---|
| Comparison with Poisson distribution Blue bars denote a histogram of data divided into 1 sec bins. Red curve is a Poisson curve with rate = median count rate of data. |
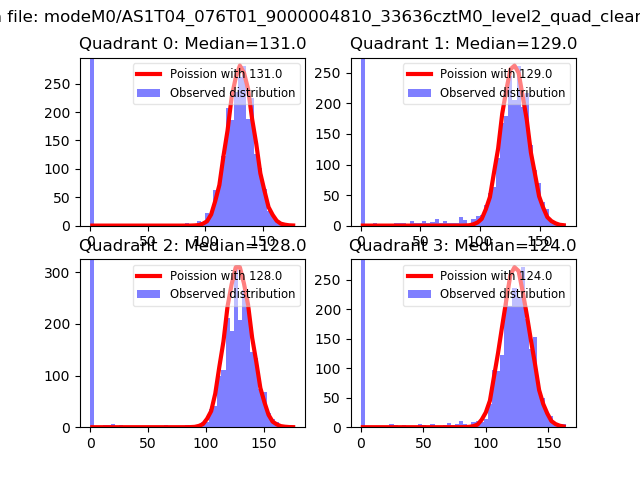 |
 |
| Quadrant-wise count rates Data is divided into 100 sec bins |
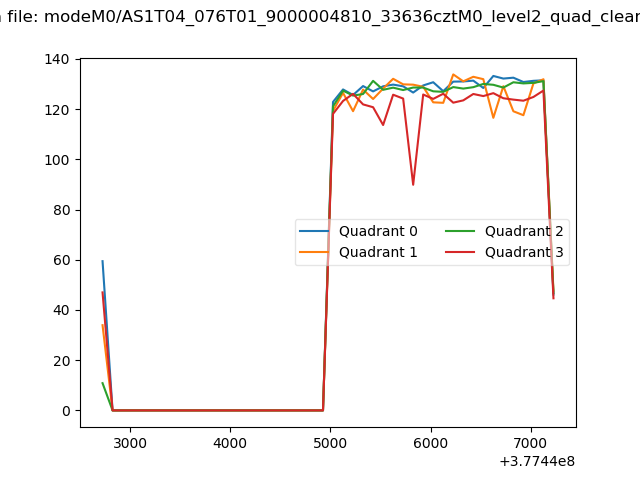 |
|
| Module-wise count rates for Quadrant A Data is divided into 100 sec bins |
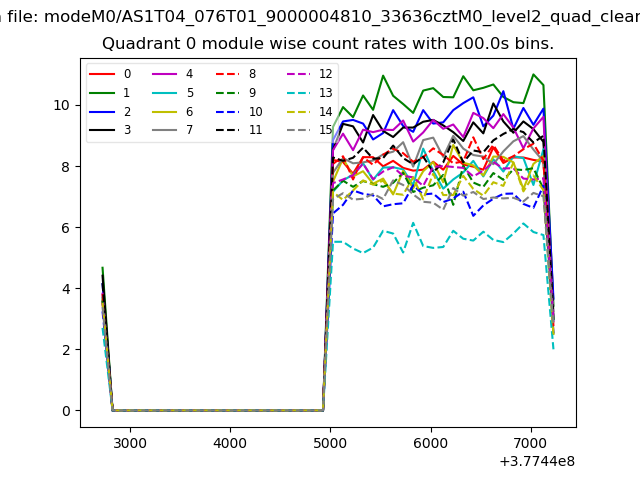 |
 |
| Module-wise count rates for Quadrant B Data is divided into 100 sec bins |
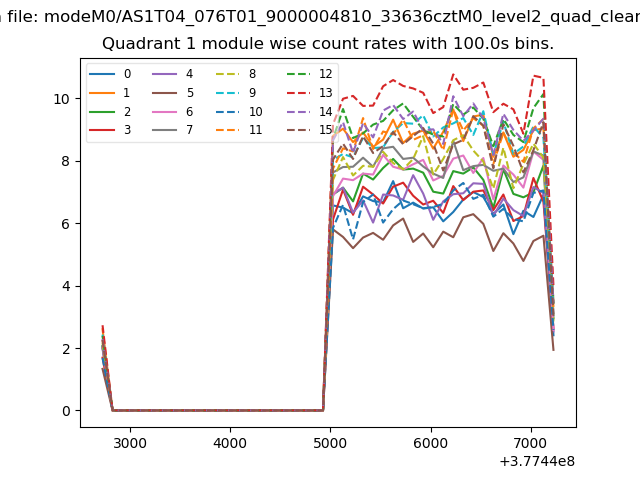 |
 |
| Module-wise count rates for Quadrant C Data is divided into 100 sec bins |
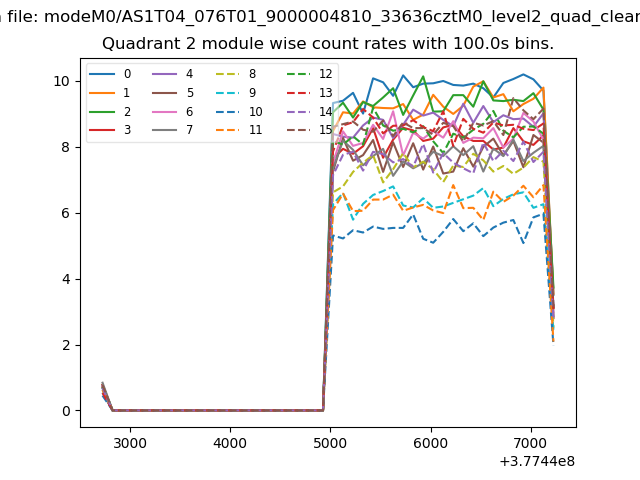 |
 |
| Module-wise count rates for Quadrant D Data is divided into 100 sec bins |
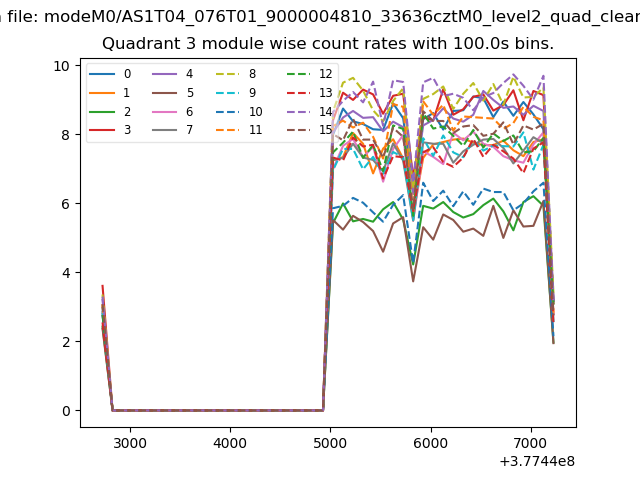 |
 |
| Parameter | Plot |
|---|---|
| CZT HV Monitor | 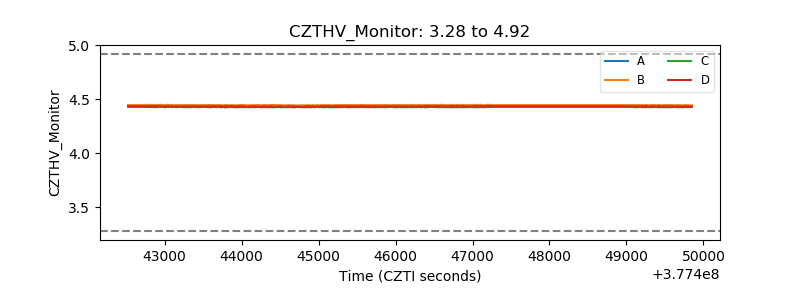 |
| D_VDD | 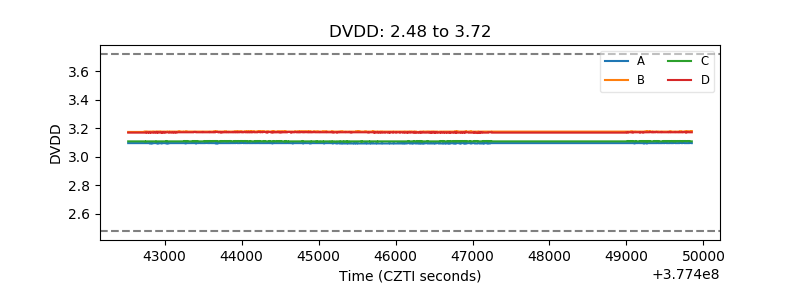 |
| Temperature 1 |  |
| Veto HV Monitor |  |
| Veto LLD | 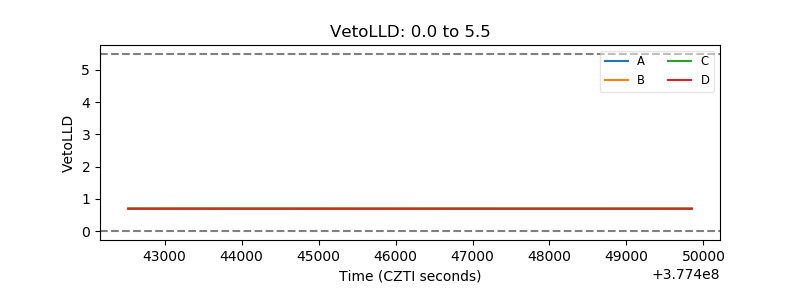 |
| Alpha Counter | 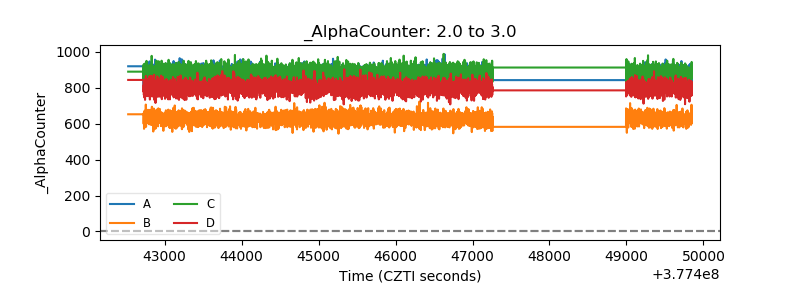 |
| _CPM_Rate | 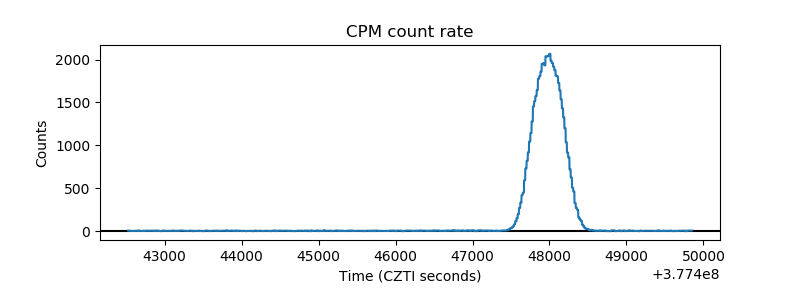 |
| CZT Counter | 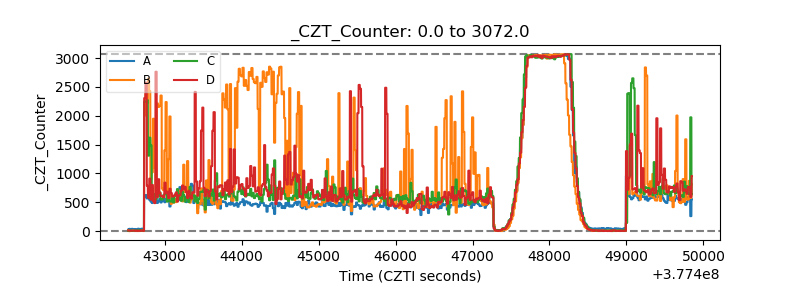 |
| +2.5 Volts monitor |  |
| +5 Volts monitor |  |
| _ROLL_ROT | 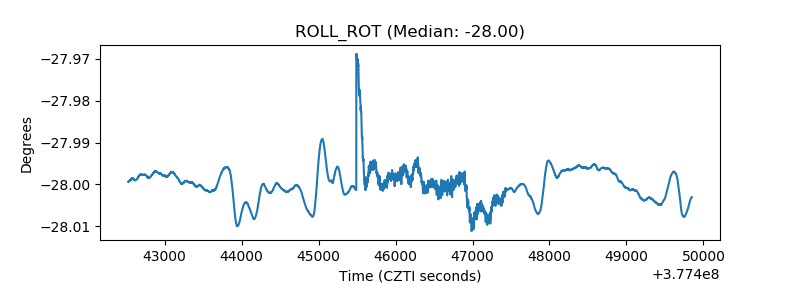 |
| _Roll_DEC | 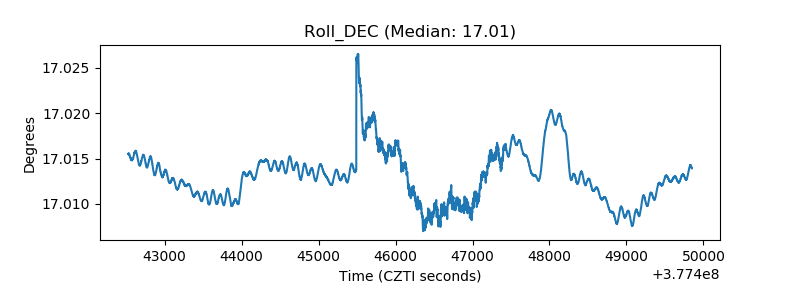 |
| _Roll_RA | 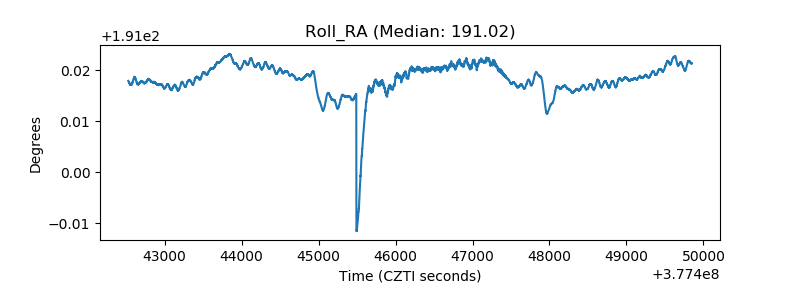 |
| Veto Counter | 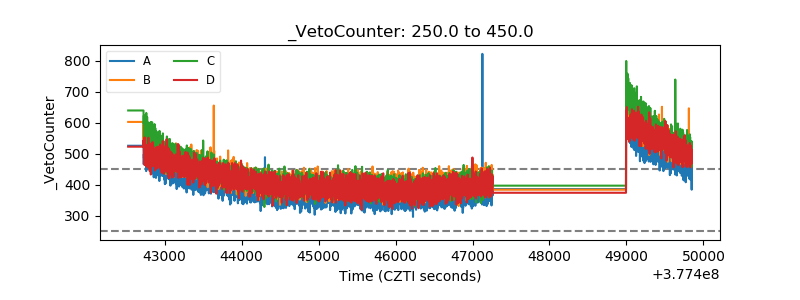 |