| Param | Original file | Final file |
|---|---|---|
| Filename | modeM0/AS1T04_076T01_9000004810_33638cztM0_level2.evt | modeM0/AS1T04_076T01_9000004810_33638cztM0_level2_quad_clean.evt |
| Size (bytes) | 515,041,920 | 57,291,840 |
| Size | 491.2 MB | 54.6 MB |
| Events in quadrant A | 2,873,344 | 345,372 |
| Events in quadrant B | 4,659,511 | 335,635 |
| Events in quadrant C | 3,585,628 | 347,437 |
| Events in quadrant D | 4,111,091 | 325,191 |
| Mode SS | |||
|---|---|---|---|
| Quadrant | BADHDUFLAG | Total packets | Discarded packets |
| A | 0 | 110 | 0 |
| B | 0 | 110 | 0 |
| C | 0 | 110 | 0 |
| D | 0 | 110 | 0 |
| Mode M9 | |||
|---|---|---|---|
| Quadrant | BADHDUFLAG | Total packets | Discarded packets |
| A | 0 | 29 | 0 |
| B | 0 | 29 | 0 |
| C | 0 | 29 | 0 |
| D | 0 | 30 | 0 |
| Mode M0 | |||
|---|---|---|---|
| Quadrant | BADHDUFLAG | Total packets | Discarded packets |
| A | 0 | 11943 | 3 |
| B | 0 | 17531 | 2 |
| C | 0 | 14397 | 2 |
| D | 0 | 16181 | 2 |
| Quadrant | Total seconds | Saturated seconds | Saturation percentage |
|---|---|---|---|
| A | 5441 | 5 | 0.091895% |
| B | 5441 | 591 | 10.861974% |
| C | 5441 | 138 | 2.536298% |
| D | 5441 | 168 | 3.087668% |
Noise dominated data is calculated using 1-second bins in cleaned event files. If a bin has >2000 counts, and if more than 50% of those come from <1% of pixels, then it is considered to be noise-dominated and hence unusable.
| Quadrant | # 1 sec bins | Bins with >0 counts | Bins with >2000 counts | High rate bins dominated by noise | Noise dominated (total time) | Noise dominated (detector-on time) | Marked lightcurve |
|---|---|---|---|---|---|---|---|
| A | 7293 | 5442 | 0 | 0 | 0.00% | 0.00% | 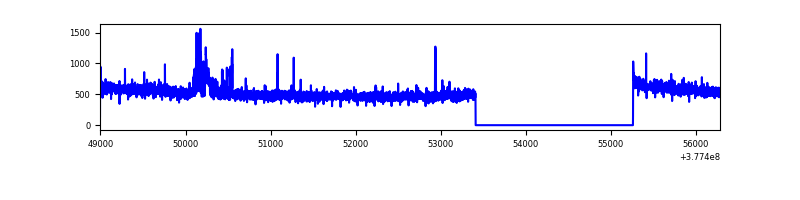 |
| B | 7293 | 5442 | 472 | 472 | 6.47% | 8.67% | 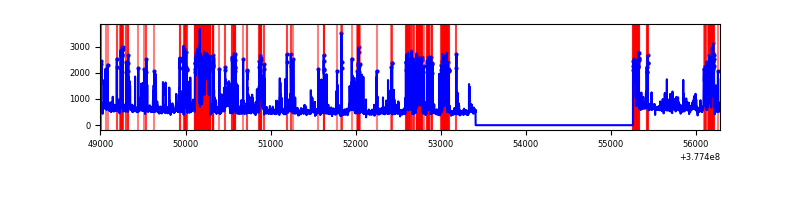 |
| C | 7293 | 5442 | 106 | 106 | 1.45% | 1.95% | 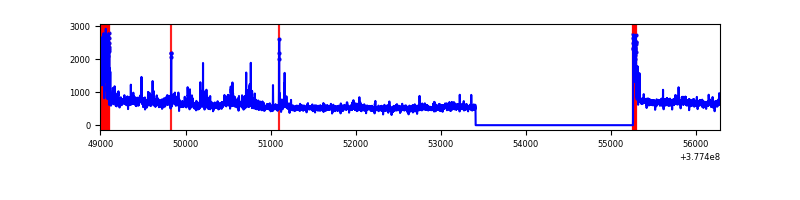 |
| D | 7293 | 5442 | 134 | 134 | 1.84% | 2.46% | 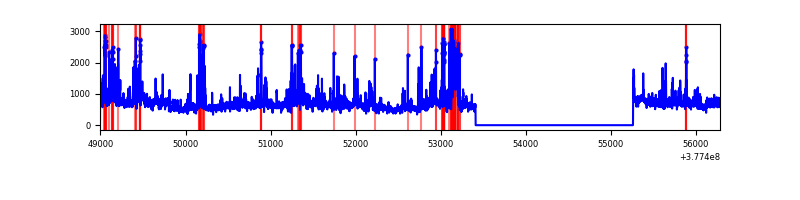 |
Top three noisy pixels from each quadrant. If the there are fewer than three noisy pixels in the level2.evt file, extra rows are filled as -1
| Pixel properties | Quadrant properties | ||||||
|---|---|---|---|---|---|---|---|
| Quadrant | DetID | PixID | Counts | Sigma | Mean | Median | Sigma |
| A | 5 | 168 | 73365 | 512.5 | 709 | 696 | 141.8 |
| A | 9 | 143 | 30696 | 211.57 | 709 | 696 | 141.8 |
| A | 13 | 6 | 11989 | 79.64 | 709 | 696 | 141.8 |
| B | 5 | 172 | 1682577 | 13227.05 | 674 | 659 | 127.2 |
| B | 5 | 207 | 73579 | 573.46 | 674 | 659 | 127.2 |
| B | 15 | 222 | 36131 | 278.96 | 674 | 659 | 127.2 |
| C | 3 | 233 | 297964 | 1890.84 | 687 | 693 | 157.2 |
| C | 0 | 10 | 286719 | 1819.32 | 687 | 693 | 157.2 |
| C | 15 | 214 | 249759 | 1584.23 | 687 | 693 | 157.2 |
| D | 8 | 195 | 691102 | 4045.18 | 685 | 668 | 170.7 |
| D | 13 | 249 | 306285 | 1790.58 | 685 | 668 | 170.7 |
| D | 7 | 223 | 105546 | 614.47 | 685 | 668 | 170.7 |
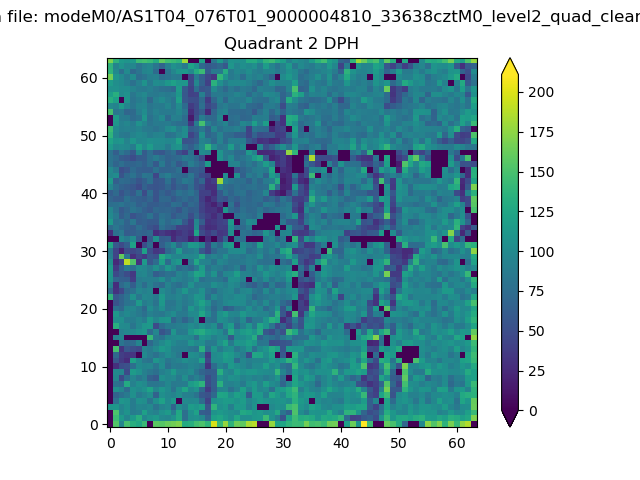
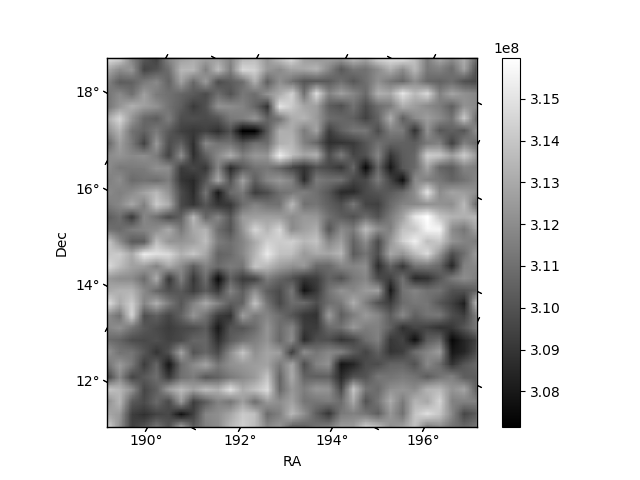
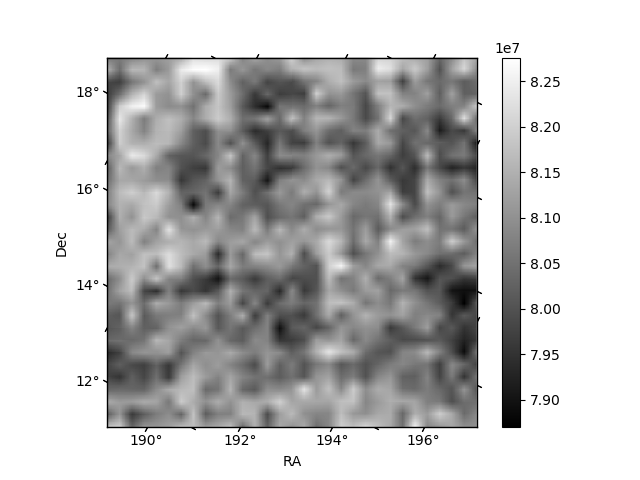
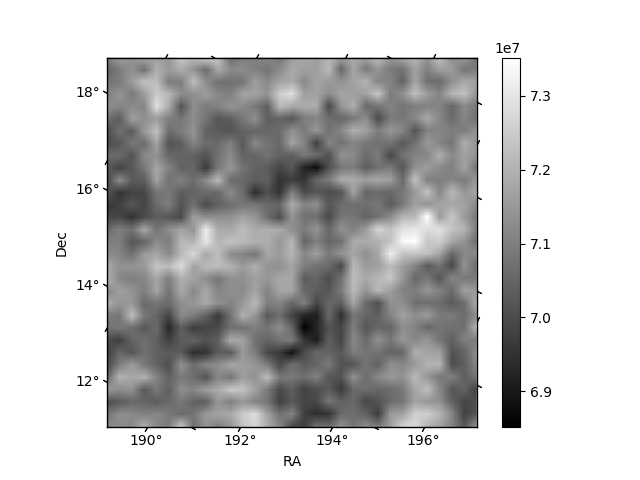
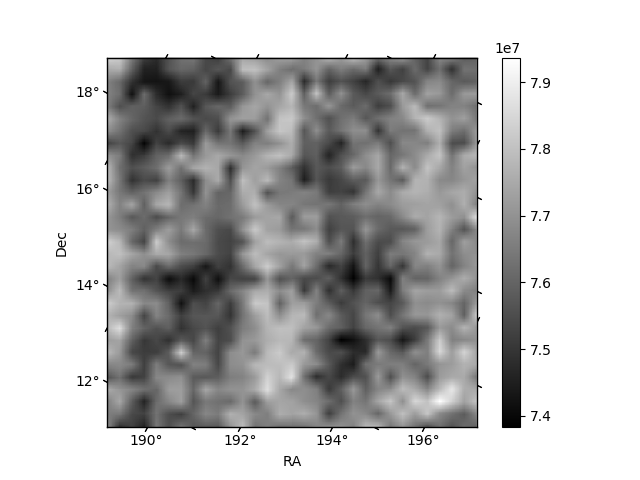
Histogram calculated using DETX and DETY for each event in the final _common_clean file
| Quadrant A | 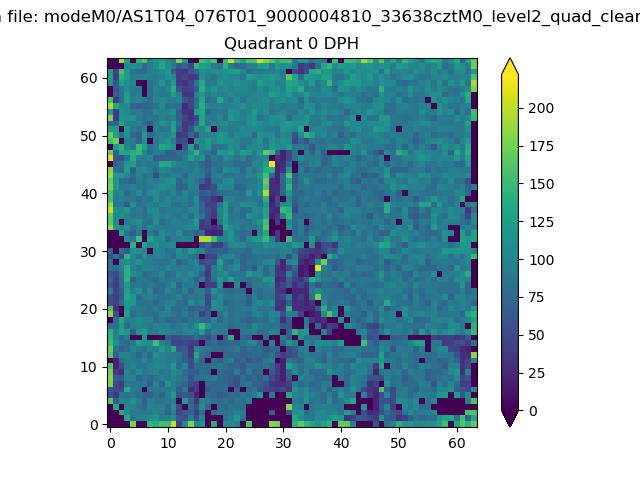 |
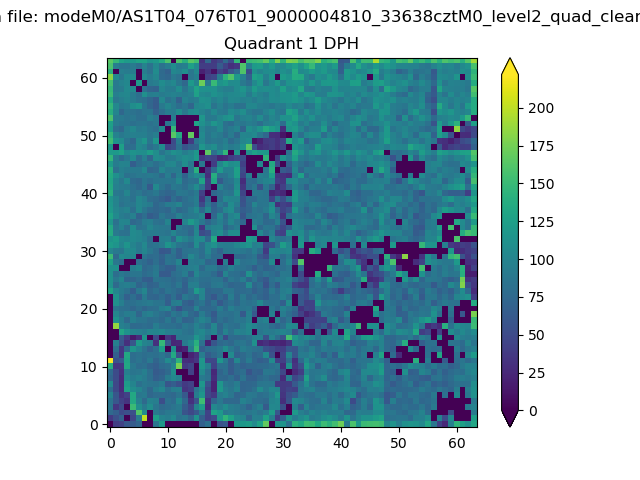 |
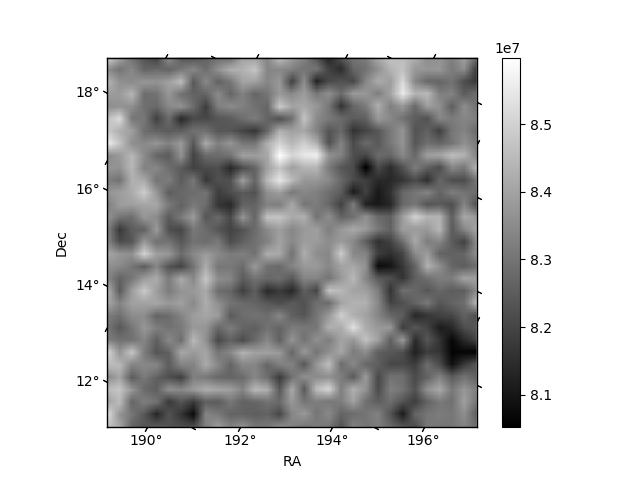
Quadrant B |
|---|---|---|---|
| Quadrant D | 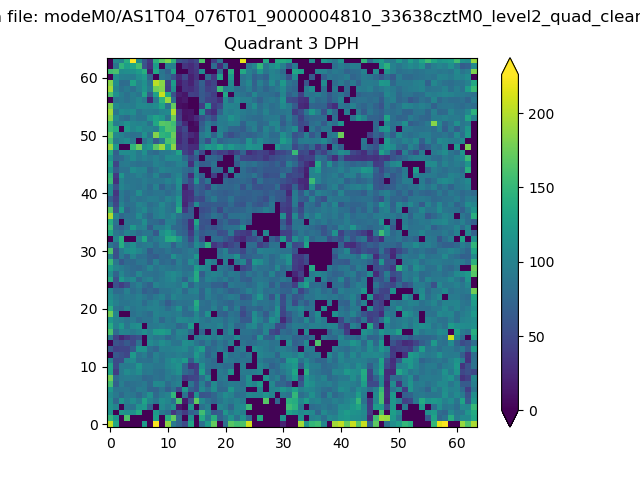 |
 |
Quadrant C |
| Plot type | Count rate plots | Images |
|---|---|---|
| Comparison with Poisson distribution Blue bars denote a histogram of data divided into 1 sec bins. Red curve is a Poisson curve with rate = median count rate of data. |
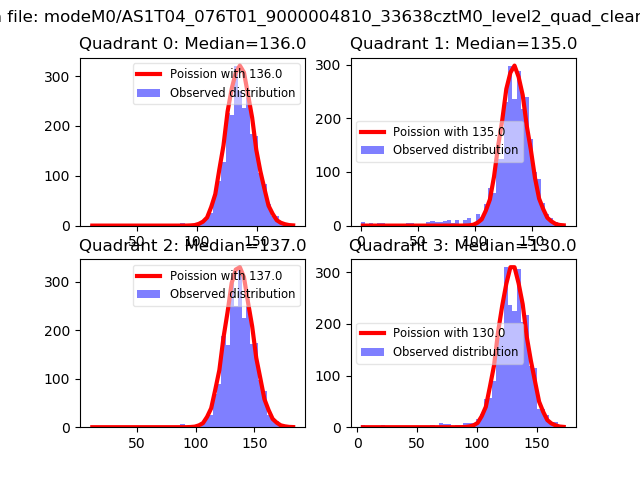 |
 |
| Quadrant-wise count rates Data is divided into 100 sec bins |
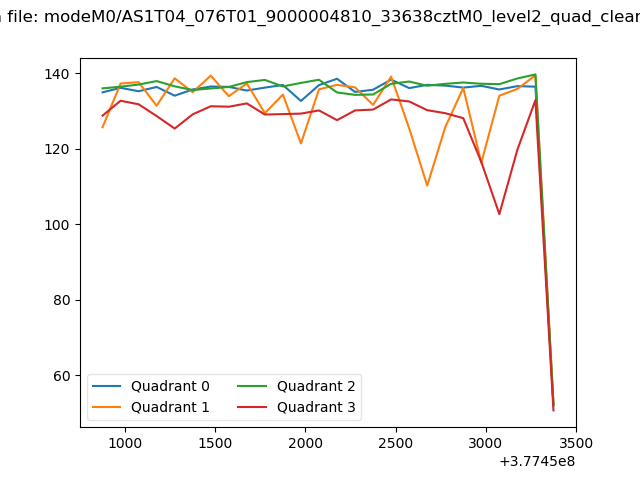 |
|
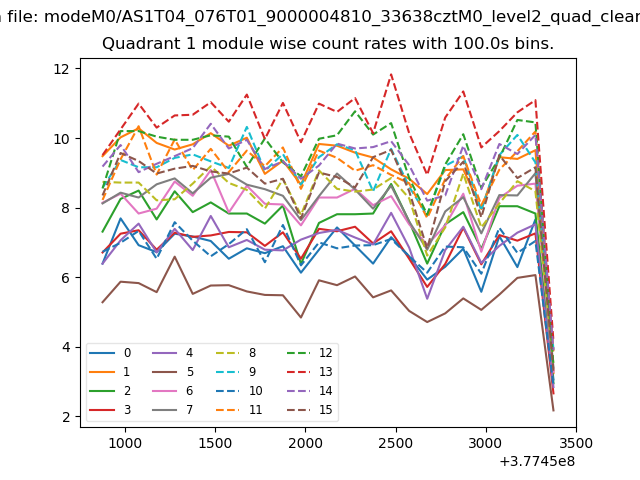
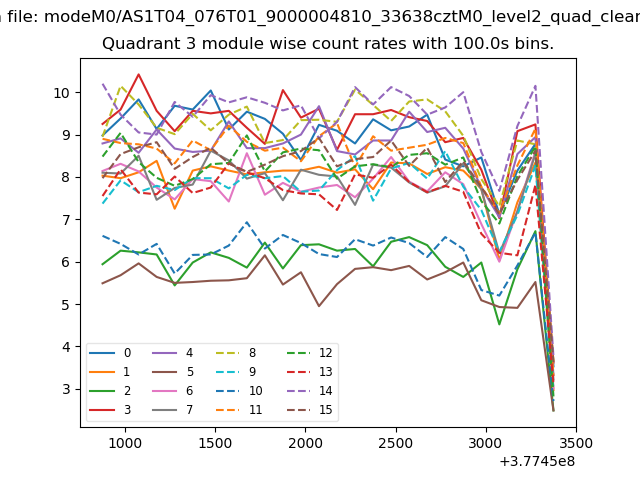
| Module-wise count rates for Quadrant A Data is divided into 100 sec bins |
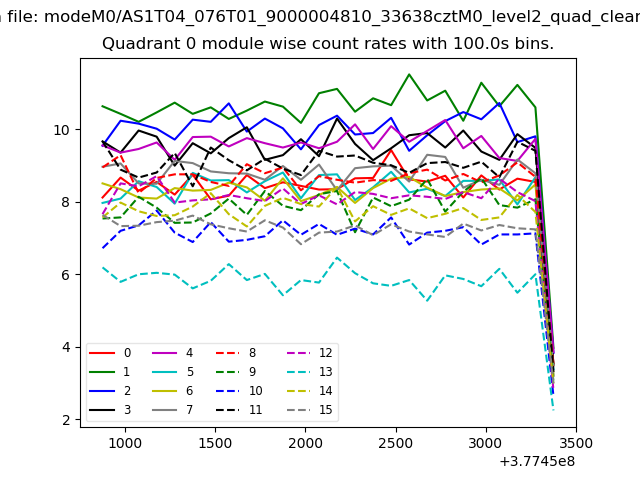 |
 |
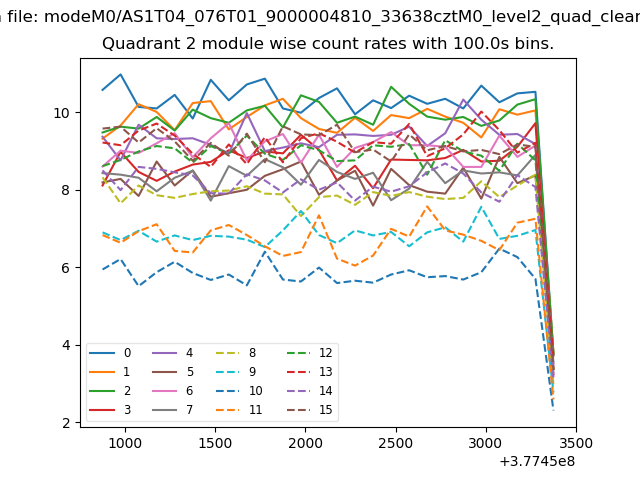
| Module-wise count rates for Quadrant B Data is divided into 100 sec bins |
 |
 |
| Module-wise count rates for Quadrant C Data is divided into 100 sec bins |
 |
 |
| Module-wise count rates for Quadrant D Data is divided into 100 sec bins |
 |
 |
| Parameter | Plot |
|---|---|
| CZT HV Monitor | 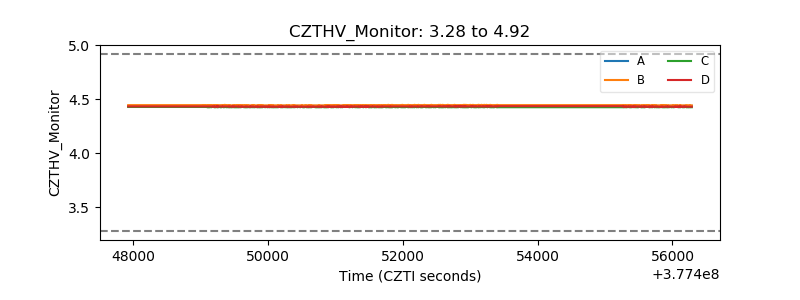 |
| D_VDD | 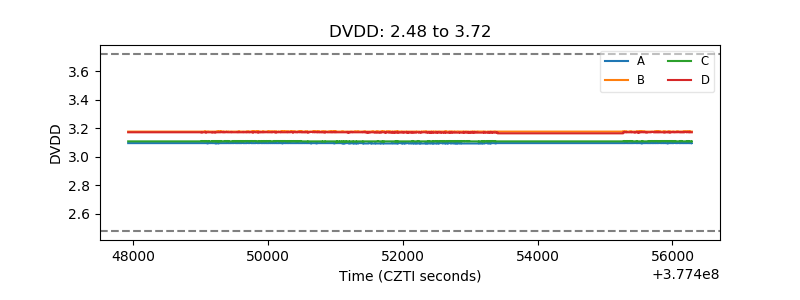 |
| Temperature 1 | 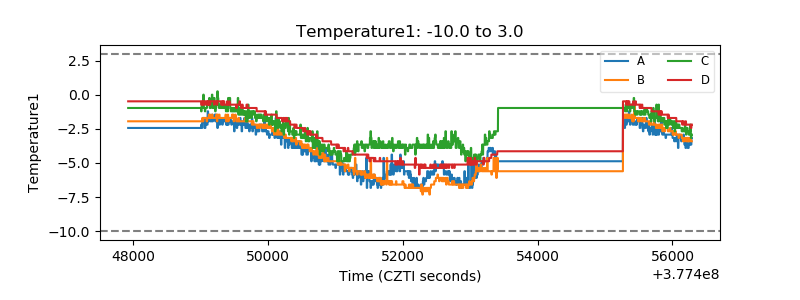 |
| Veto HV Monitor | 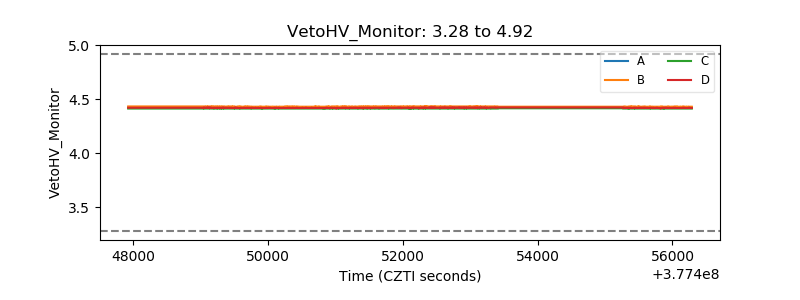 |
| Veto LLD | 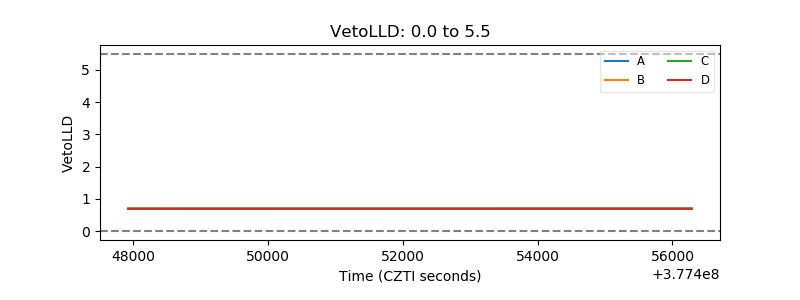 |
| Alpha Counter | 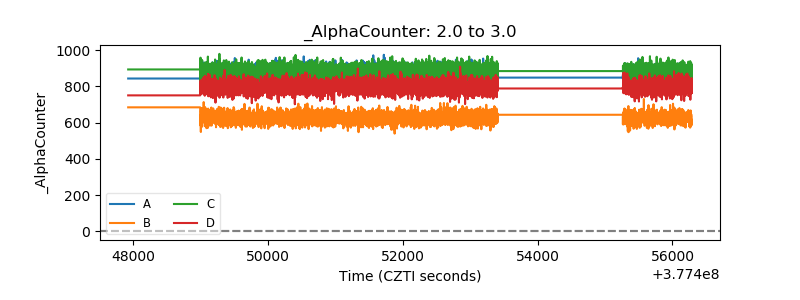 |
| _CPM_Rate | 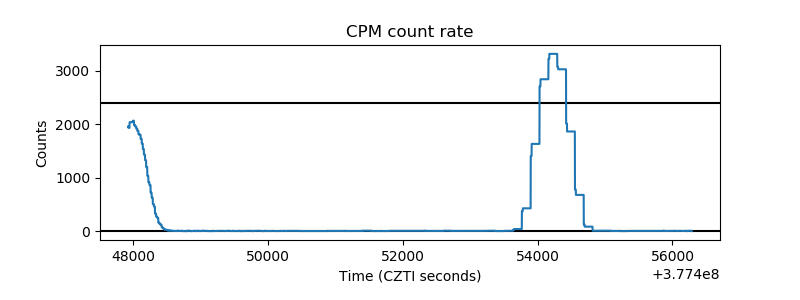 |
| CZT Counter | 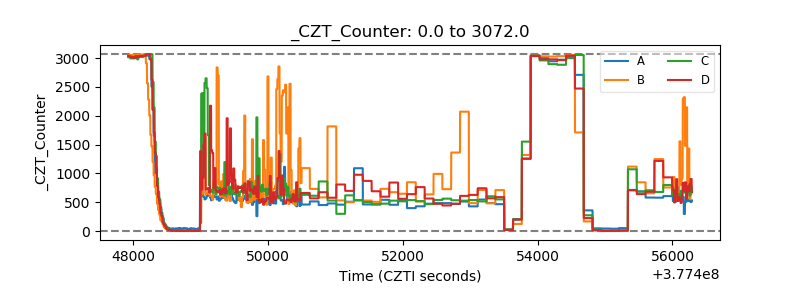 |
| +2.5 Volts monitor |  |
| +5 Volts monitor | 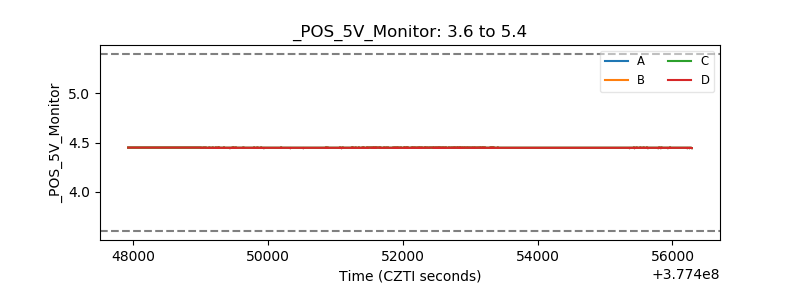 |
| _ROLL_ROT | 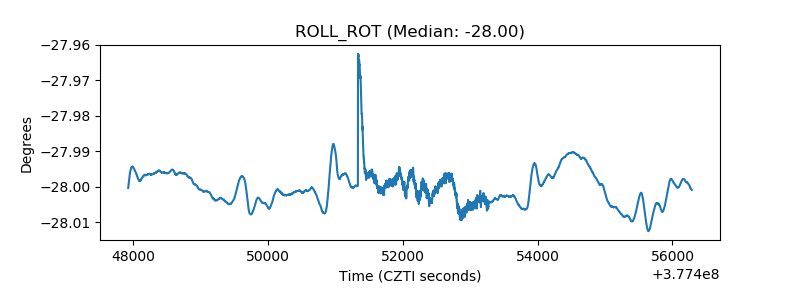 |
| _Roll_DEC | 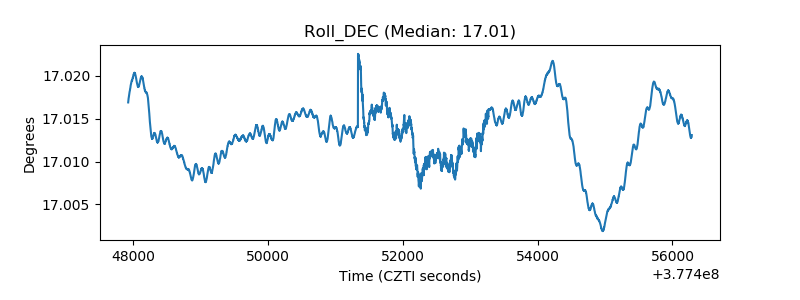 |
| _Roll_RA | 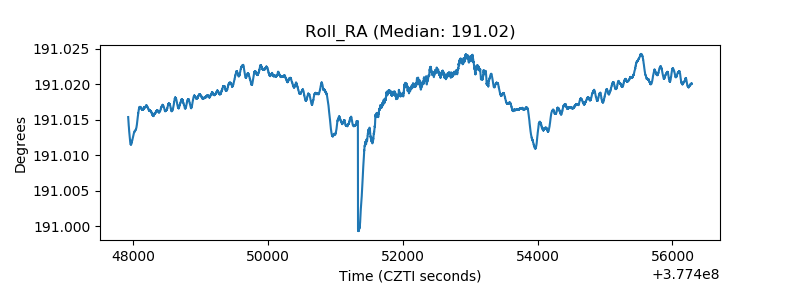 |
| Veto Counter | 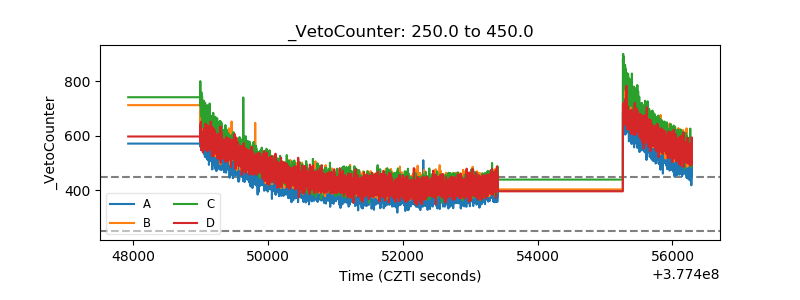 |