| Param | Original file | Final file |
|---|---|---|
| Filename | modeM0/AS1T04_076T01_9000004810_33640cztM0_level2.evt | modeM0/AS1T04_076T01_9000004810_33640cztM0_level2_quad_clean.evt |
| Size (bytes) | 466,191,360 | 77,788,800 |
| Size | 444.6 MB | 74.2 MB |
| Events in quadrant A | 2,605,411 | 503,831 |
| Events in quadrant B | 4,043,183 | 509,807 |
| Events in quadrant C | 3,355,183 | 511,578 |
| Events in quadrant D | 3,776,913 | 480,837 |
| Mode SS | |||
|---|---|---|---|
| Quadrant | BADHDUFLAG | Total packets | Discarded packets |
| A | 0 | 102 | 0 |
| B | 0 | 102 | 0 |
| C | 0 | 102 | 0 |
| D | 0 | 102 | 0 |
| Mode M9 | |||
|---|---|---|---|
| Quadrant | BADHDUFLAG | Total packets | Discarded packets |
| A | 0 | 21 | 0 |
| B | 0 | 21 | 0 |
| C | 0 | 21 | 0 |
| D | 0 | 21 | 0 |
| Mode M0 | |||
|---|---|---|---|
| Quadrant | BADHDUFLAG | Total packets | Discarded packets |
| A | 0 | 10770 | 3 |
| B | 0 | 15208 | 2 |
| C | 0 | 13499 | 2 |
| D | 0 | 14934 | 2 |
| Quadrant | Total seconds | Saturated seconds | Saturation percentage |
|---|---|---|---|
| A | 4983 | 2 | 0.040136% |
| B | 4983 | 489 | 9.813365% |
| C | 4983 | 100 | 2.006823% |
| D | 4983 | 113 | 2.267710% |
Noise dominated data is calculated using 1-second bins in cleaned event files. If a bin has >2000 counts, and if more than 50% of those come from <1% of pixels, then it is considered to be noise-dominated and hence unusable.
| Quadrant | # 1 sec bins | Bins with >0 counts | Bins with >2000 counts | High rate bins dominated by noise | Noise dominated (total time) | Noise dominated (detector-on time) | Marked lightcurve |
|---|---|---|---|---|---|---|---|
| A | 7075 | 4984 | 0 | 0 | 0.00% | 0.00% | 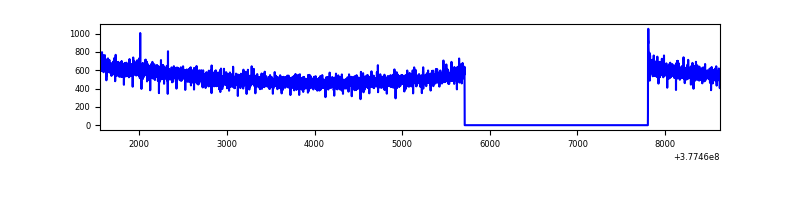 |
| B | 7075 | 4984 | 375 | 375 | 5.30% | 7.52% | 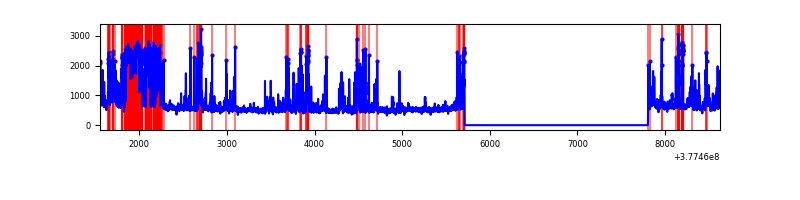 |
| C | 7075 | 4984 | 83 | 83 | 1.17% | 1.67% | 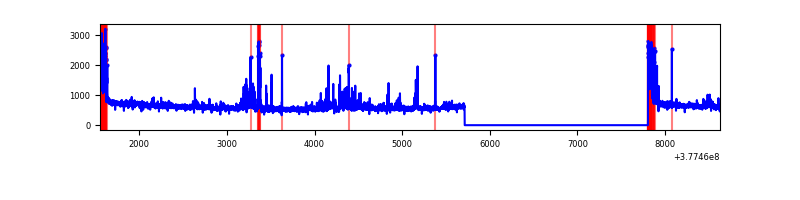 |
| D | 7075 | 4984 | 113 | 113 | 1.60% | 2.27% |  |
Top three noisy pixels from each quadrant. If the there are fewer than three noisy pixels in the level2.evt file, extra rows are filled as -1
| Pixel properties | Quadrant properties | ||||||
|---|---|---|---|---|---|---|---|
| Quadrant | DetID | PixID | Counts | Sigma | Mean | Median | Sigma |
| A | 13 | 6 | 9286 | 64.8 | 671 | 662 | 133.1 |
| A | 13 | 254 | 7385 | 50.52 | 671 | 662 | 133.1 |
| A | 10 | 83 | 6993 | 47.57 | 671 | 662 | 133.1 |
| B | 5 | 172 | 1362936 | 11373.5 | 646 | 633 | 119.8 |
| B | 0 | 213 | 34152 | 279.84 | 646 | 633 | 119.8 |
| B | 4 | 81 | 25252 | 205.54 | 646 | 633 | 119.8 |
| C | 15 | 214 | 230423 | 1532.85 | 658 | 666 | 149.9 |
| C | 0 | 10 | 229447 | 1526.34 | 658 | 666 | 149.9 |
| C | 0 | 239 | 153761 | 1021.39 | 658 | 666 | 149.9 |
| D | 8 | 195 | 461197 | 2721.87 | 651 | 639 | 169.2 |
| D | 2 | 250 | 244691 | 1442.33 | 651 | 639 | 169.2 |
| D | 13 | 249 | 186285 | 1097.16 | 651 | 639 | 169.2 |
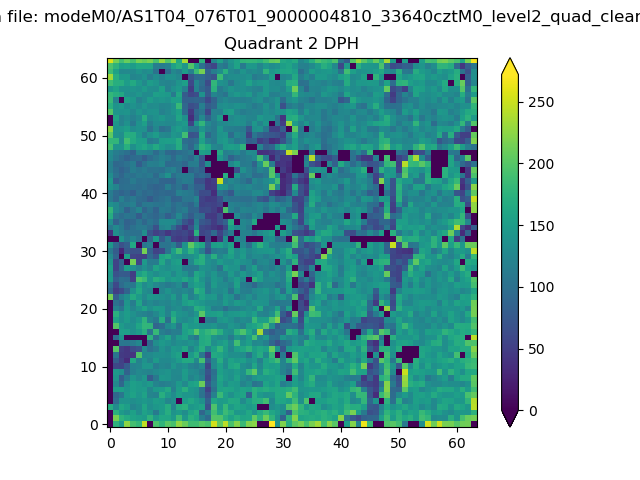
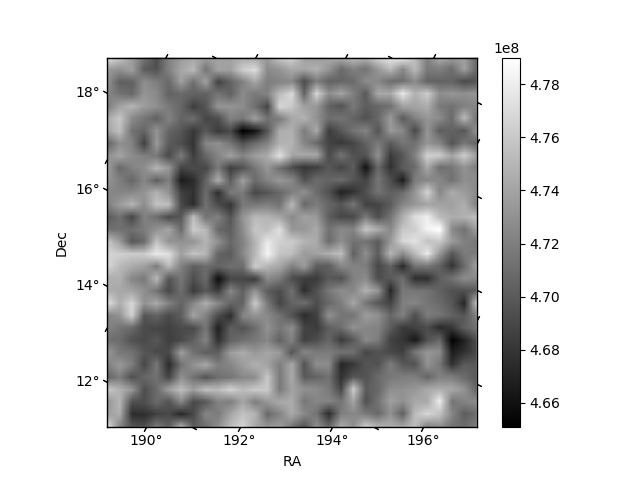
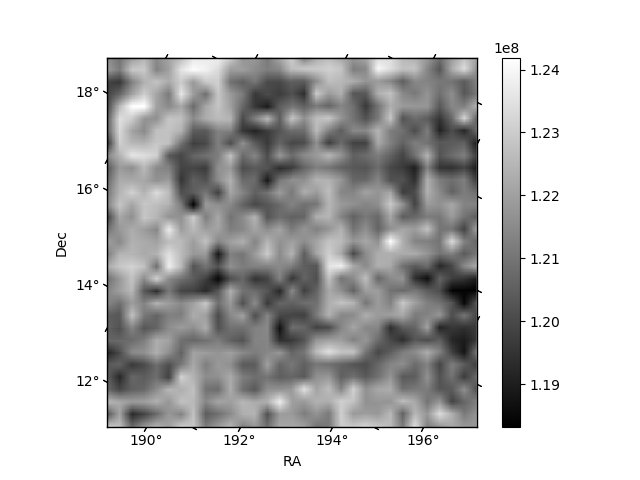
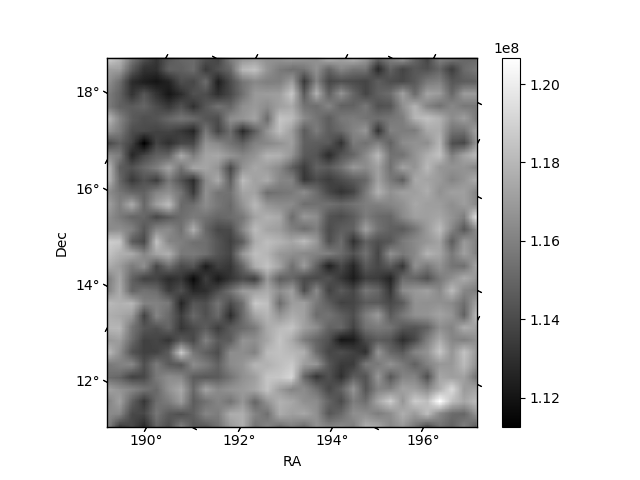
Histogram calculated using DETX and DETY for each event in the final _common_clean file
| Quadrant A | 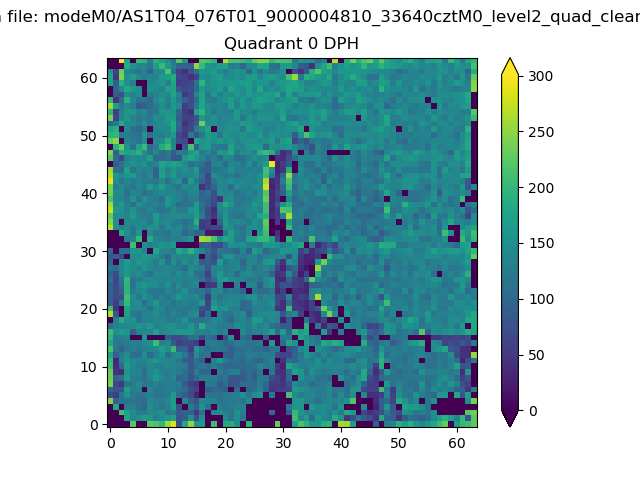 |
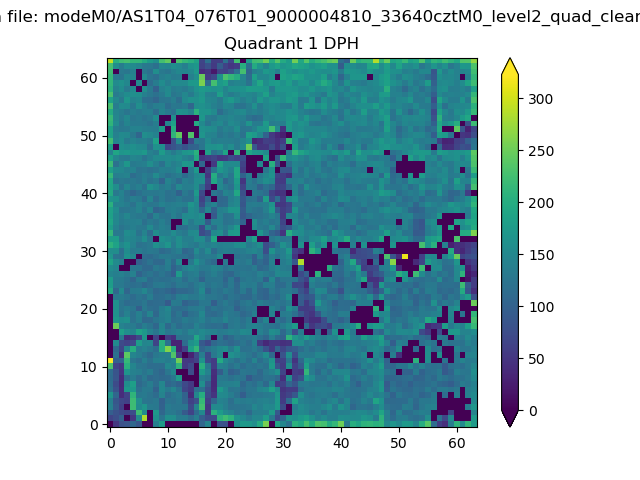 |
Quadrant B |
|---|---|---|---|
| Quadrant D | 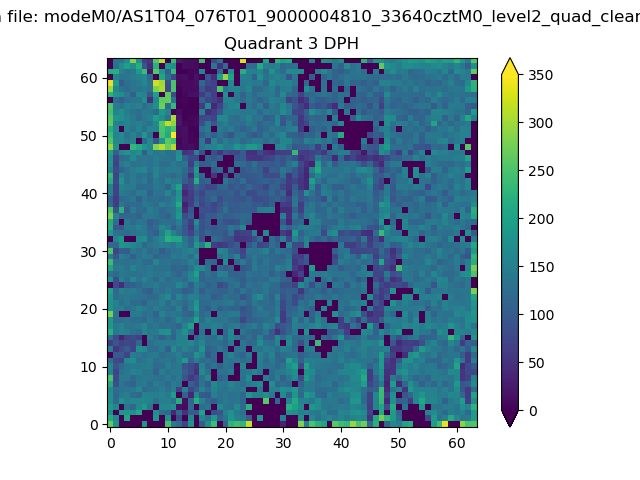 |
 |
Quadrant C |
| Plot type | Count rate plots | Images |
|---|---|---|
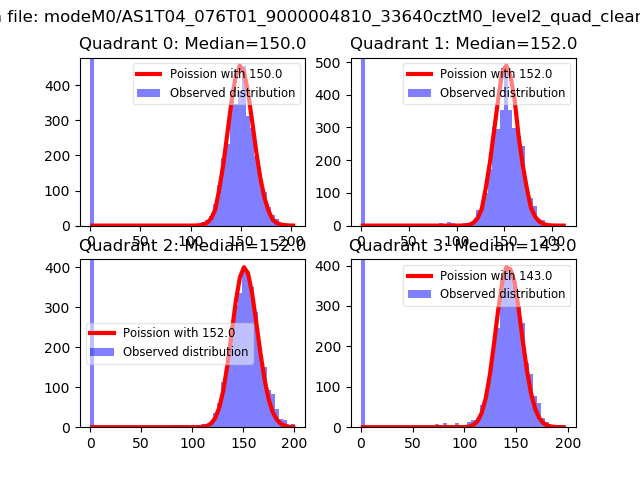
| Comparison with Poisson distribution Blue bars denote a histogram of data divided into 1 sec bins. Red curve is a Poisson curve with rate = median count rate of data. |
 |
 |
| Quadrant-wise count rates Data is divided into 100 sec bins |
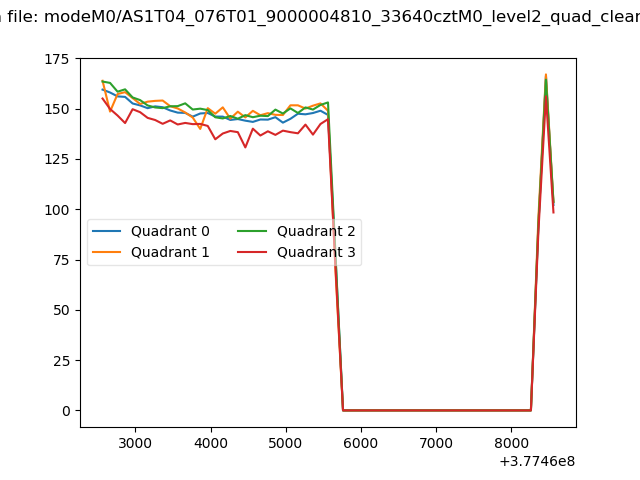 |
|
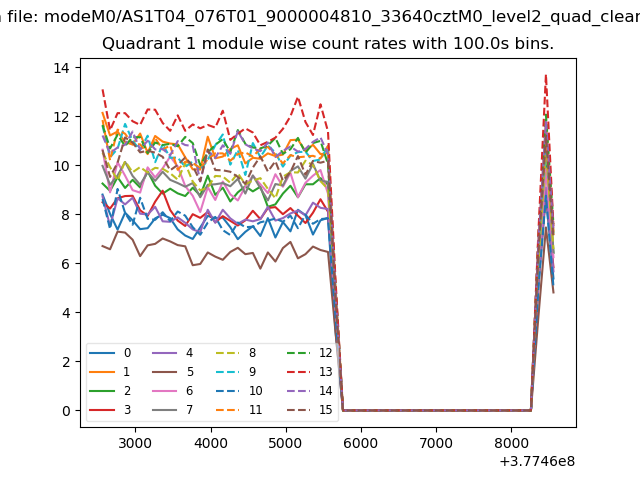
| Module-wise count rates for Quadrant A Data is divided into 100 sec bins |
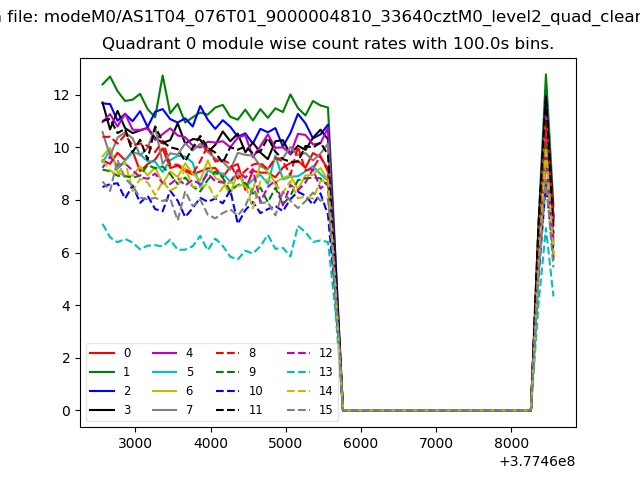 |
 |
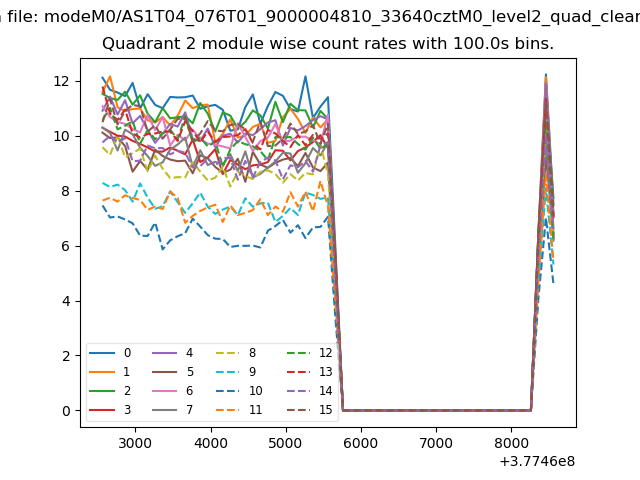
| Module-wise count rates for Quadrant B Data is divided into 100 sec bins |
 |
 |
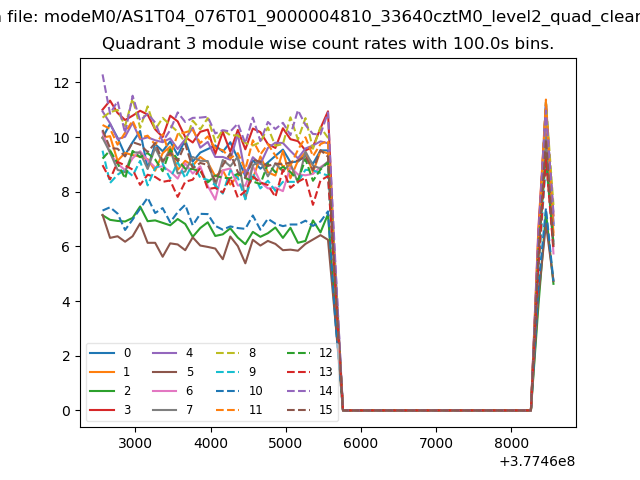
| Module-wise count rates for Quadrant C Data is divided into 100 sec bins |
 |
 |
| Module-wise count rates for Quadrant D Data is divided into 100 sec bins |
 |
 |
| Parameter | Plot |
|---|---|
| CZT HV Monitor | 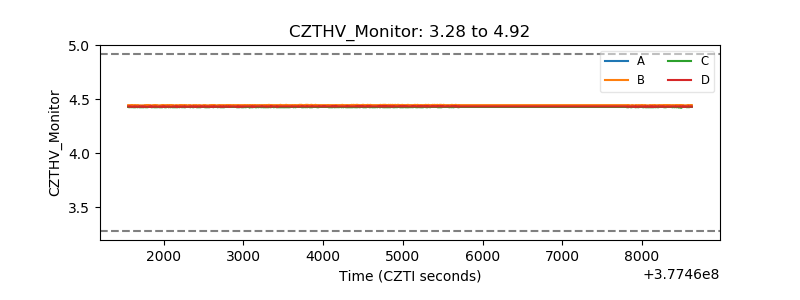 |
| D_VDD | 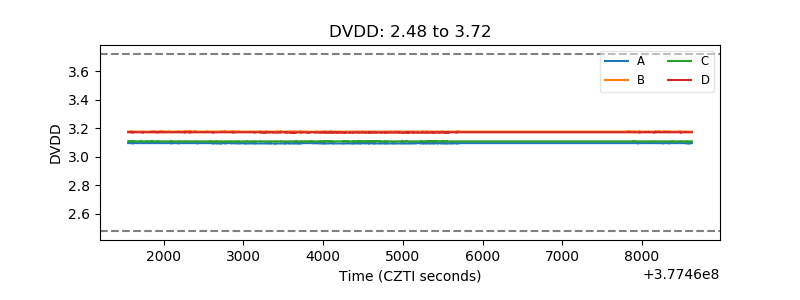 |
| Temperature 1 | 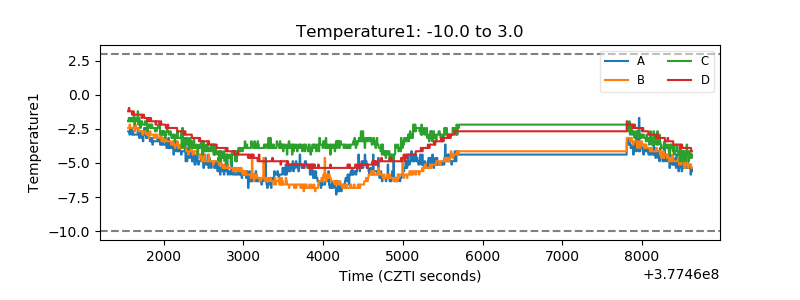 |
| Veto HV Monitor | 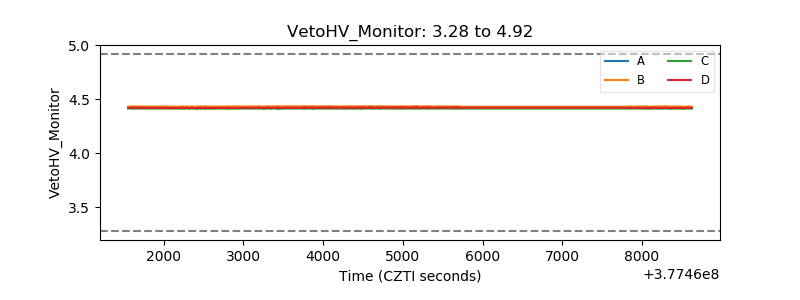 |
| Veto LLD | 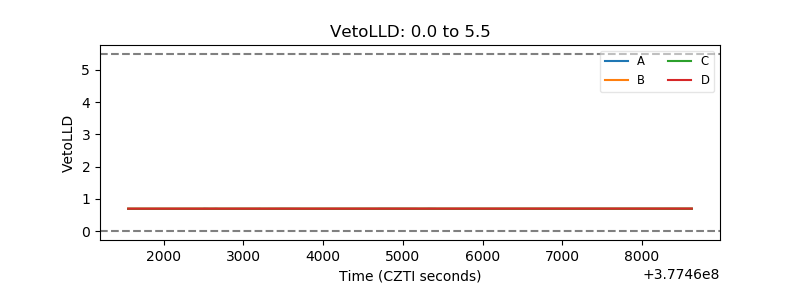 |
| Alpha Counter | 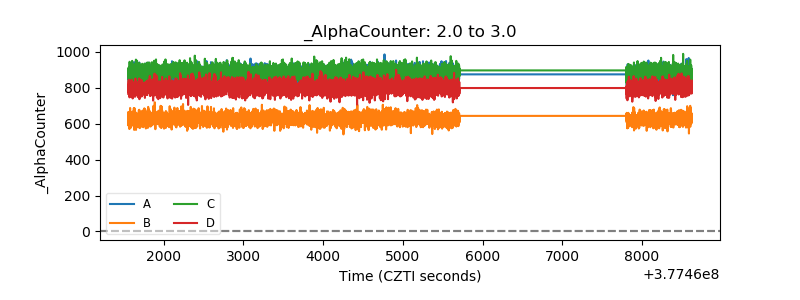 |
| _CPM_Rate | 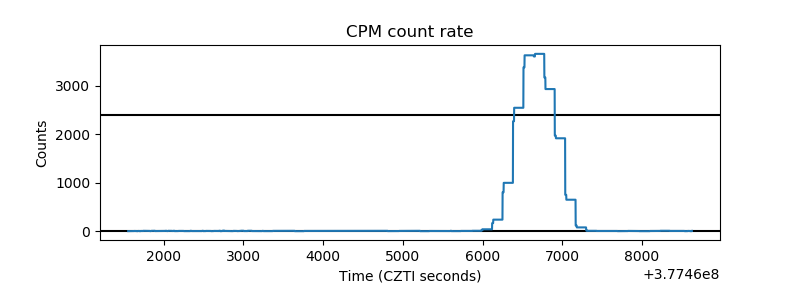 |
| CZT Counter | 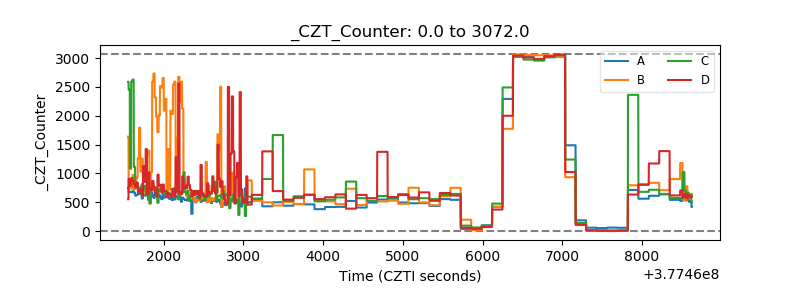 |
| +2.5 Volts monitor | 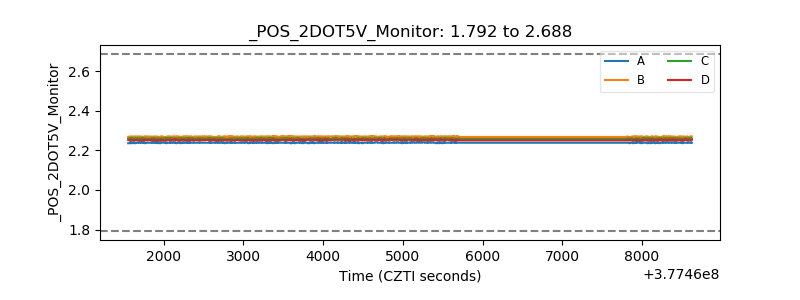 |
| +5 Volts monitor |  |
| _ROLL_ROT | 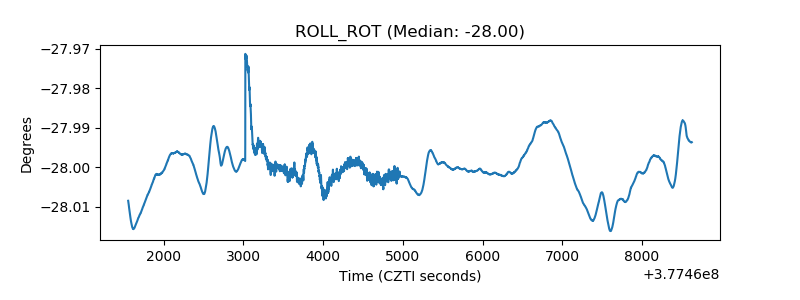 |
| _Roll_DEC | 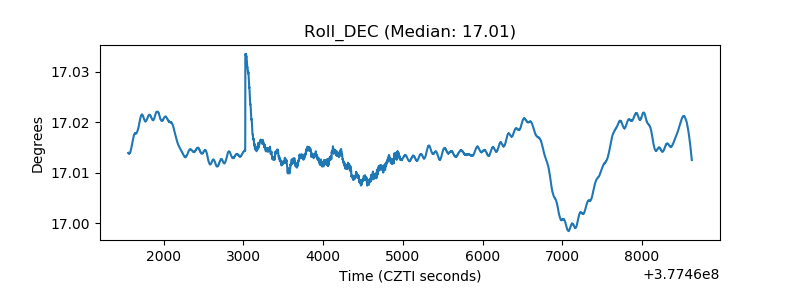 |
| _Roll_RA | 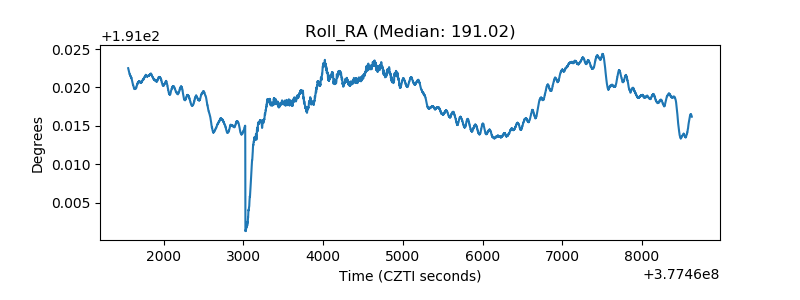 |
| Veto Counter | 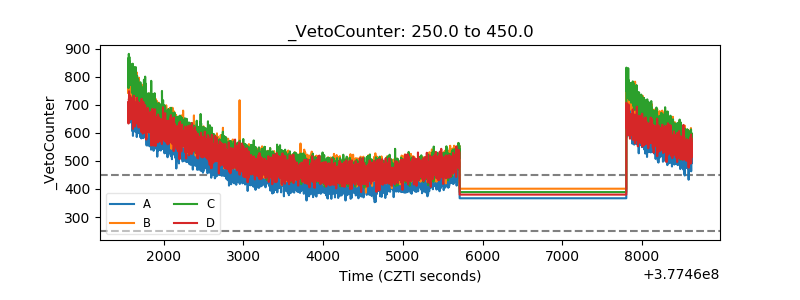 |