| Param | Original file | Final file |
|---|---|---|
| Filename | modeM0/AS1T04_076T01_9000004810_33641cztM0_level2.evt | modeM0/AS1T04_076T01_9000004810_33641cztM0_level2_quad_clean.evt |
| Size (bytes) | 451,730,880 | 92,292,480 |
| Size | 430.8 MB | 88.0 MB |
| Events in quadrant A | 2,507,705 | 622,606 |
| Events in quadrant B | 3,978,628 | 613,154 |
| Events in quadrant C | 3,209,019 | 627,296 |
| Events in quadrant D | 3,650,370 | 585,576 |
| Mode SS | |||
|---|---|---|---|
| Quadrant | BADHDUFLAG | Total packets | Discarded packets |
| A | 0 | 100 | 0 |
| B | 0 | 100 | 0 |
| C | 0 | 100 | 0 |
| D | 0 | 100 | 0 |
| Mode M9 | |||
|---|---|---|---|
| Quadrant | BADHDUFLAG | Total packets | Discarded packets |
| A | 0 | 28 | 0 |
| B | 0 | 28 | 0 |
| C | 0 | 28 | 0 |
| D | 0 | 29 | 0 |
| Mode M0 | |||
|---|---|---|---|
| Quadrant | BADHDUFLAG | Total packets | Discarded packets |
| A | 0 | 10364 | 3 |
| B | 0 | 15154 | 2 |
| C | 0 | 12743 | 2 |
| D | 0 | 14519 | 2 |
| Quadrant | Total seconds | Saturated seconds | Saturation percentage |
|---|---|---|---|
| A | 4940 | 3 | 0.060729% |
| B | 4940 | 402 | 8.137652% |
| C | 4940 | 116 | 2.348178% |
| D | 4940 | 117 | 2.368421% |
Noise dominated data is calculated using 1-second bins in cleaned event files. If a bin has >2000 counts, and if more than 50% of those come from <1% of pixels, then it is considered to be noise-dominated and hence unusable.
| Quadrant | # 1 sec bins | Bins with >0 counts | Bins with >2000 counts | High rate bins dominated by noise | Noise dominated (total time) | Noise dominated (detector-on time) | Marked lightcurve |
|---|---|---|---|---|---|---|---|
| A | 7093 | 4941 | 0 | 0 | 0.00% | 0.00% | 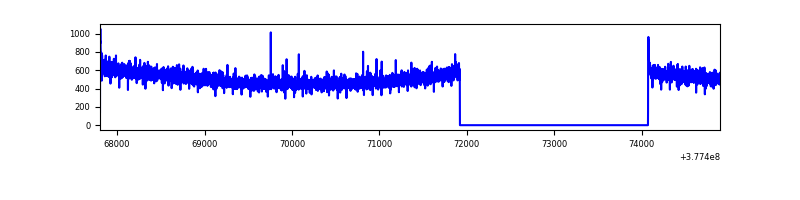 |
| B | 7093 | 4941 | 341 | 341 | 4.81% | 6.90% | 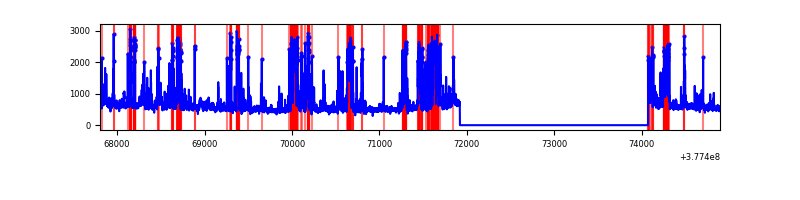 |
| C | 7093 | 4941 | 97 | 97 | 1.37% | 1.96% | 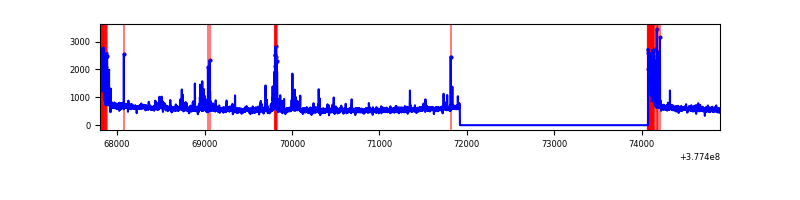 |
| D | 7093 | 4941 | 107 | 107 | 1.51% | 2.17% | 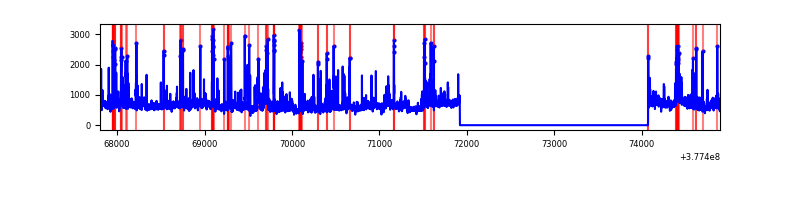 |
Top three noisy pixels from each quadrant. If the there are fewer than three noisy pixels in the level2.evt file, extra rows are filled as -1
| Pixel properties | Quadrant properties | ||||||
|---|---|---|---|---|---|---|---|
| Quadrant | DetID | PixID | Counts | Sigma | Mean | Median | Sigma |
| A | 13 | 6 | 9153 | 65.87 | 645 | 636 | 129.3 |
| A | 10 | 83 | 8351 | 59.66 | 645 | 636 | 129.3 |
| A | 13 | 254 | 8167 | 58.24 | 645 | 636 | 129.3 |
| B | 5 | 172 | 1183122 | 9994.85 | 631 | 618 | 118.3 |
| B | 0 | 213 | 87480 | 734.18 | 631 | 618 | 118.3 |
| B | 0 | 219 | 47703 | 397.98 | 631 | 618 | 118.3 |
| C | 0 | 10 | 288948 | 2009.58 | 628 | 637 | 143.5 |
| C | 15 | 214 | 227992 | 1584.7 | 628 | 637 | 143.5 |
| C | 3 | 233 | 192088 | 1334.45 | 628 | 637 | 143.5 |
| D | 8 | 195 | 472048 | 2888.42 | 619 | 606 | 163.2 |
| D | 13 | 249 | 226827 | 1386.01 | 619 | 606 | 163.2 |
| D | 2 | 249 | 152398 | 930.0 | 619 | 606 | 163.2 |
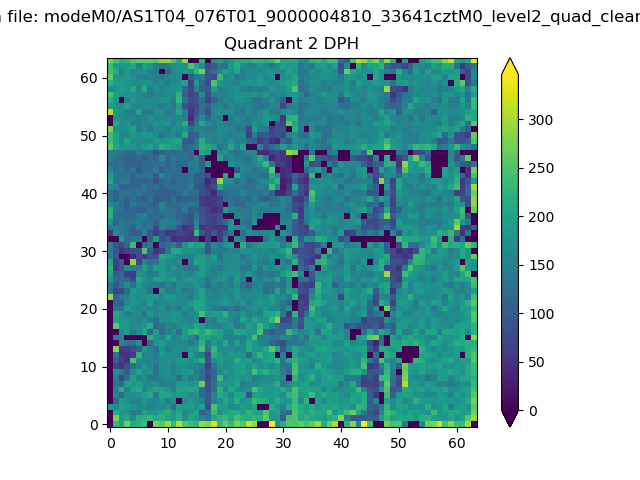
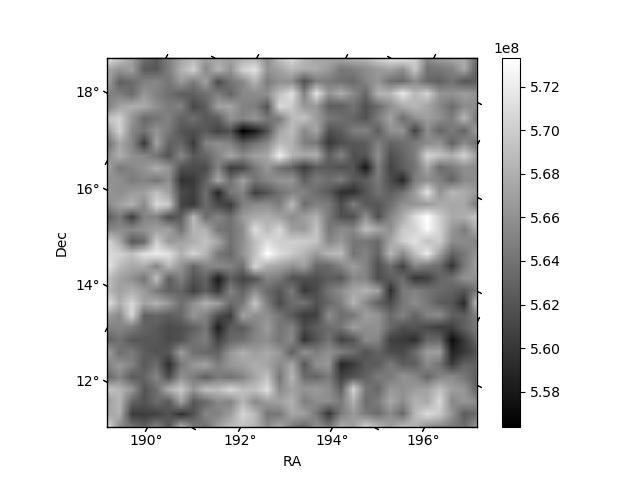
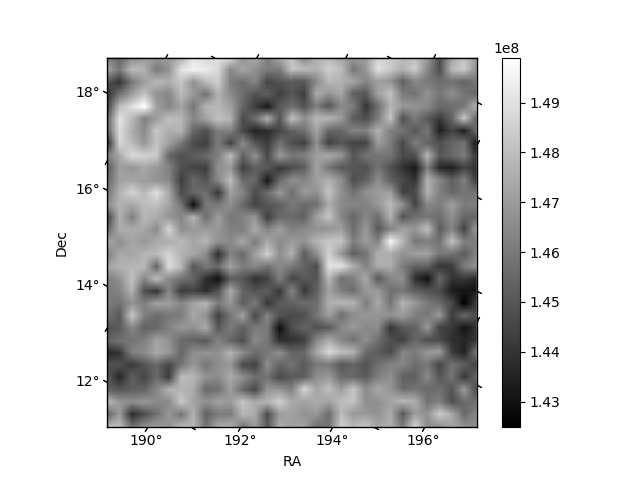
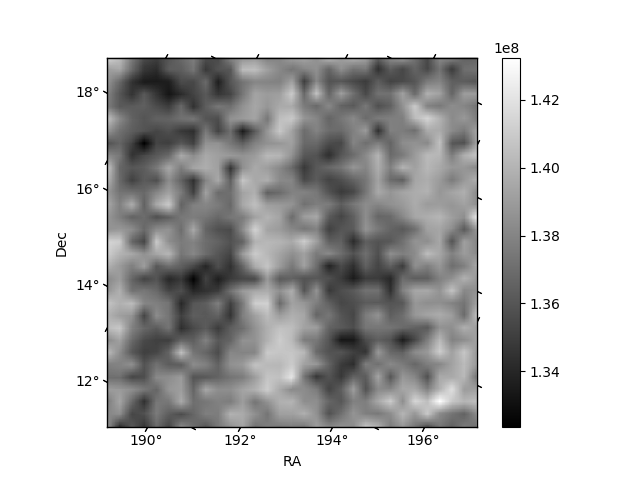
Histogram calculated using DETX and DETY for each event in the final _common_clean file
| Quadrant A | 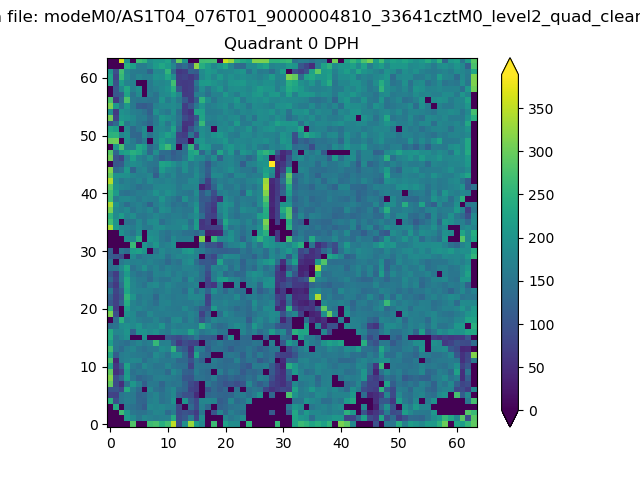 |
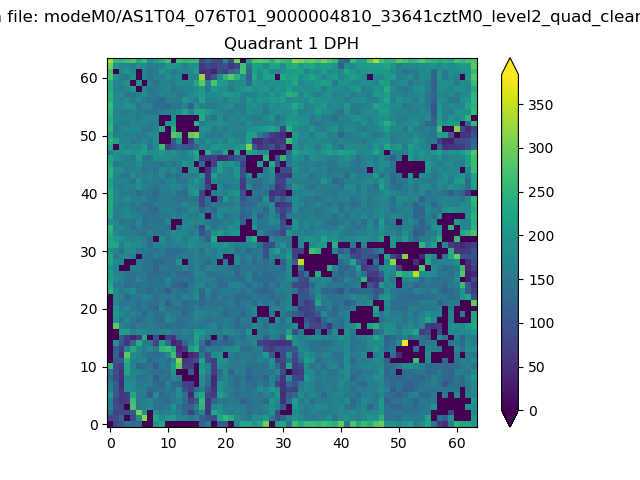 |
Quadrant B |
|---|---|---|---|
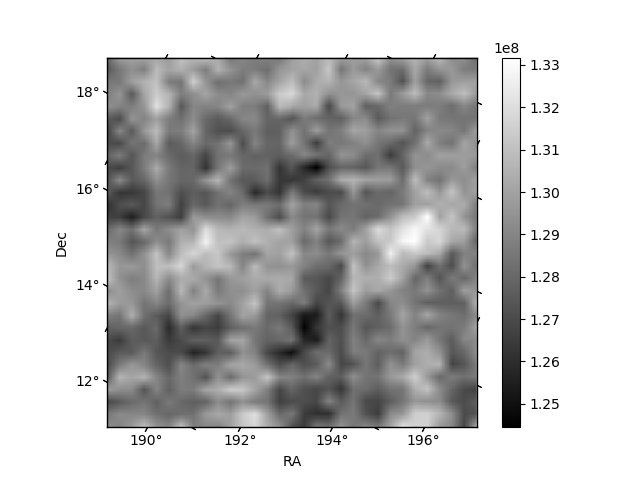
| Quadrant D | 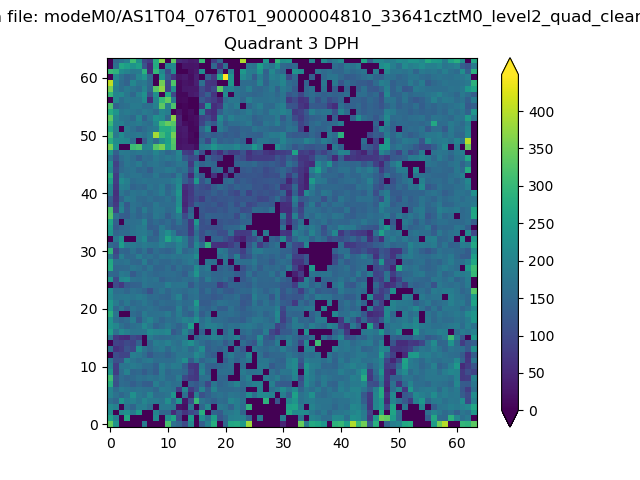 |
 |
Quadrant C |
| Plot type | Count rate plots | Images |
|---|---|---|
| Comparison with Poisson distribution Blue bars denote a histogram of data divided into 1 sec bins. Red curve is a Poisson curve with rate = median count rate of data. |
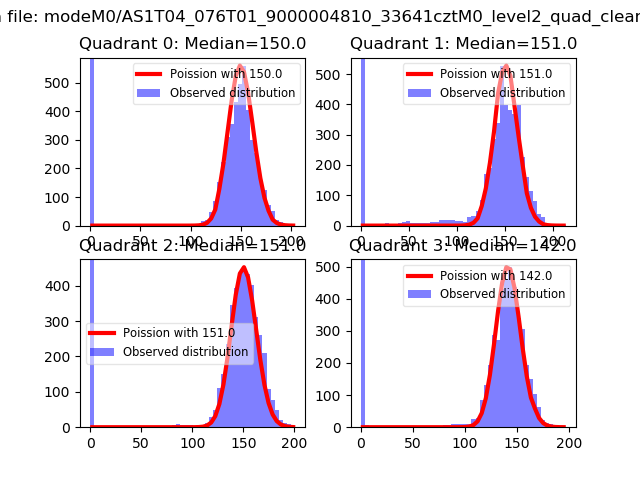 |
 |
| Quadrant-wise count rates Data is divided into 100 sec bins |
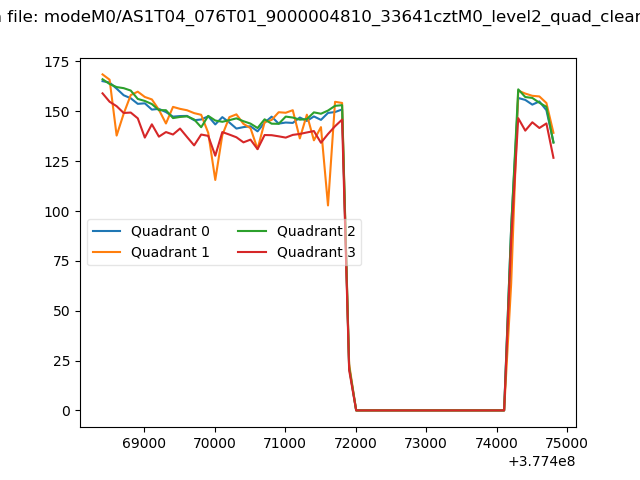 |
|
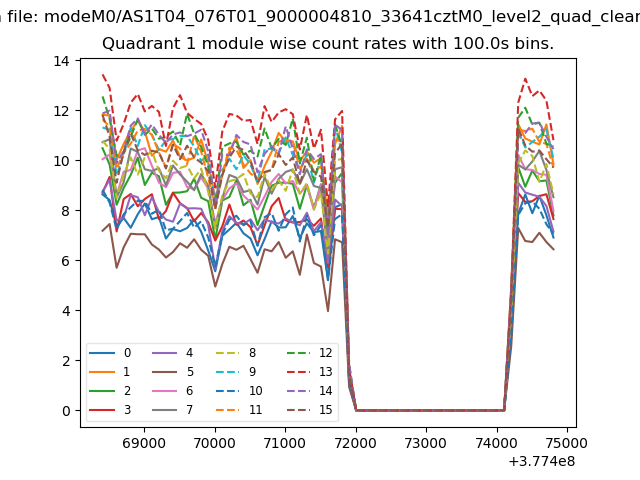
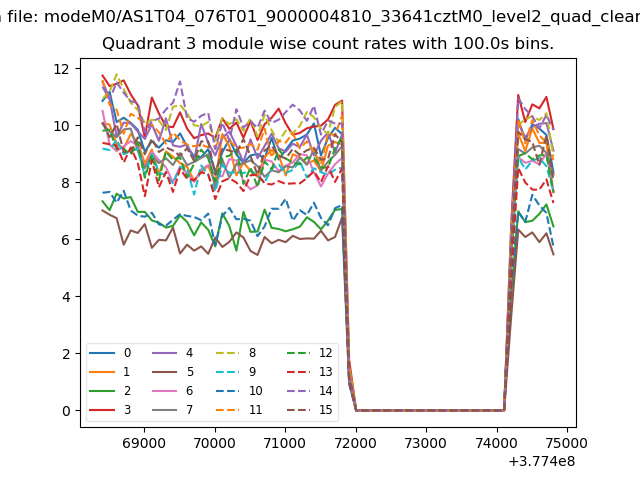
| Module-wise count rates for Quadrant A Data is divided into 100 sec bins |
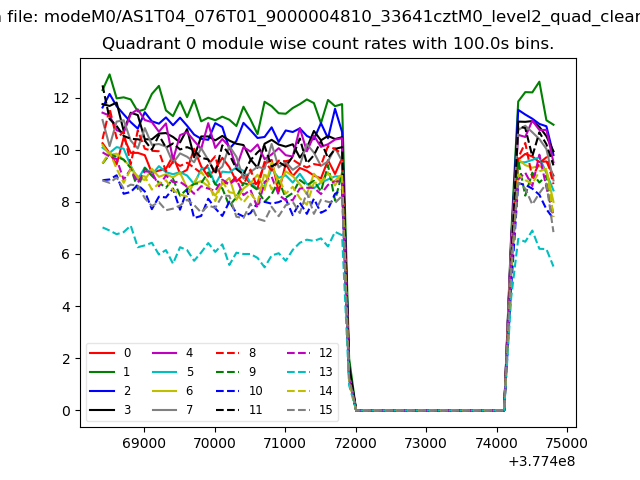 |
 |
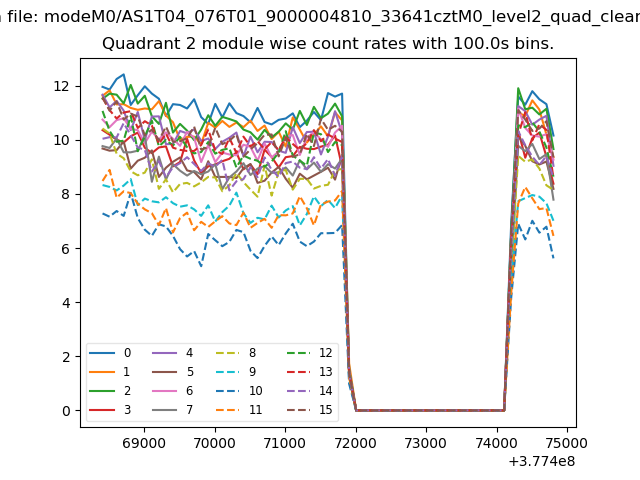
| Module-wise count rates for Quadrant B Data is divided into 100 sec bins |
 |
 |
| Module-wise count rates for Quadrant C Data is divided into 100 sec bins |
 |
 |
| Module-wise count rates for Quadrant D Data is divided into 100 sec bins |
 |
 |
| Parameter | Plot |
|---|---|
| CZT HV Monitor | 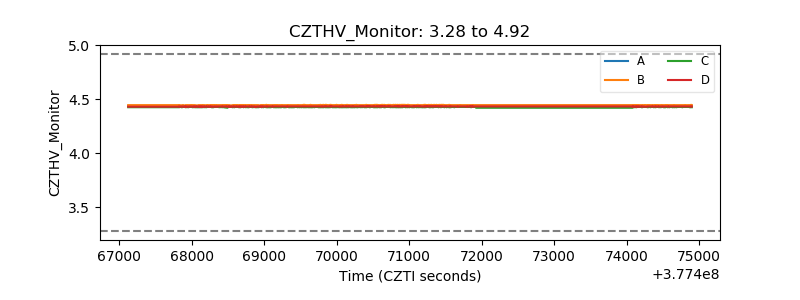 |
| D_VDD | 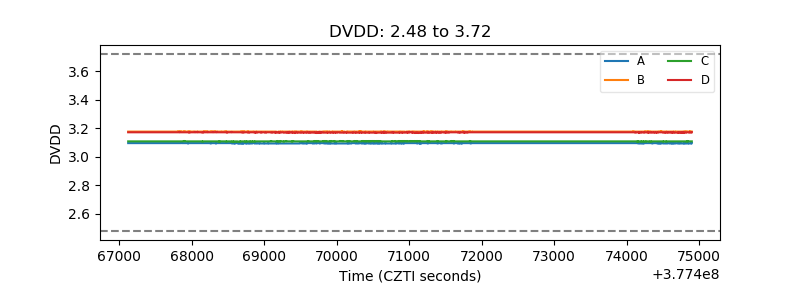 |
| Temperature 1 | 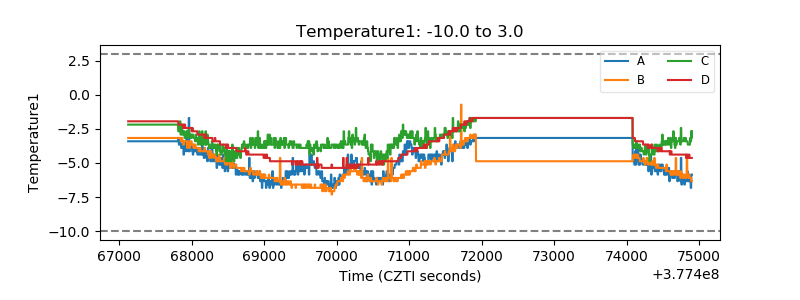 |
| Veto HV Monitor | 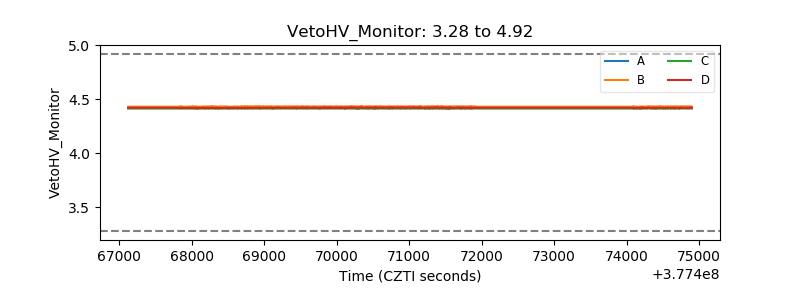 |
| Veto LLD | 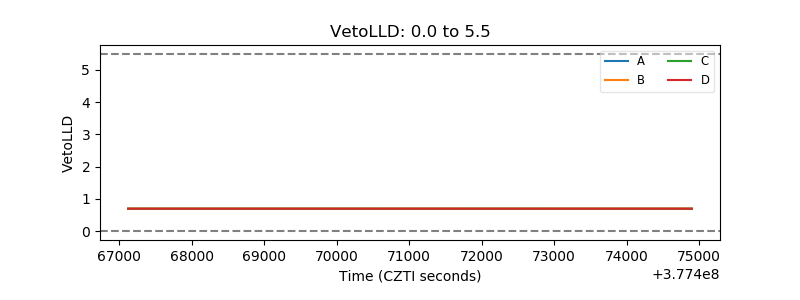 |
| Alpha Counter | 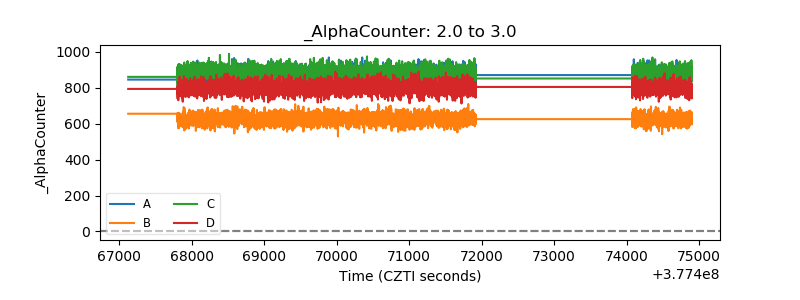 |
| _CPM_Rate | 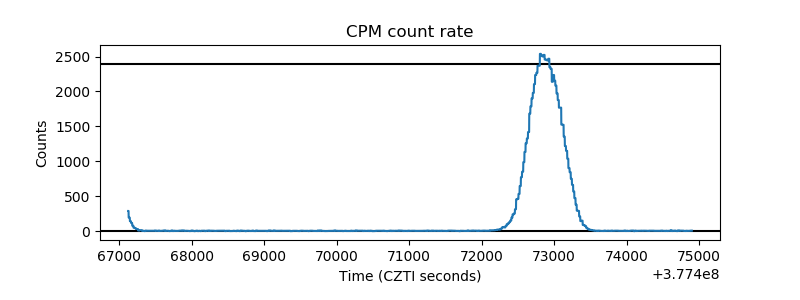 |
| CZT Counter | 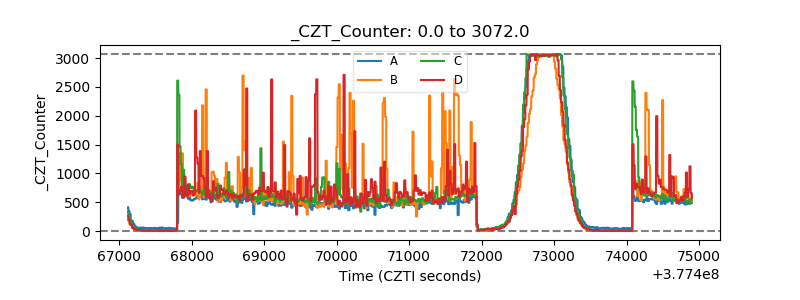 |
| +2.5 Volts monitor |  |
| +5 Volts monitor |  |
| _ROLL_ROT | 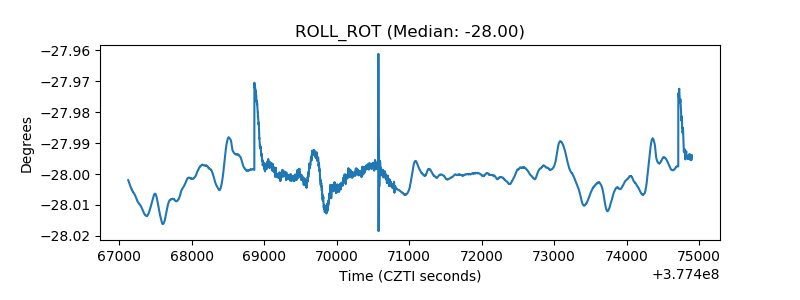 |
| _Roll_DEC | 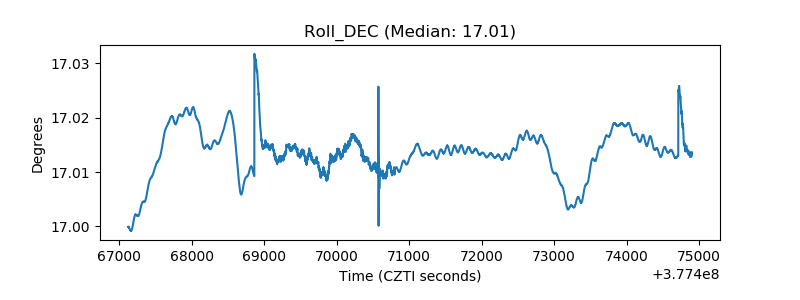 |
| _Roll_RA | 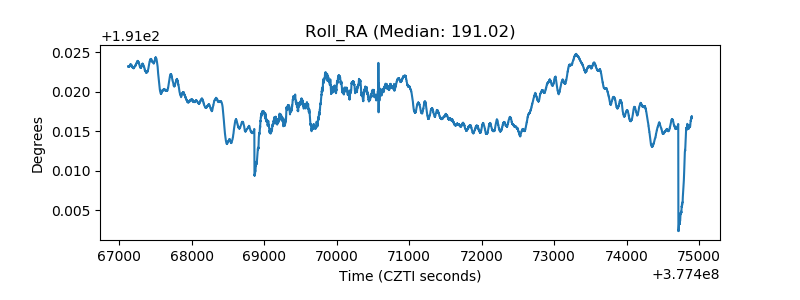 |
| Veto Counter | 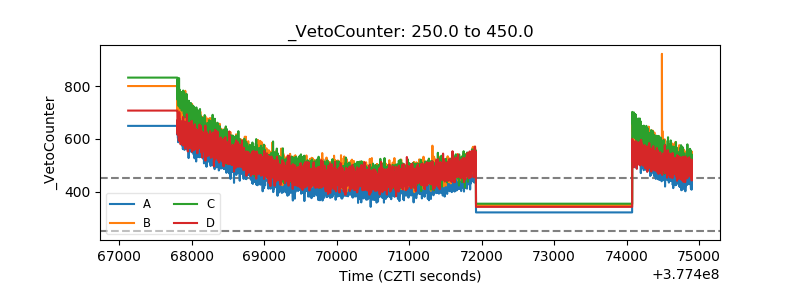 |