| Param | Original file | Final file |
|---|---|---|
| Filename | modeM0/AS1T04_076T01_9000004810_33643cztM0_level2.evt | modeM0/AS1T04_076T01_9000004810_33643cztM0_level2_quad_clean.evt |
| Size (bytes) | 423,835,200 | 82,180,800 |
| Size | 404.2 MB | 78.4 MB |
| Events in quadrant A | 2,365,434 | 543,461 |
| Events in quadrant B | 3,585,187 | 538,345 |
| Events in quadrant C | 3,254,668 | 538,320 |
| Events in quadrant D | 3,283,782 | 510,482 |
| Mode SS | |||
|---|---|---|---|
| Quadrant | BADHDUFLAG | Total packets | Discarded packets |
| A | 0 | 104 | 0 |
| B | 0 | 104 | 0 |
| C | 0 | 104 | 0 |
| D | 0 | 104 | 0 |
| Mode M9 | |||
|---|---|---|---|
| Quadrant | BADHDUFLAG | Total packets | Discarded packets |
| A | 0 | 27 | 0 |
| B | 0 | 27 | 0 |
| C | 0 | 27 | 0 |
| D | 0 | 28 | 0 |
| Mode M0 | |||
|---|---|---|---|
| Quadrant | BADHDUFLAG | Total packets | Discarded packets |
| A | 0 | 10332 | 3 |
| B | 0 | 13945 | 2 |
| C | 0 | 12872 | 2 |
| D | 0 | 13019 | 2 |
| Quadrant | Total seconds | Saturated seconds | Saturation percentage |
|---|---|---|---|
| A | 5108 | 7 | 0.137040% |
| B | 5108 | 282 | 5.520752% |
| C | 5108 | 114 | 2.231793% |
| D | 5108 | 112 | 2.192639% |
Noise dominated data is calculated using 1-second bins in cleaned event files. If a bin has >2000 counts, and if more than 50% of those come from <1% of pixels, then it is considered to be noise-dominated and hence unusable.
| Quadrant | # 1 sec bins | Bins with >0 counts | Bins with >2000 counts | High rate bins dominated by noise | Noise dominated (total time) | Noise dominated (detector-on time) | Marked lightcurve |
|---|---|---|---|---|---|---|---|
| A | 7051 | 5109 | 0 | 0 | 0.00% | 0.00% | 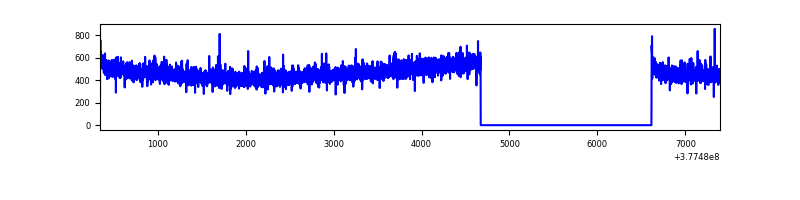 |
| B | 7051 | 5108 | 223 | 223 | 3.16% | 4.37% | 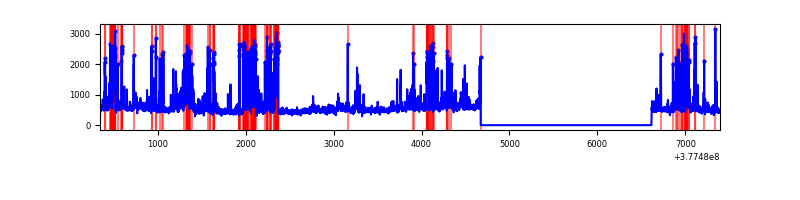 |
| C | 7051 | 5108 | 92 | 92 | 1.30% | 1.80% | 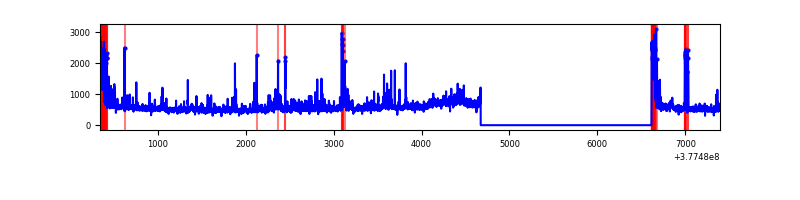 |
| D | 7051 | 5109 | 106 | 106 | 1.50% | 2.07% | 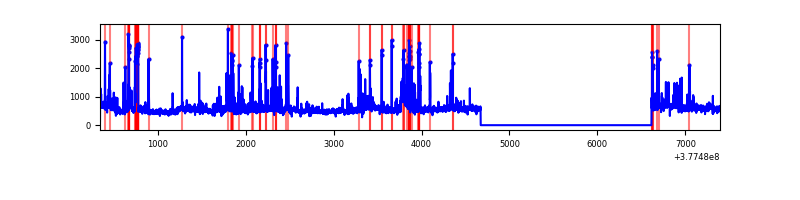 |
Top three noisy pixels from each quadrant. If the there are fewer than three noisy pixels in the level2.evt file, extra rows are filled as -1
| Pixel properties | Quadrant properties | ||||||
|---|---|---|---|---|---|---|---|
| Quadrant | DetID | PixID | Counts | Sigma | Mean | Median | Sigma |
| A | 13 | 254 | 7641 | 58.02 | 608 | 597 | 121.4 |
| A | 10 | 83 | 7526 | 57.07 | 608 | 597 | 121.4 |
| A | 13 | 6 | 6999 | 52.73 | 608 | 597 | 121.4 |
| B | 5 | 172 | 898305 | 7822.45 | 597 | 582 | 114.8 |
| B | 0 | 213 | 73174 | 632.54 | 597 | 582 | 114.8 |
| B | 0 | 219 | 53215 | 458.63 | 597 | 582 | 114.8 |
| C | 0 | 10 | 298776 | 2177.87 | 590 | 595 | 136.9 |
| C | 3 | 233 | 277231 | 2020.51 | 590 | 595 | 136.9 |
| C | 15 | 214 | 236209 | 1720.89 | 590 | 595 | 136.9 |
| D | 8 | 195 | 404641 | 2775.33 | 583 | 568 | 145.6 |
| D | 13 | 249 | 239156 | 1638.72 | 583 | 568 | 145.6 |
| D | 7 | 38 | 129657 | 886.63 | 583 | 568 | 145.6 |
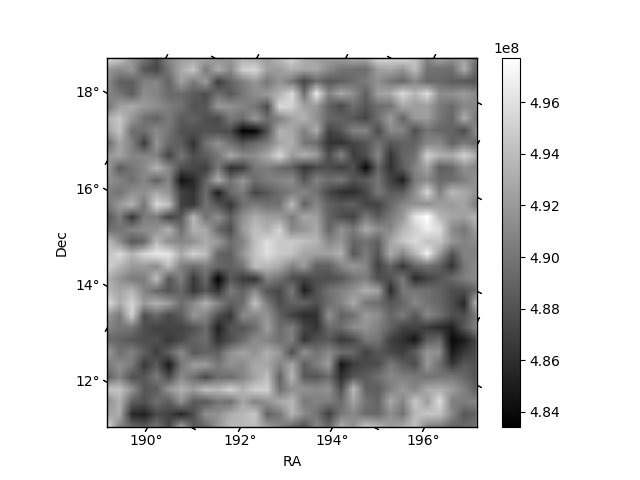
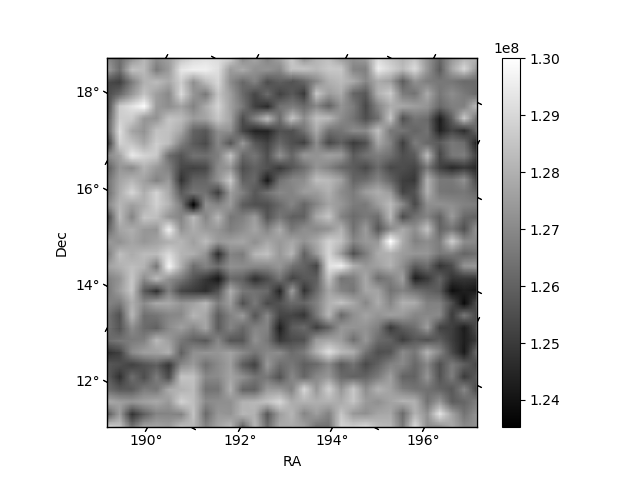
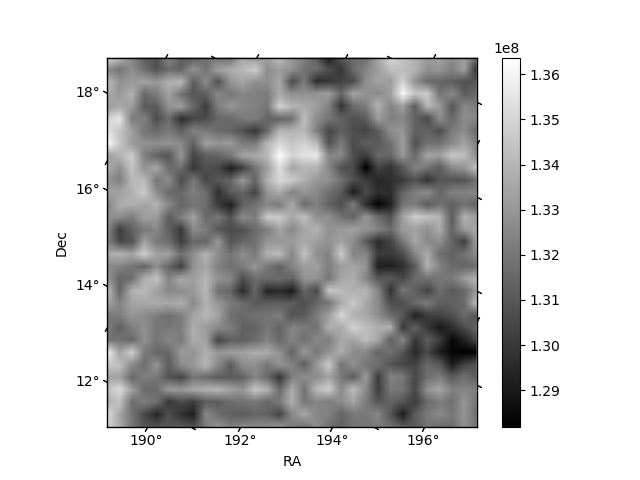
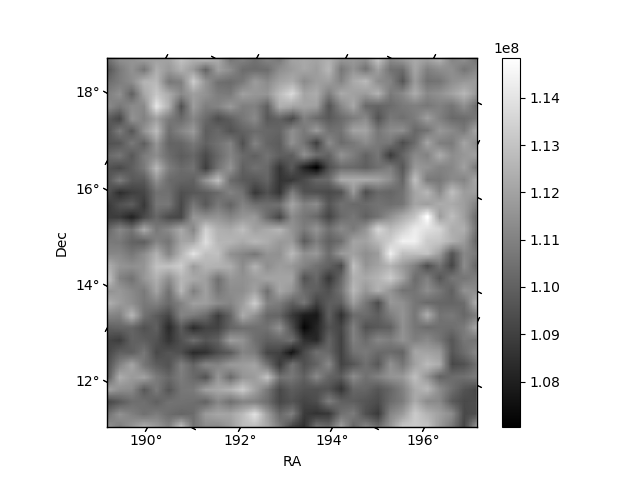
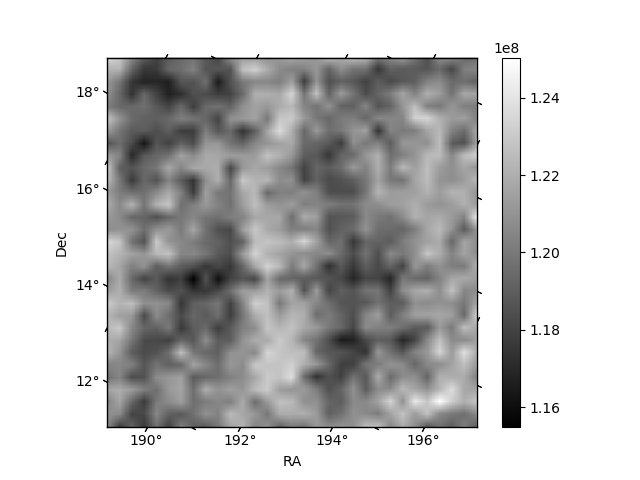
Histogram calculated using DETX and DETY for each event in the final _common_clean file
| Quadrant A | 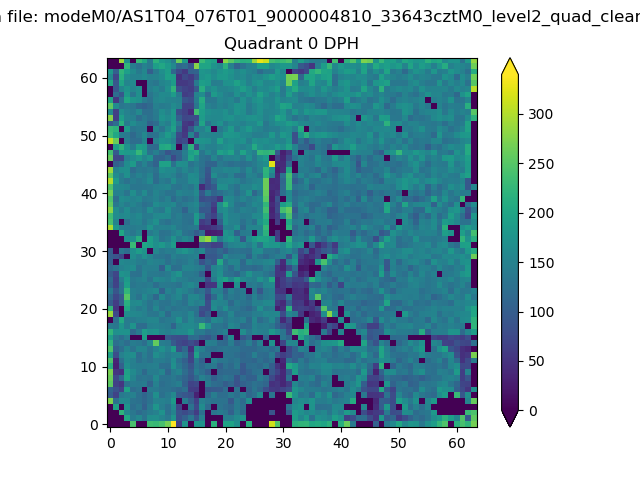 |
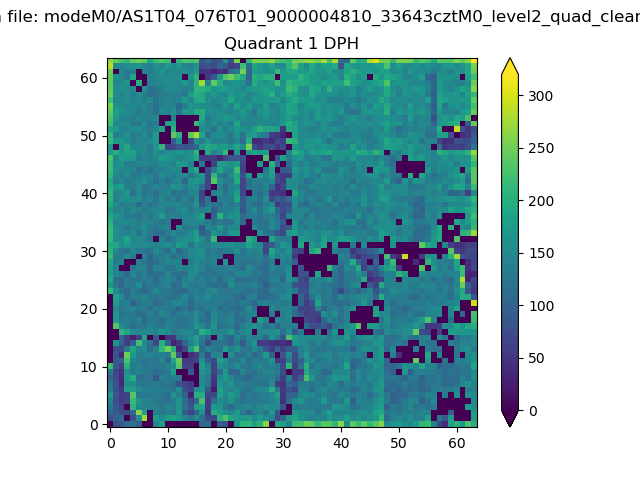 |
Quadrant B |
|---|---|---|---|
| Quadrant D | 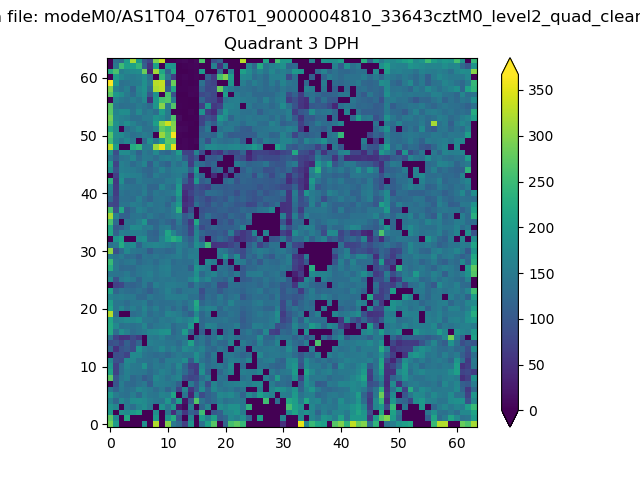 |
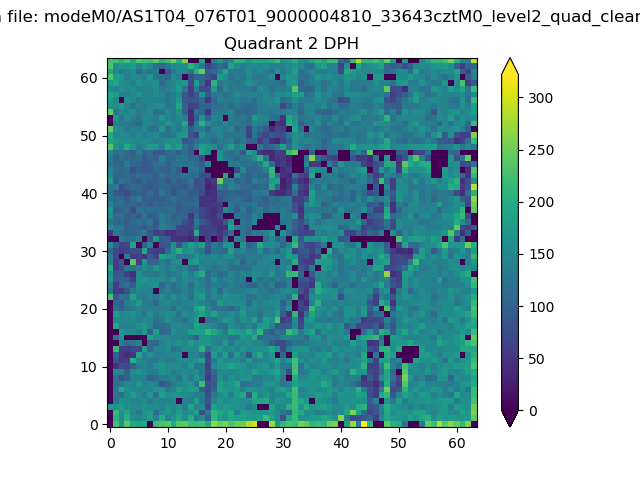 |
Quadrant C |
| Plot type | Count rate plots | Images |
|---|---|---|
| Comparison with Poisson distribution Blue bars denote a histogram of data divided into 1 sec bins. Red curve is a Poisson curve with rate = median count rate of data. |
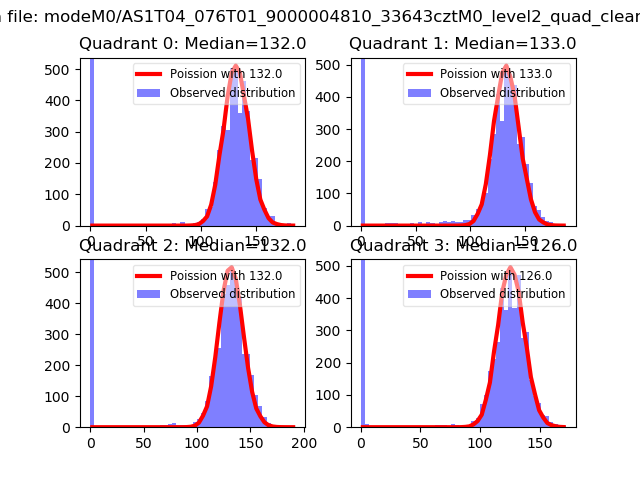 |
 |
| Quadrant-wise count rates Data is divided into 100 sec bins |
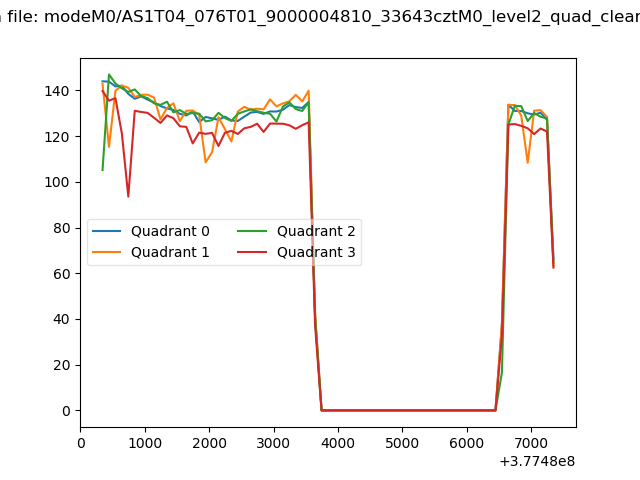 |
|
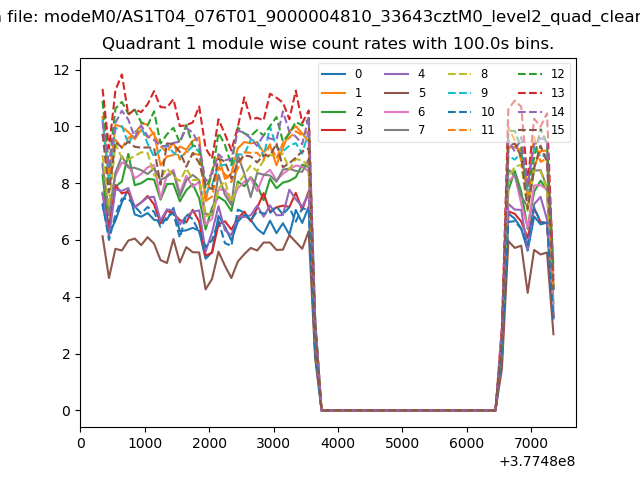
| Module-wise count rates for Quadrant A Data is divided into 100 sec bins |
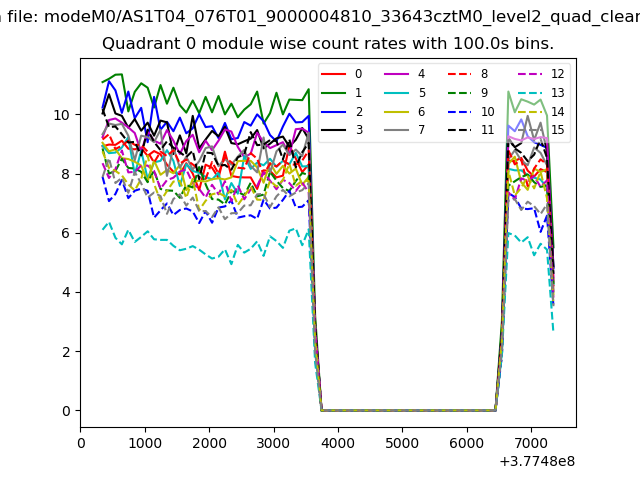 |
 |
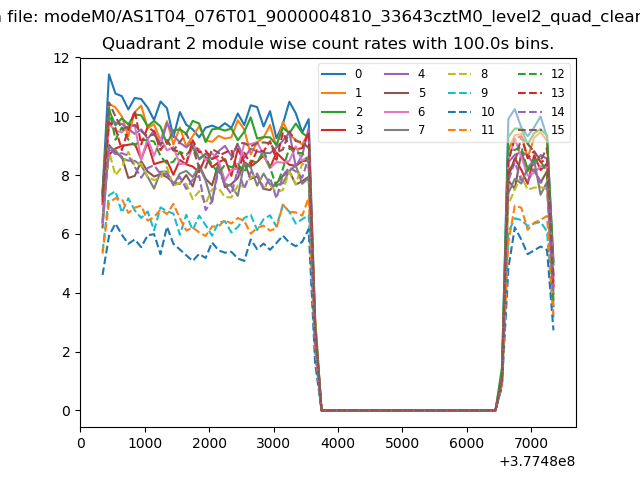
| Module-wise count rates for Quadrant B Data is divided into 100 sec bins |
 |
 |
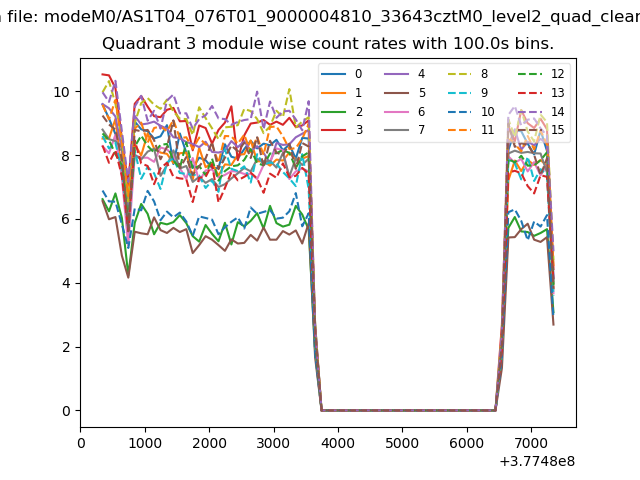
| Module-wise count rates for Quadrant C Data is divided into 100 sec bins |
 |
 |
| Module-wise count rates for Quadrant D Data is divided into 100 sec bins |
 |
 |
| Parameter | Plot |
|---|---|
| CZT HV Monitor | 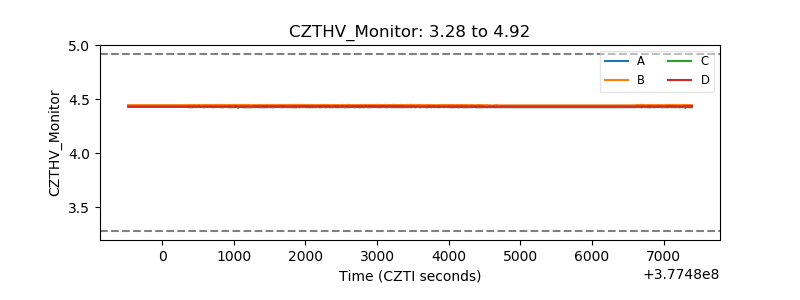 |
| D_VDD | 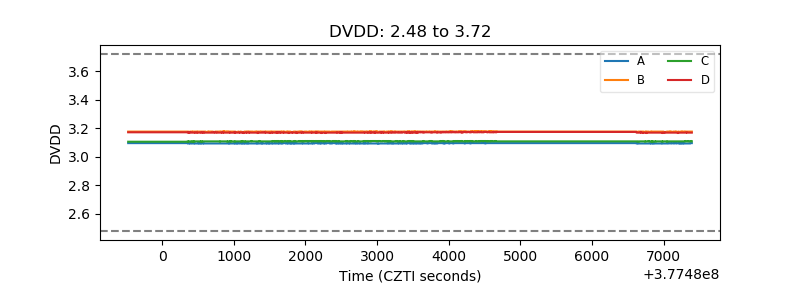 |
| Temperature 1 | 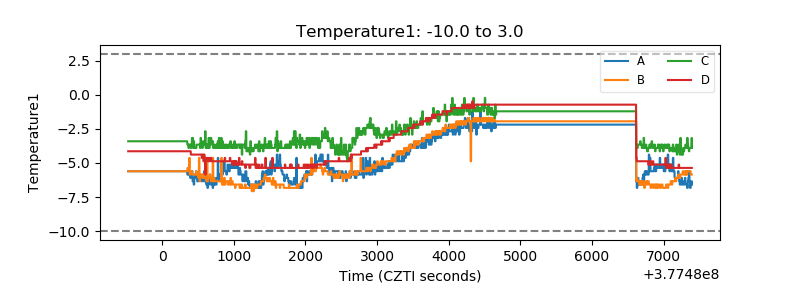 |
| Veto HV Monitor | 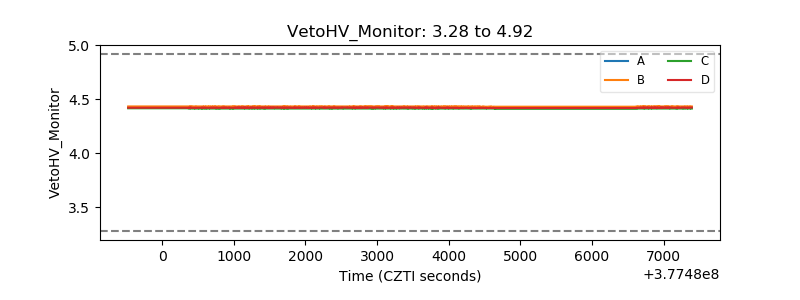 |
| Veto LLD | 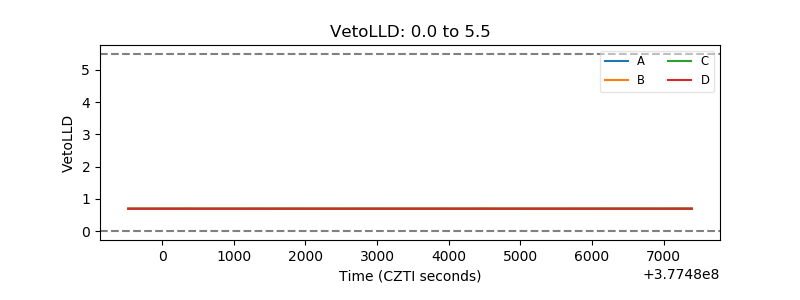 |
| Alpha Counter | 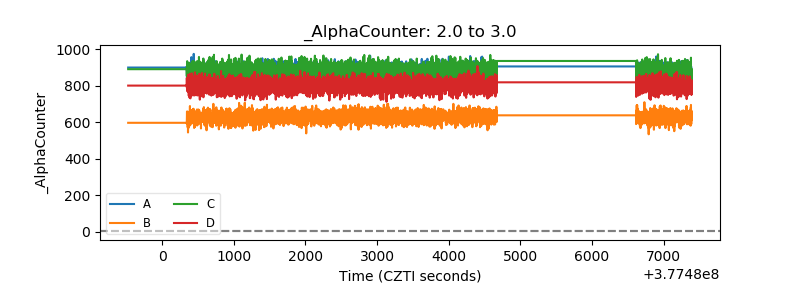 |
| _CPM_Rate | 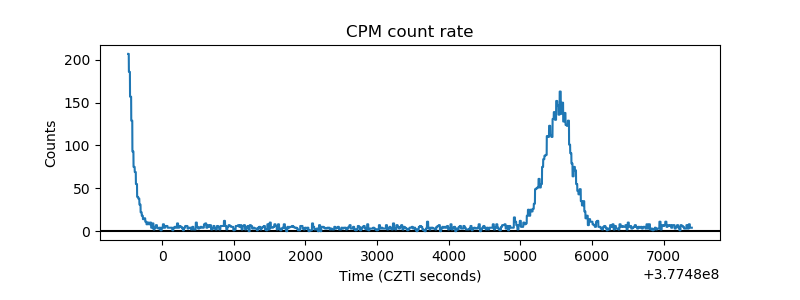 |
| CZT Counter | 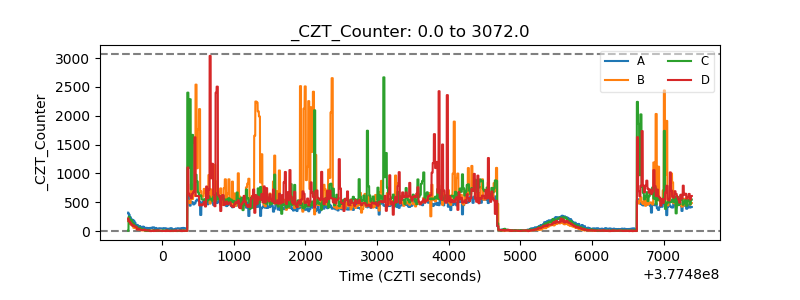 |
| +2.5 Volts monitor |  |
| +5 Volts monitor |  |
| _ROLL_ROT | 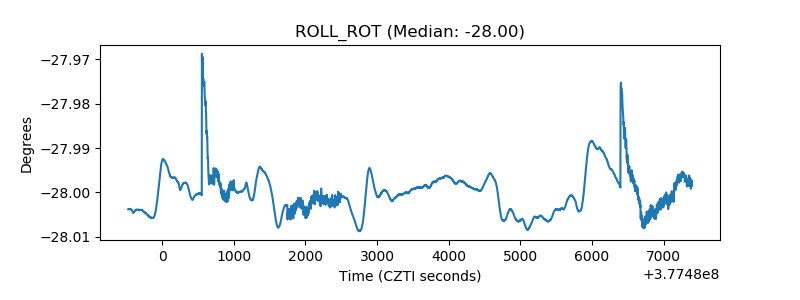 |
| _Roll_DEC | 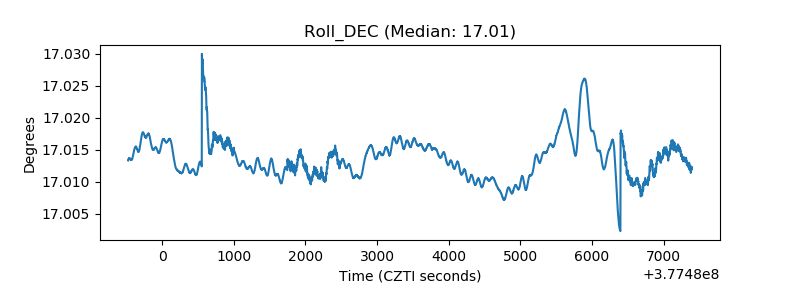 |
| _Roll_RA | 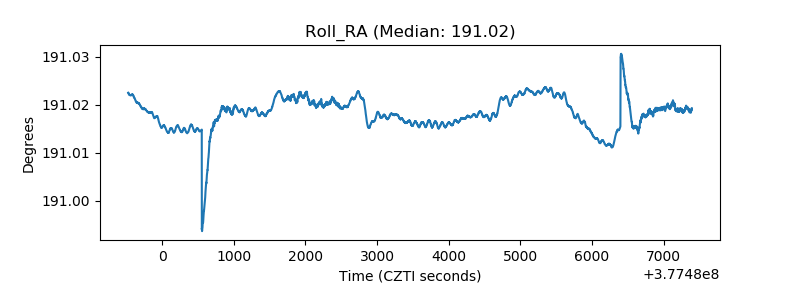 |
| Veto Counter | 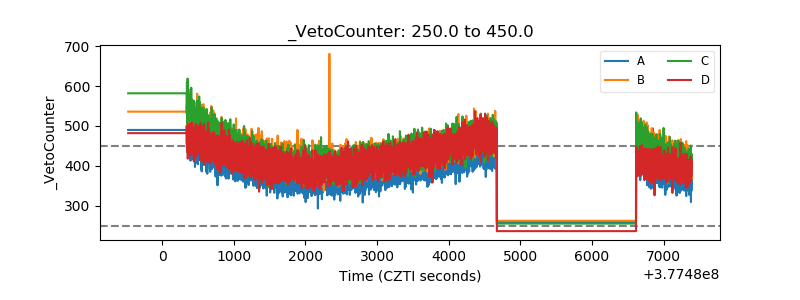 |