| Param | Original file | Final file |
|---|---|---|
| Filename | modeM0/AS1T04_076T01_9000004810_33645cztM0_level2.evt | modeM0/AS1T04_076T01_9000004810_33645cztM0_level2_quad_clean.evt |
| Size (bytes) | 504,158,400 | 72,095,040 |
| Size | 480.8 MB | 68.8 MB |
| Events in quadrant A | 2,754,036 | 454,802 |
| Events in quadrant B | 4,592,950 | 427,476 |
| Events in quadrant C | 3,534,047 | 453,662 |
| Events in quadrant D | 3,981,552 | 428,747 |
| Mode SS | |||
|---|---|---|---|
| Quadrant | BADHDUFLAG | Total packets | Discarded packets |
| A | 0 | 122 | 0 |
| B | 0 | 122 | 0 |
| C | 0 | 122 | 0 |
| D | 0 | 122 | 0 |
| Mode M9 | |||
|---|---|---|---|
| Quadrant | BADHDUFLAG | Total packets | Discarded packets |
| A | 0 | 27 | 0 |
| B | 0 | 27 | 0 |
| C | 0 | 27 | 0 |
| D | 0 | 28 | 0 |
| Mode M0 | |||
|---|---|---|---|
| Quadrant | BADHDUFLAG | Total packets | Discarded packets |
| A | 0 | 12163 | 3 |
| B | 0 | 17420 | 2 |
| C | 0 | 14304 | 2 |
| D | 0 | 15867 | 2 |
| Quadrant | Total seconds | Saturated seconds | Saturation percentage |
|---|---|---|---|
| A | 5983 | 14 | 0.233996% |
| B | 5983 | 561 | 9.376567% |
| C | 5983 | 87 | 1.454120% |
| D | 5983 | 150 | 2.507103% |
Noise dominated data is calculated using 1-second bins in cleaned event files. If a bin has >2000 counts, and if more than 50% of those come from <1% of pixels, then it is considered to be noise-dominated and hence unusable.
| Quadrant | # 1 sec bins | Bins with >0 counts | Bins with >2000 counts | High rate bins dominated by noise | Noise dominated (total time) | Noise dominated (detector-on time) | Marked lightcurve |
|---|---|---|---|---|---|---|---|
| A | 7357 | 5984 | 2 | 2 | 0.03% | 0.03% | 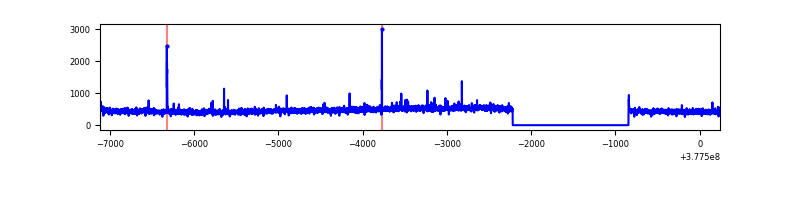 |
| B | 7357 | 5984 | 514 | 514 | 6.99% | 8.59% | 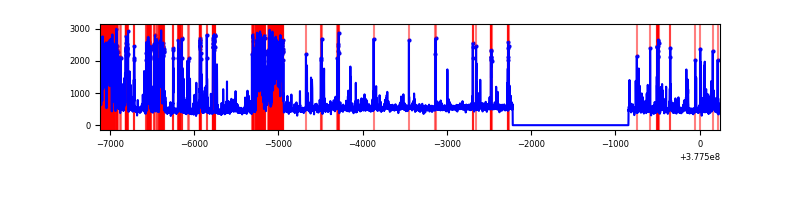 |
| C | 7357 | 5984 | 73 | 73 | 0.99% | 1.22% | 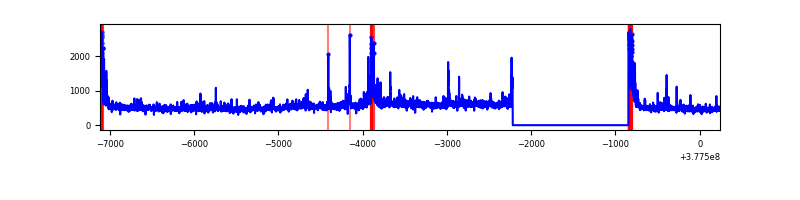 |
| D | 7357 | 5984 | 126 | 126 | 1.71% | 2.11% | 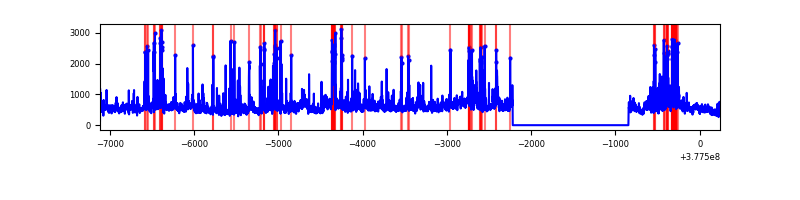 |
Top three noisy pixels from each quadrant. If the there are fewer than three noisy pixels in the level2.evt file, extra rows are filled as -1
| Pixel properties | Quadrant properties | ||||||
|---|---|---|---|---|---|---|---|
| Quadrant | DetID | PixID | Counts | Sigma | Mean | Median | Sigma |
| A | 7 | 16 | 30245 | 209.78 | 696 | 682 | 140.9 |
| A | 13 | 6 | 15869 | 107.77 | 696 | 682 | 140.9 |
| A | 13 | 254 | 9259 | 60.86 | 696 | 682 | 140.9 |
| B | 5 | 172 | 1567621 | 12200.76 | 669 | 652 | 128.4 |
| B | 15 | 85 | 113994 | 882.51 | 669 | 652 | 128.4 |
| B | 4 | 251 | 56269 | 433.05 | 669 | 652 | 128.4 |
| C | 3 | 233 | 350823 | 2232.87 | 675 | 681 | 156.8 |
| C | 15 | 214 | 273585 | 1740.32 | 675 | 681 | 156.8 |
| C | 0 | 10 | 230870 | 1467.92 | 675 | 681 | 156.8 |
| D | 8 | 195 | 649340 | 3887.95 | 673 | 653 | 166.8 |
| D | 13 | 249 | 373227 | 2233.05 | 673 | 653 | 166.8 |
| D | 2 | 249 | 93569 | 556.9 | 673 | 653 | 166.8 |
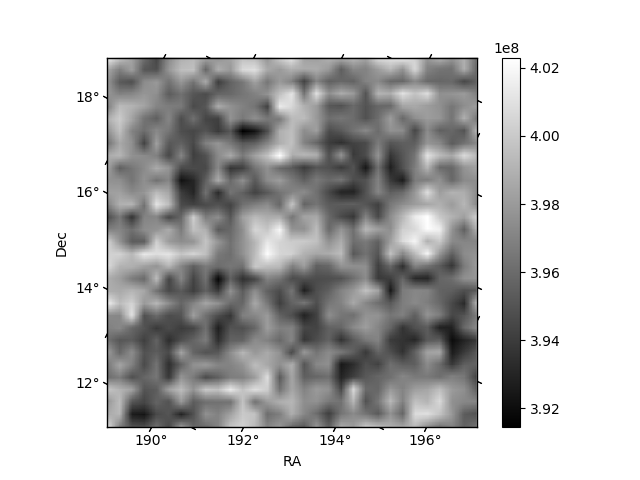
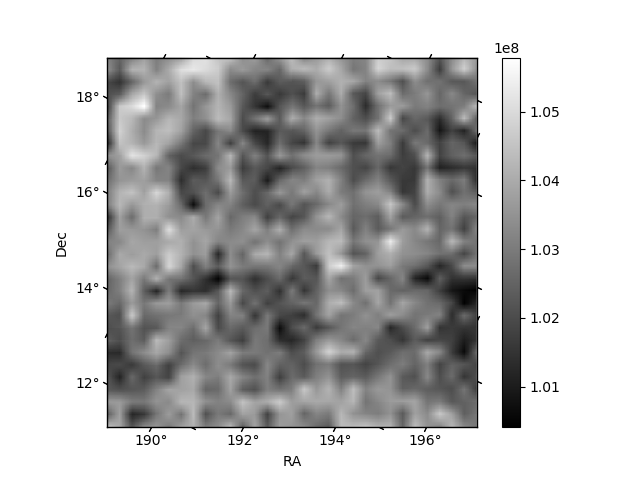
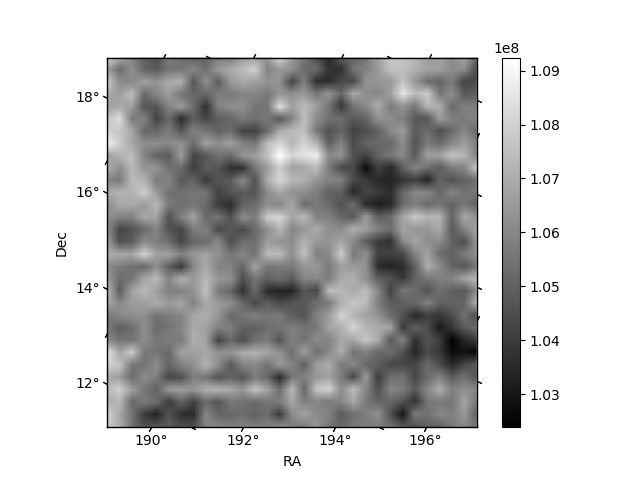
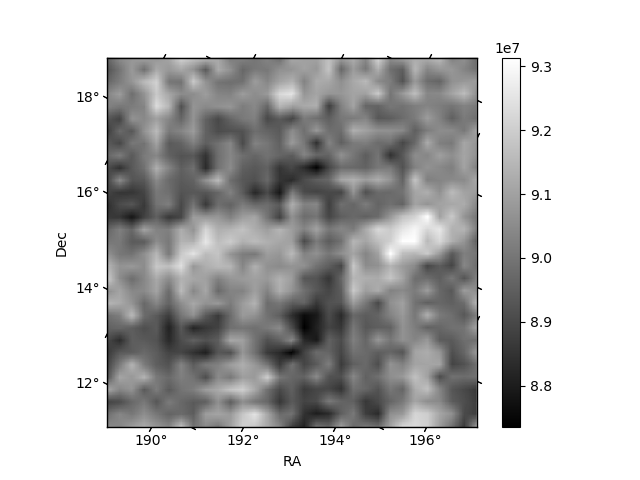
Histogram calculated using DETX and DETY for each event in the final _common_clean file
| Quadrant A | 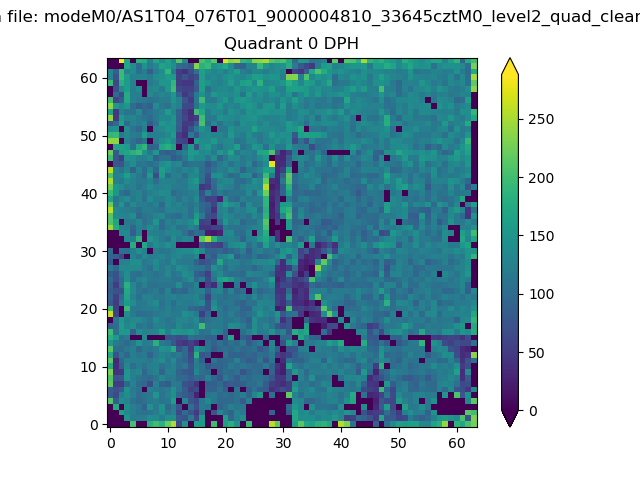 |
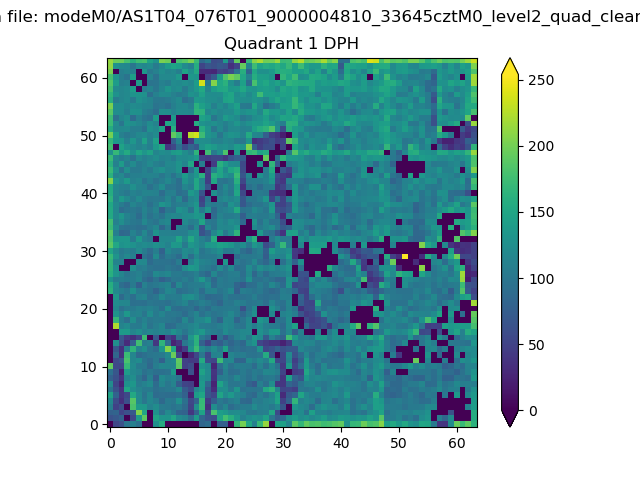 |
Quadrant B |
|---|---|---|---|
| Quadrant D |  |
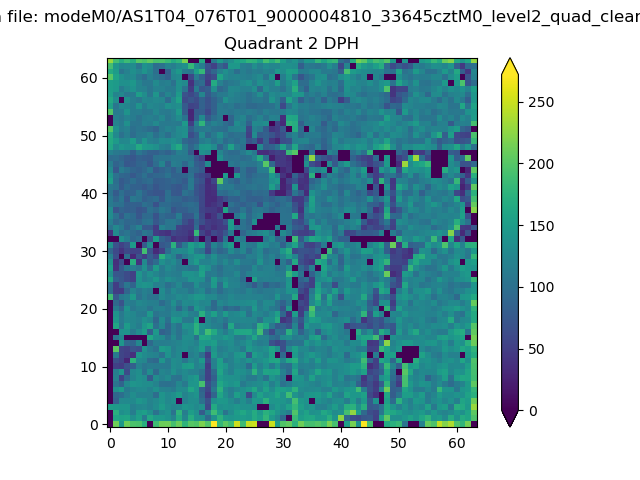 |
Quadrant C |
| Plot type | Count rate plots | Images |
|---|---|---|
| Comparison with Poisson distribution Blue bars denote a histogram of data divided into 1 sec bins. Red curve is a Poisson curve with rate = median count rate of data. |
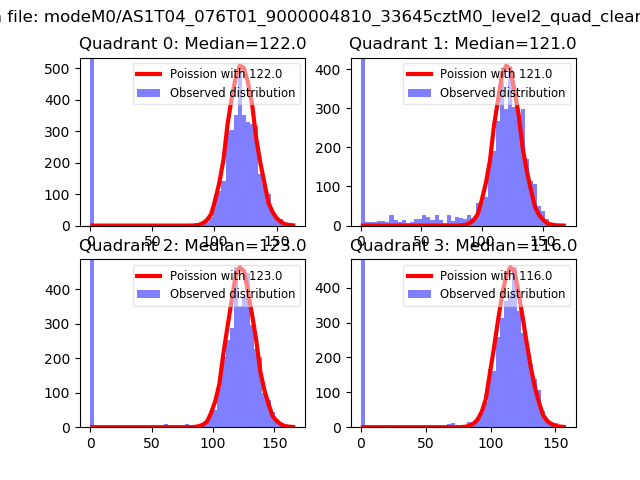 |
 |
| Quadrant-wise count rates Data is divided into 100 sec bins |
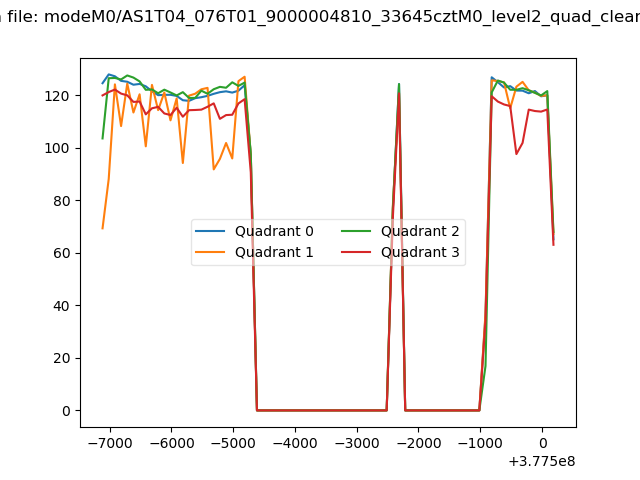 |
|
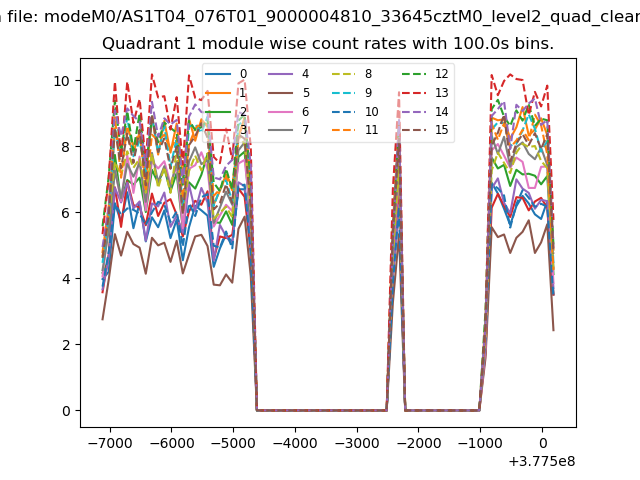
| Module-wise count rates for Quadrant A Data is divided into 100 sec bins |
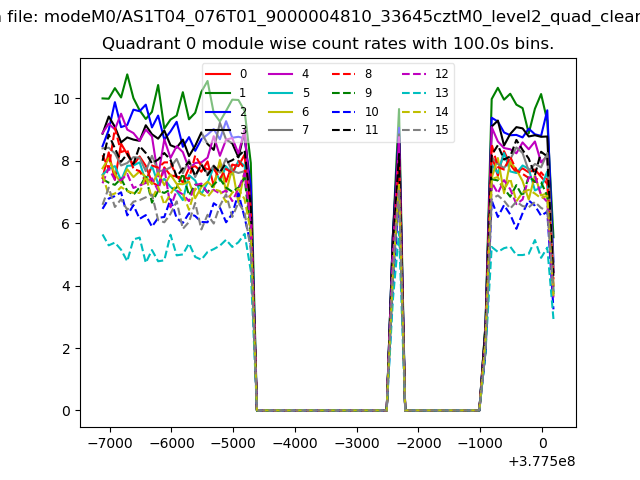 |
 |
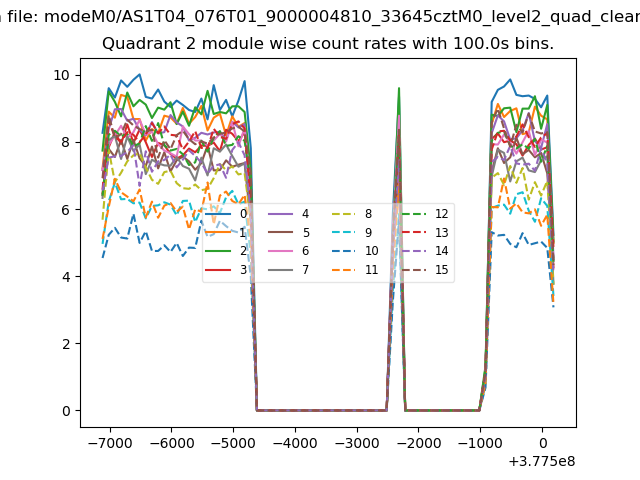
| Module-wise count rates for Quadrant B Data is divided into 100 sec bins |
 |
 |
| Module-wise count rates for Quadrant C Data is divided into 100 sec bins |
 |
 |
| Module-wise count rates for Quadrant D Data is divided into 100 sec bins |
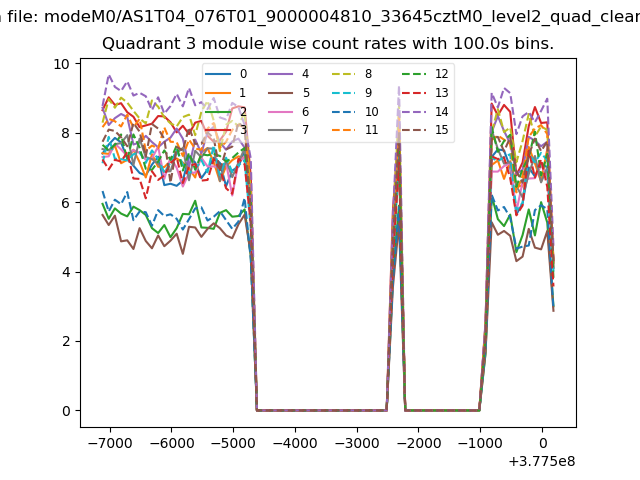 |
 |
| Parameter | Plot |
|---|---|
| CZT HV Monitor | 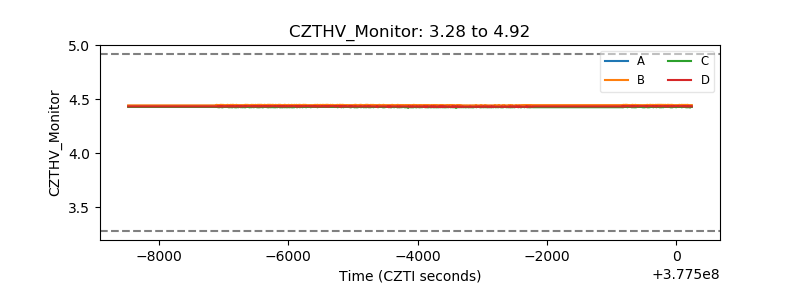 |
| D_VDD | 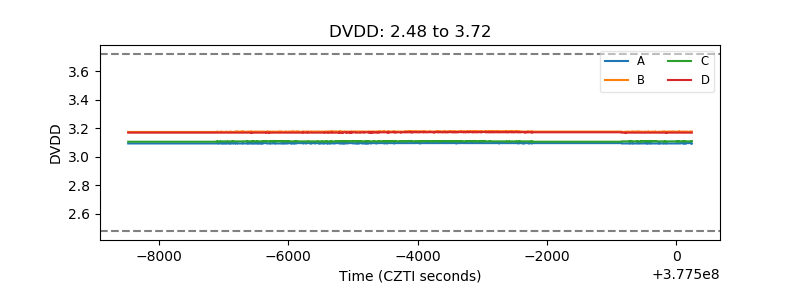 |
| Temperature 1 | 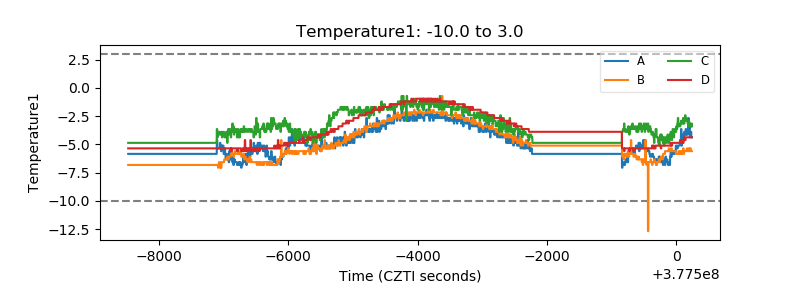 |
| Veto HV Monitor | 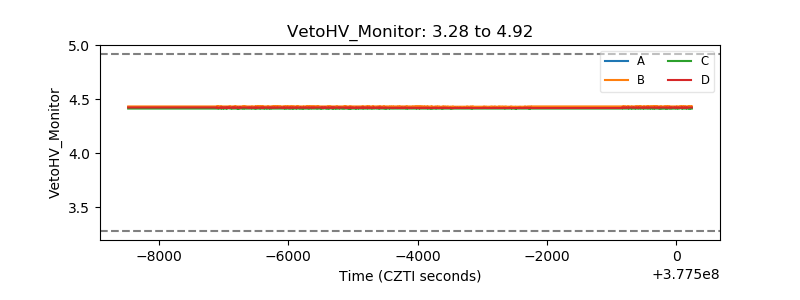 |
| Veto LLD | 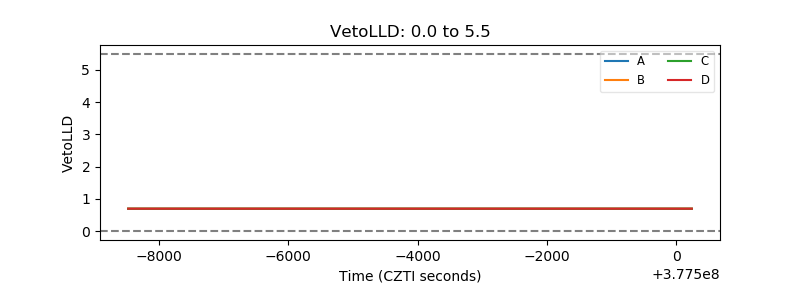 |
| Alpha Counter | 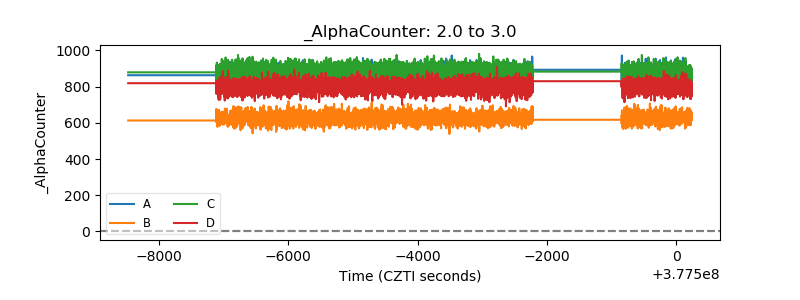 |
| _CPM_Rate | 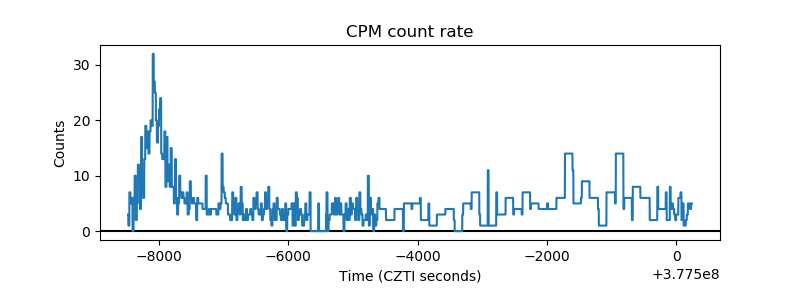 |
| CZT Counter | 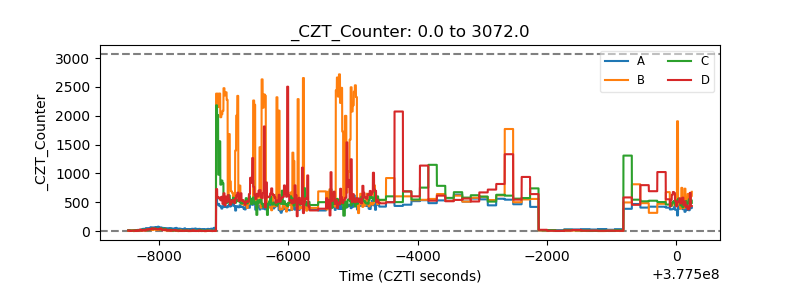 |
| +2.5 Volts monitor |  |
| +5 Volts monitor |  |
| _ROLL_ROT | 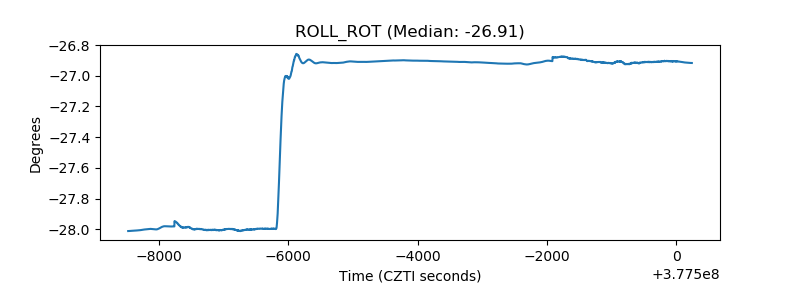 |
| _Roll_DEC | 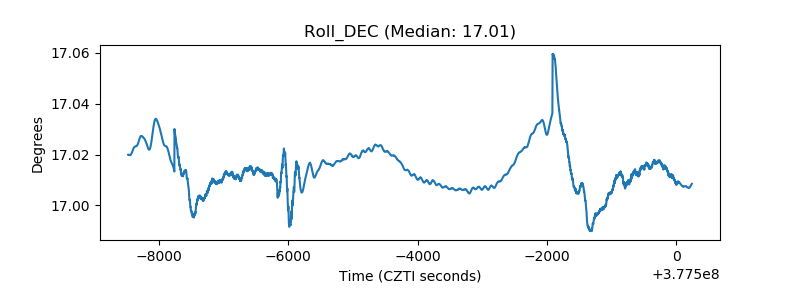 |
| _Roll_RA | 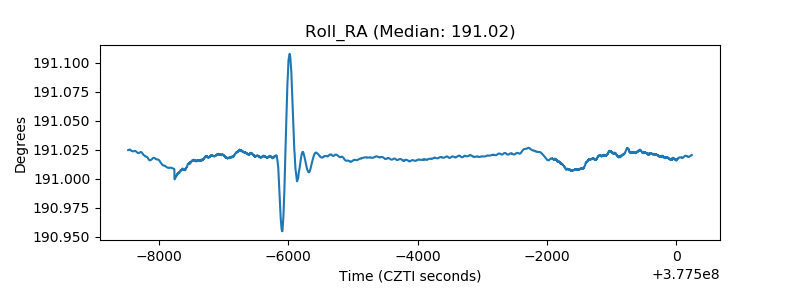 |
| Veto Counter |  |