| Param | Original file | Final file |
|---|---|---|
| Filename | modeM0/AS1T04_076T01_9000004810_33646cztM0_level2.evt | modeM0/AS1T04_076T01_9000004810_33646cztM0_level2_quad_clean.evt |
| Size (bytes) | 521,484,480 | 72,066,240 |
| Size | 497.3 MB | 68.7 MB |
| Events in quadrant A | 2,737,929 | 453,910 |
| Events in quadrant B | 4,945,690 | 429,346 |
| Events in quadrant C | 3,720,415 | 452,626 |
| Events in quadrant D | 3,984,776 | 429,206 |
| Mode SS | |||
|---|---|---|---|
| Quadrant | BADHDUFLAG | Total packets | Discarded packets |
| A | 0 | 122 | 0 |
| B | 0 | 122 | 0 |
| C | 0 | 122 | 0 |
| D | 0 | 122 | 0 |
| Mode M9 | |||
|---|---|---|---|
| Quadrant | BADHDUFLAG | Total packets | Discarded packets |
| A | 0 | 20 | 0 |
| B | 0 | 20 | 0 |
| C | 0 | 20 | 0 |
| D | 0 | 21 | 0 |
| Mode M0 | |||
|---|---|---|---|
| Quadrant | BADHDUFLAG | Total packets | Discarded packets |
| A | 0 | 12053 | 3 |
| B | 0 | 18543 | 2 |
| C | 0 | 15024 | 2 |
| D | 0 | 16035 | 2 |
| Quadrant | Total seconds | Saturated seconds | Saturation percentage |
|---|---|---|---|
| A | 5964 | 8 | 0.134138% |
| B | 5964 | 606 | 10.160966% |
| C | 5964 | 80 | 1.341382% |
| D | 5964 | 184 | 3.085178% |
Noise dominated data is calculated using 1-second bins in cleaned event files. If a bin has >2000 counts, and if more than 50% of those come from <1% of pixels, then it is considered to be noise-dominated and hence unusable.
| Quadrant | # 1 sec bins | Bins with >0 counts | Bins with >2000 counts | High rate bins dominated by noise | Noise dominated (total time) | Noise dominated (detector-on time) | Marked lightcurve |
|---|---|---|---|---|---|---|---|
| A | 7276 | 5965 | 0 | 0 | 0.00% | 0.00% | 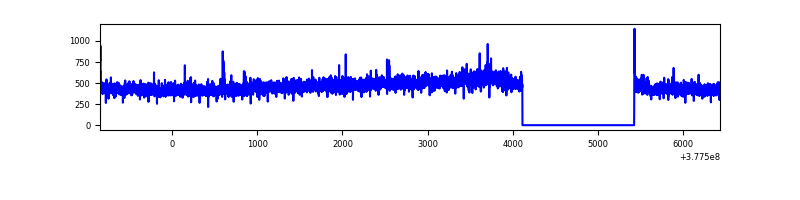 |
| B | 7275 | 5964 | 537 | 537 | 7.38% | 9.00% | 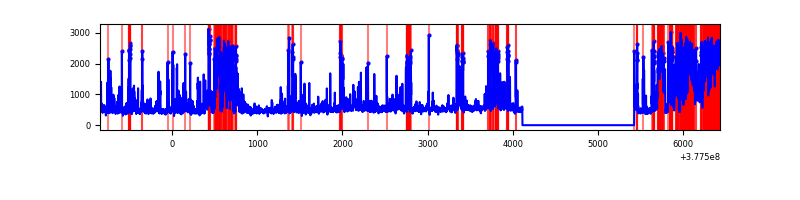 |
| C | 7276 | 5965 | 66 | 66 | 0.91% | 1.11% | 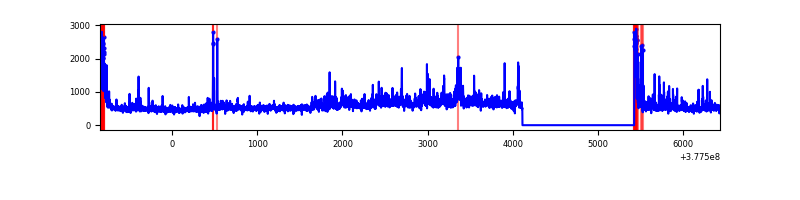 |
| D | 7276 | 5965 | 147 | 147 | 2.02% | 2.46% | 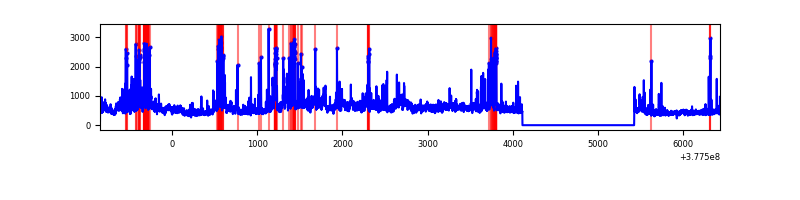 |
Top three noisy pixels from each quadrant. If the there are fewer than three noisy pixels in the level2.evt file, extra rows are filled as -1
| Pixel properties | Quadrant properties | ||||||
|---|---|---|---|---|---|---|---|
| Quadrant | DetID | PixID | Counts | Sigma | Mean | Median | Sigma |
| A | 13 | 6 | 19922 | 137.38 | 697 | 682 | 140.1 |
| A | 7 | 16 | 10823 | 72.41 | 697 | 682 | 140.1 |
| A | 13 | 254 | 10307 | 68.72 | 697 | 682 | 140.1 |
| B | 5 | 172 | 1817755 | 14081.58 | 671 | 652 | 129.0 |
| B | 4 | 170 | 149567 | 1154.01 | 671 | 652 | 129.0 |
| B | 15 | 85 | 82200 | 631.95 | 671 | 652 | 129.0 |
| C | 3 | 233 | 291488 | 1851.24 | 675 | 682 | 157.1 |
| C | 15 | 214 | 274648 | 1744.04 | 675 | 682 | 157.1 |
| C | 0 | 10 | 253551 | 1609.73 | 675 | 682 | 157.1 |
| D | 8 | 195 | 607308 | 3408.22 | 666 | 652 | 178.0 |
| D | 13 | 249 | 295932 | 1658.9 | 666 | 652 | 178.0 |
| D | 15 | 0 | 143806 | 804.25 | 666 | 652 | 178.0 |
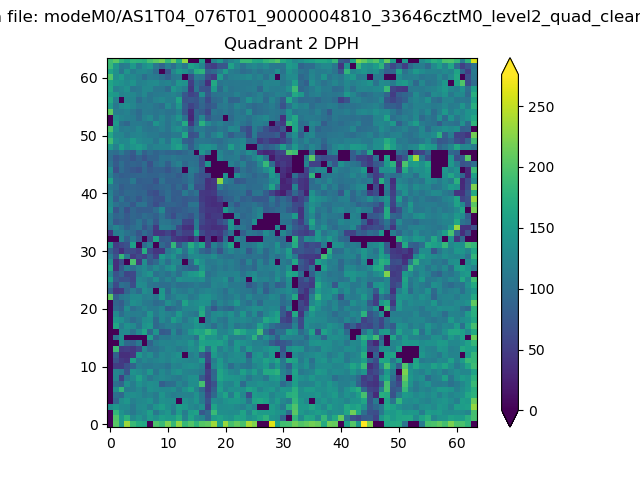
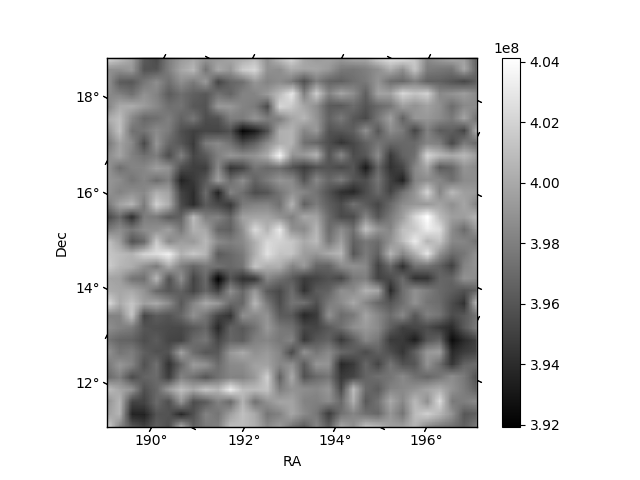
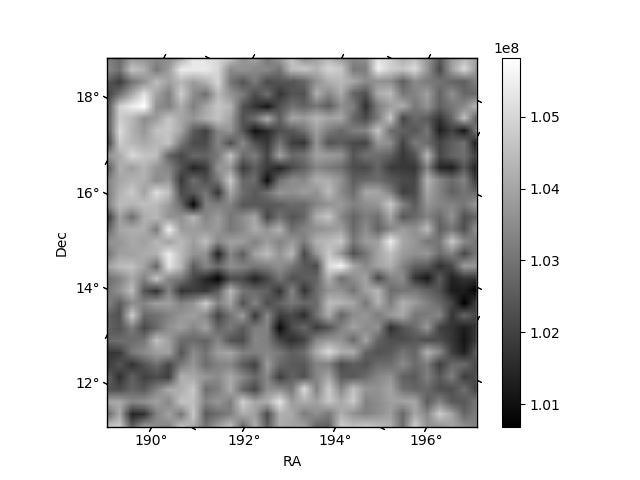
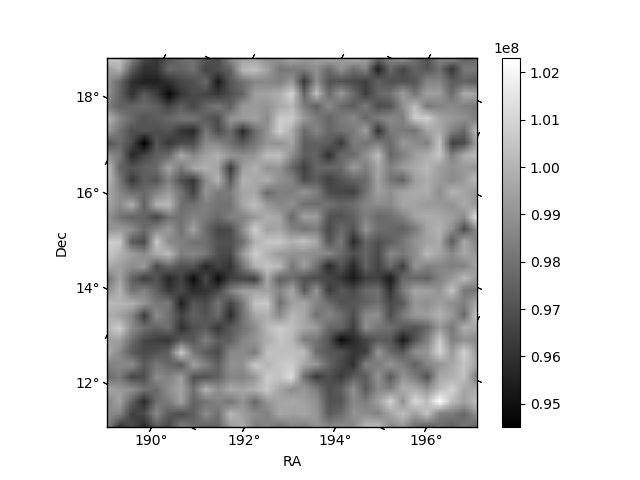
Histogram calculated using DETX and DETY for each event in the final _common_clean file
| Quadrant A | 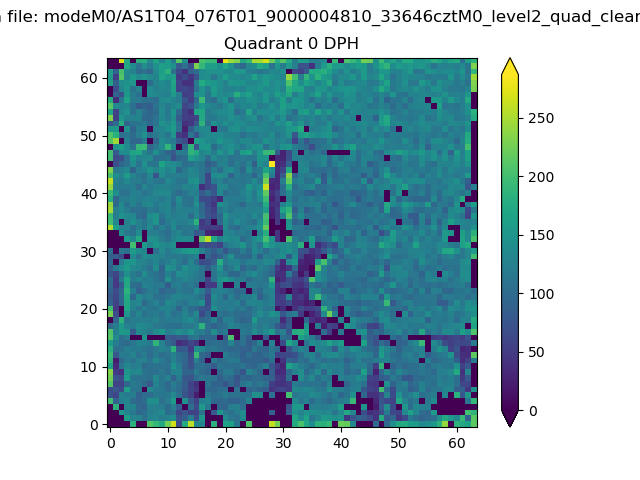 |
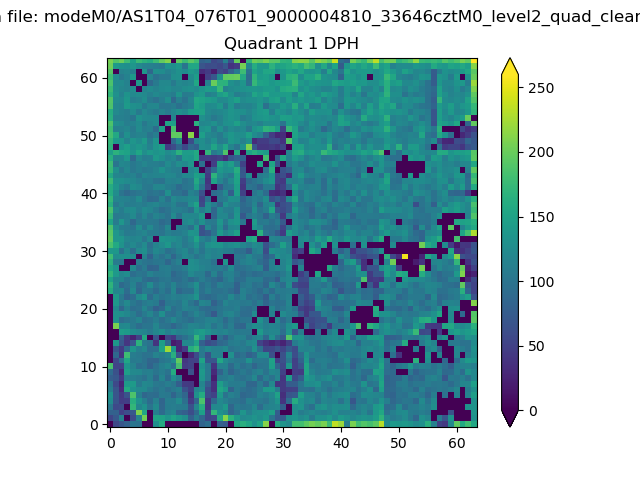 |
Quadrant B |
|---|---|---|---|
| Quadrant D | 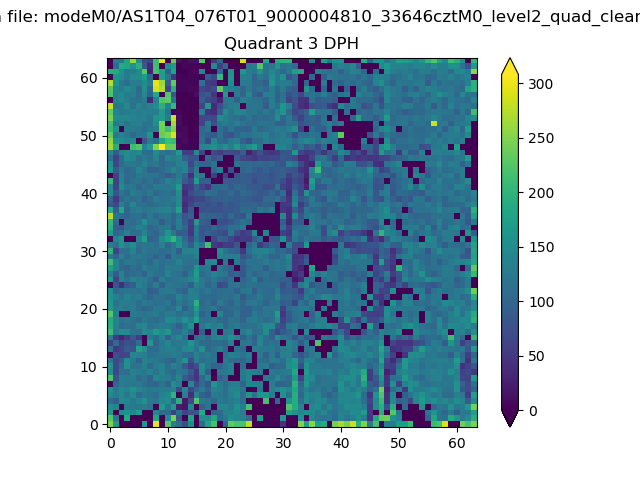 |
 |
Quadrant C |
| Plot type | Count rate plots | Images |
|---|---|---|
| Comparison with Poisson distribution Blue bars denote a histogram of data divided into 1 sec bins. Red curve is a Poisson curve with rate = median count rate of data. |
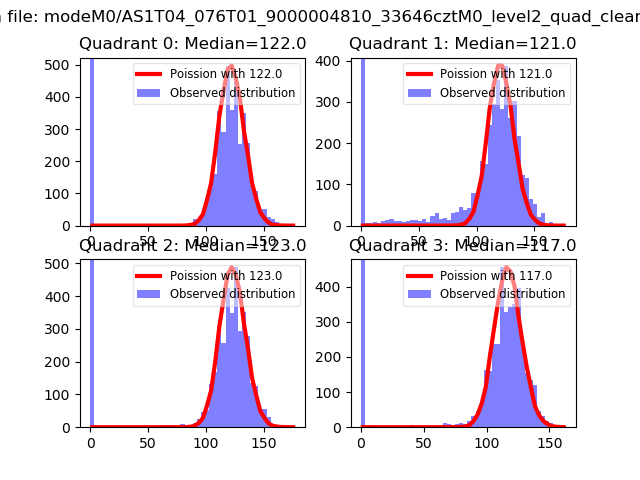 |
 |
| Quadrant-wise count rates Data is divided into 100 sec bins |
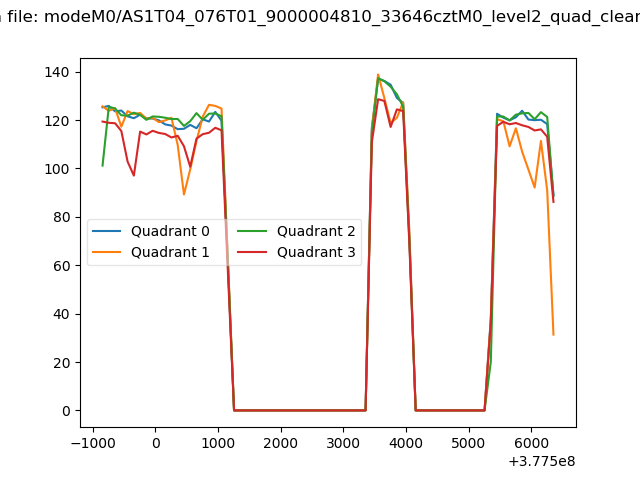 |
|
| Module-wise count rates for Quadrant A Data is divided into 100 sec bins |
 |
 |
| Module-wise count rates for Quadrant B Data is divided into 100 sec bins |
 |
 |
| Module-wise count rates for Quadrant C Data is divided into 100 sec bins |
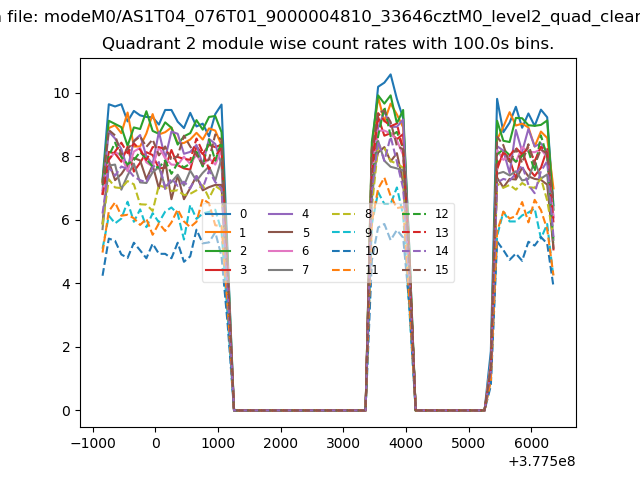 |
 |
| Module-wise count rates for Quadrant D Data is divided into 100 sec bins |
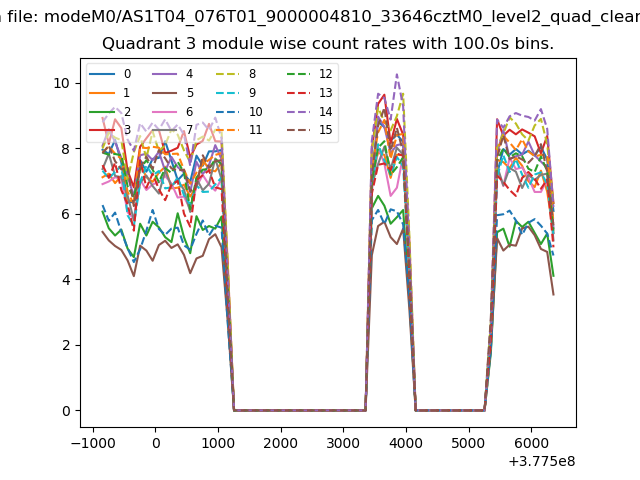 |
 |
| Parameter | Plot |
|---|---|
| CZT HV Monitor |  |
| D_VDD | 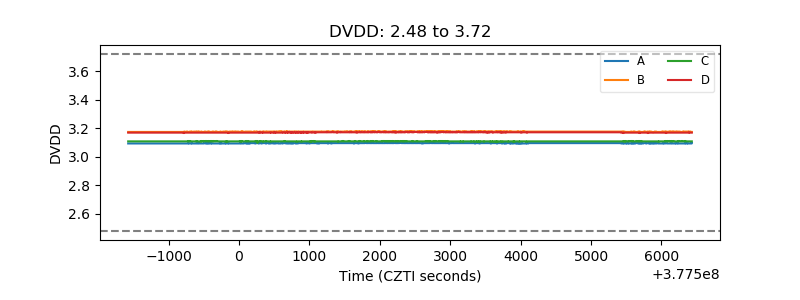 |
| Temperature 1 | 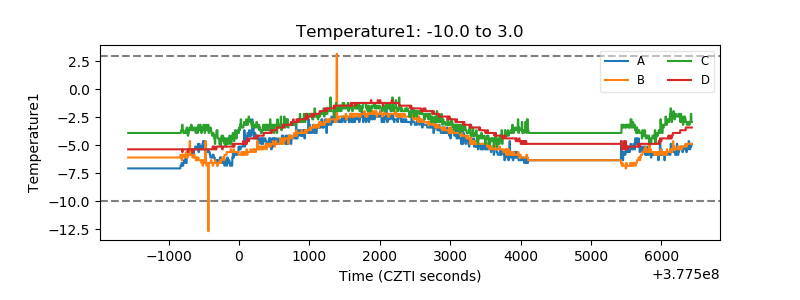 |
| Veto HV Monitor | 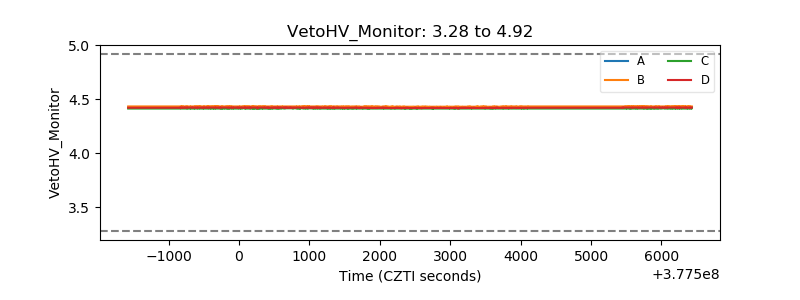 |
| Veto LLD |  |
| Alpha Counter | 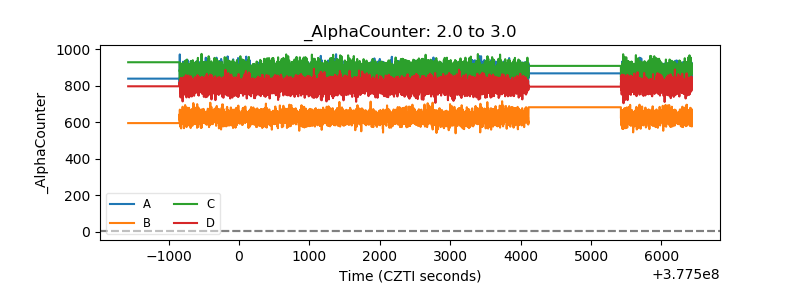 |
| _CPM_Rate | 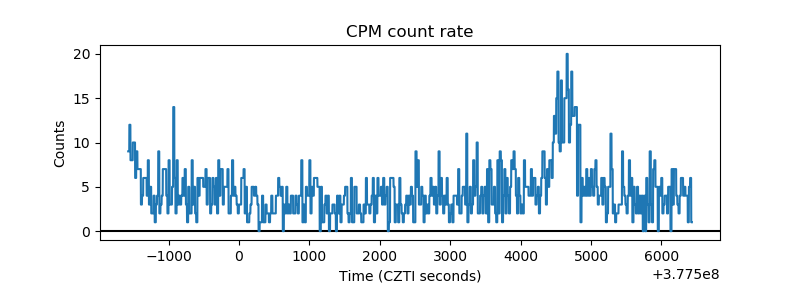 |
| CZT Counter | 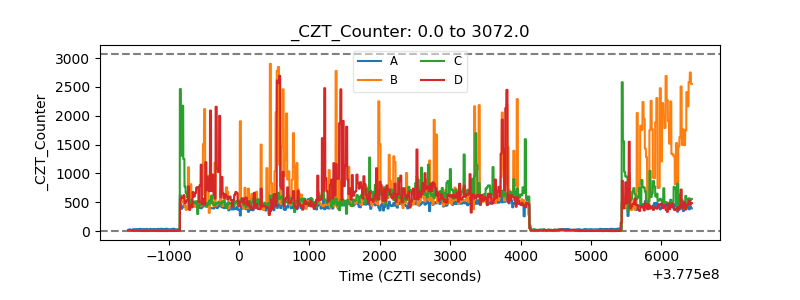 |
| +2.5 Volts monitor |  |
| +5 Volts monitor | 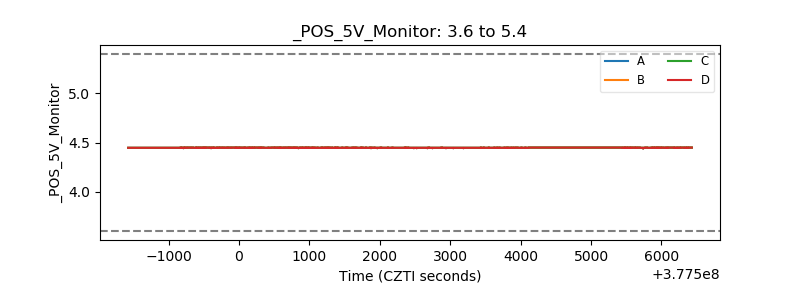 |
| _ROLL_ROT |  |
| _Roll_DEC | 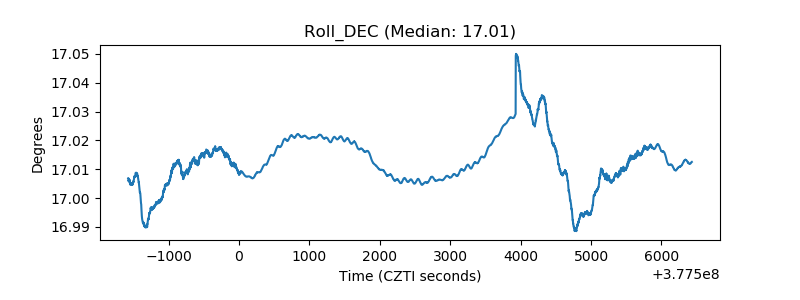 |
| _Roll_RA | 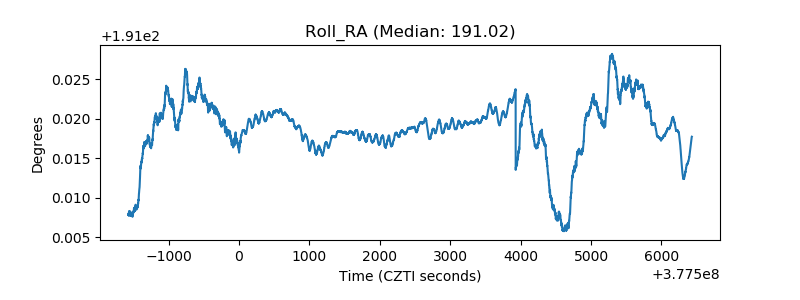 |
| Veto Counter | 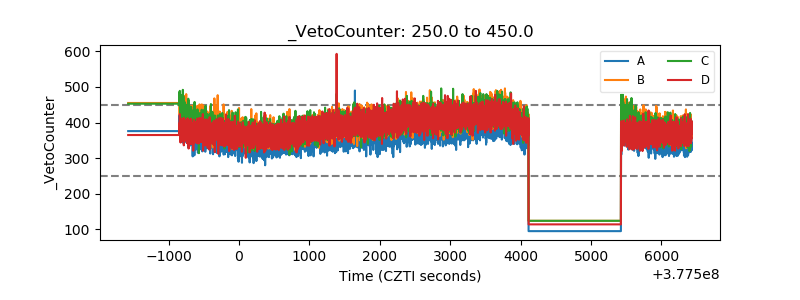 |