| Param | Original file | Final file |
|---|---|---|
| Filename | modeM0/AS1T04_076T01_9000004810_33648cztM0_level2.evt | modeM0/AS1T04_076T01_9000004810_33648cztM0_level2_quad_clean.evt |
| Size (bytes) | 1,212,629,760 | 118,808,640 |
| Size | 1.1 GB | 113.3 MB |
| Events in quadrant A | 11,420,297 | 696,951 |
| Events in quadrant B | 9,534,890 | 693,883 |
| Events in quadrant C | 6,861,405 | 748,554 |
| Events in quadrant D | 8,177,968 | 706,788 |
| Mode SS | |||
|---|---|---|---|
| Quadrant | BADHDUFLAG | Total packets | Discarded packets |
| A | 0 | 222 | 0 |
| B | 0 | 222 | 0 |
| C | 0 | 222 | 0 |
| D | 0 | 222 | 0 |
| Mode M9 | |||
|---|---|---|---|
| Quadrant | BADHDUFLAG | Total packets | Discarded packets |
| A | 0 | 27 | 0 |
| B | 0 | 27 | 0 |
| C | 0 | 27 | 0 |
| D | 0 | 27 | 0 |
| Mode M0 | |||
|---|---|---|---|
| Quadrant | BADHDUFLAG | Total packets | Discarded packets |
| A | 0 | 41196 | 3 |
| B | 0 | 35192 | 2 |
| C | 0 | 27216 | 2 |
| D | 0 | 31940 | 2 |
| Quadrant | Total seconds | Saturated seconds | Saturation percentage |
|---|---|---|---|
| A | 10841 | 2512 | 23.171294% |
| B | 10841 | 1417 | 13.070750% |
| C | 10841 | 132 | 1.217600% |
| D | 10841 | 281 | 2.592012% |
Noise dominated data is calculated using 1-second bins in cleaned event files. If a bin has >2000 counts, and if more than 50% of those come from <1% of pixels, then it is considered to be noise-dominated and hence unusable.
| Quadrant | # 1 sec bins | Bins with >0 counts | Bins with >2000 counts | High rate bins dominated by noise | Noise dominated (total time) | Noise dominated (detector-on time) | Marked lightcurve |
|---|---|---|---|---|---|---|---|
| A | 13618 | 10843 | 2349 | 2349 | 17.25% | 21.66% | 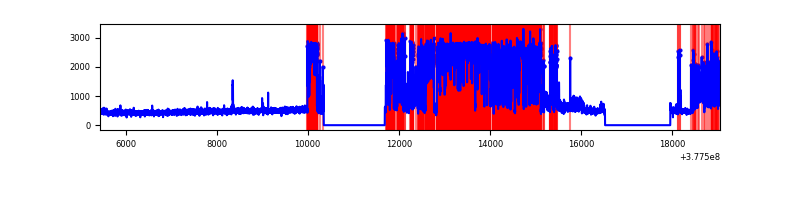 |
| B | 13618 | 10843 | 1230 | 1230 | 9.03% | 11.34% | 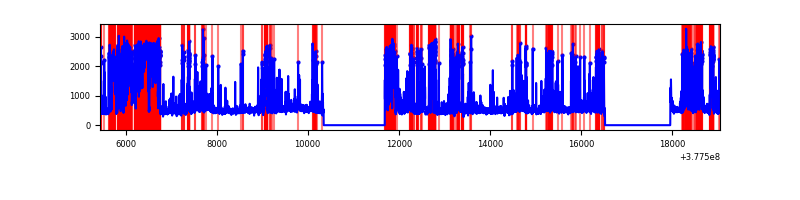 |
| C | 13618 | 10843 | 112 | 112 | 0.82% | 1.03% | 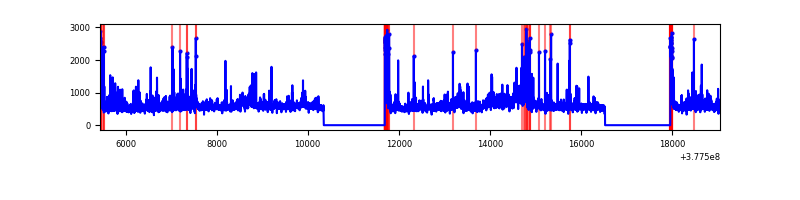 |
| D | 13618 | 10843 | 237 | 237 | 1.74% | 2.19% | 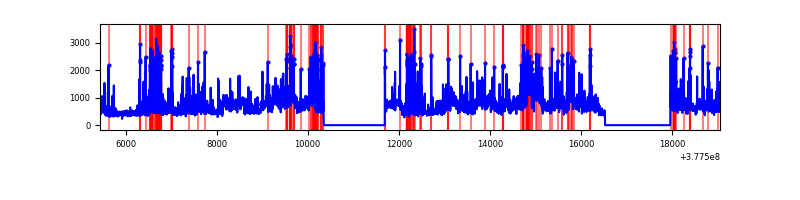 |
Top three noisy pixels from each quadrant. If the there are fewer than three noisy pixels in the level2.evt file, extra rows are filled as -1
| Pixel properties | Quadrant properties | ||||||
|---|---|---|---|---|---|---|---|
| Quadrant | DetID | PixID | Counts | Sigma | Mean | Median | Sigma |
| A | 15 | 169 | 6958802 | 30591.49 | 1144 | 1122 | 227.4 |
| A | 13 | 6 | 24486 | 102.73 | 1144 | 1122 | 227.4 |
| A | 13 | 254 | 15664 | 63.94 | 1144 | 1122 | 227.4 |
| B | 5 | 172 | 4125483 | 17474.74 | 1222 | 1190 | 236.0 |
| B | 4 | 170 | 165494 | 696.16 | 1222 | 1190 | 236.0 |
| B | 5 | 255 | 87492 | 365.66 | 1222 | 1190 | 236.0 |
| C | 3 | 233 | 902235 | 3103.56 | 1246 | 1256 | 290.3 |
| C | 15 | 214 | 499911 | 1717.69 | 1246 | 1256 | 290.3 |
| C | 0 | 10 | 308597 | 1058.68 | 1246 | 1256 | 290.3 |
| D | 8 | 195 | 1757273 | 5298.12 | 1237 | 1211 | 331.4 |
| D | 2 | 250 | 585849 | 1763.88 | 1237 | 1211 | 331.4 |
| D | 13 | 249 | 286197 | 859.82 | 1237 | 1211 | 331.4 |
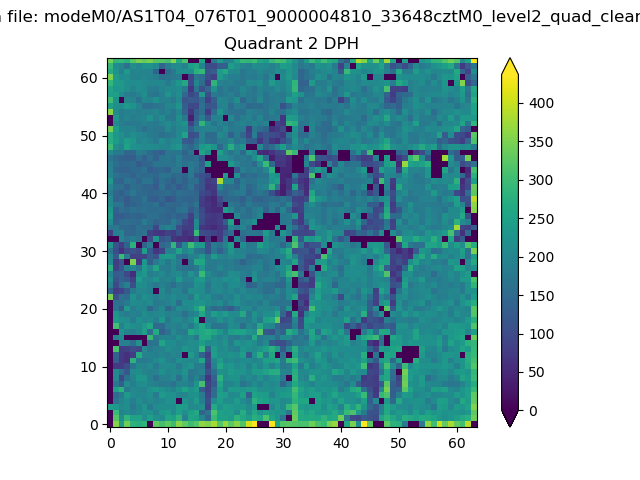
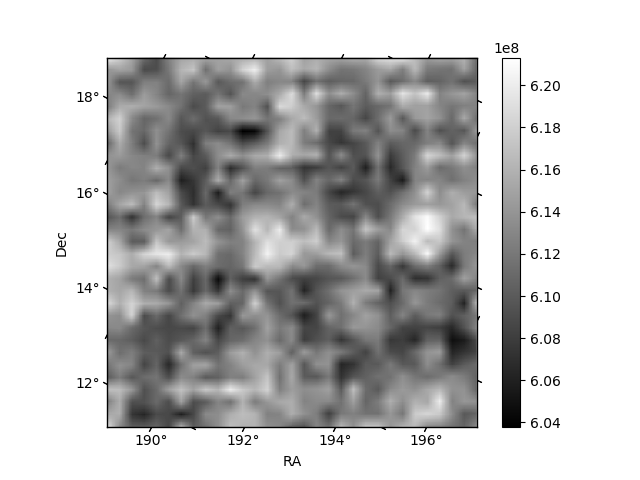
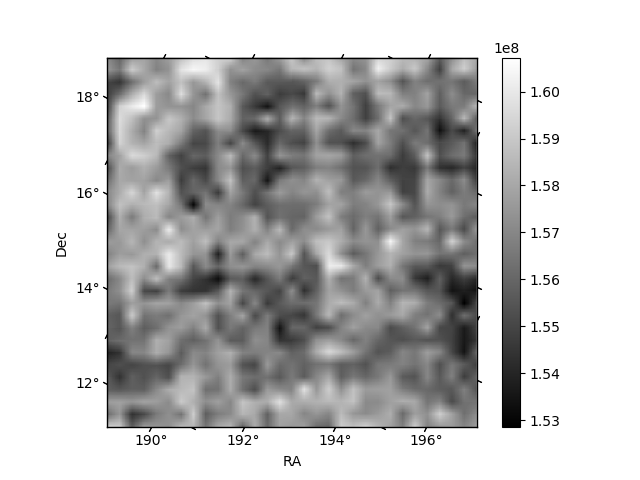
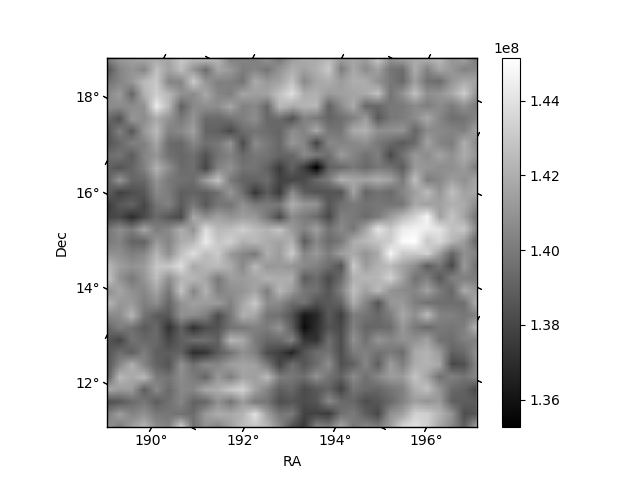
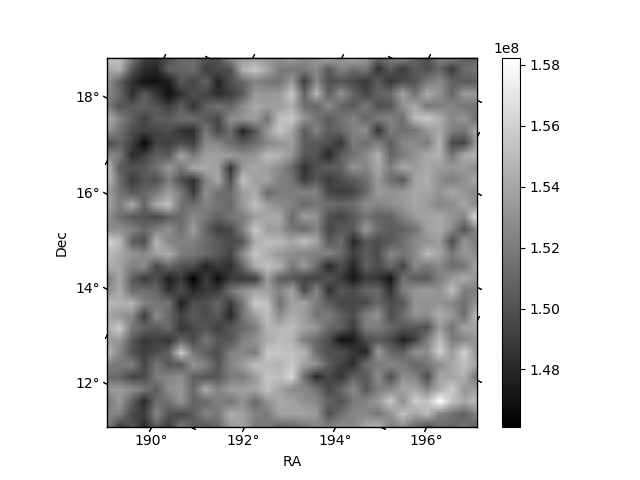
Histogram calculated using DETX and DETY for each event in the final _common_clean file
| Quadrant A | 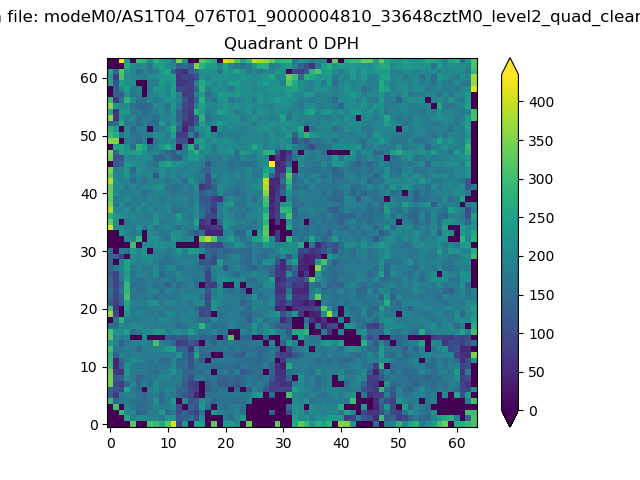 |
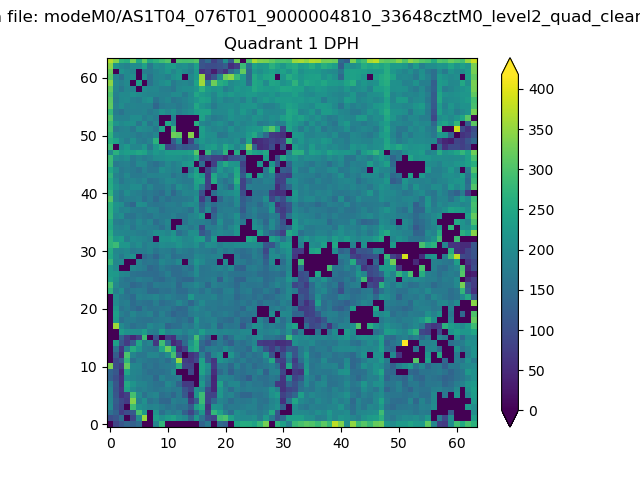 |
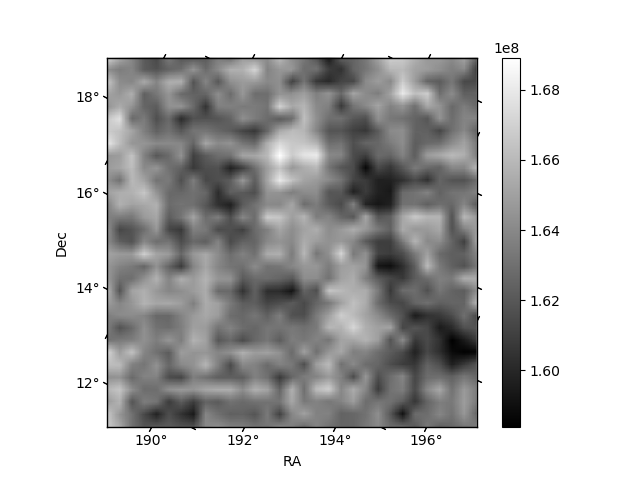
Quadrant B |
|---|---|---|---|
| Quadrant D | 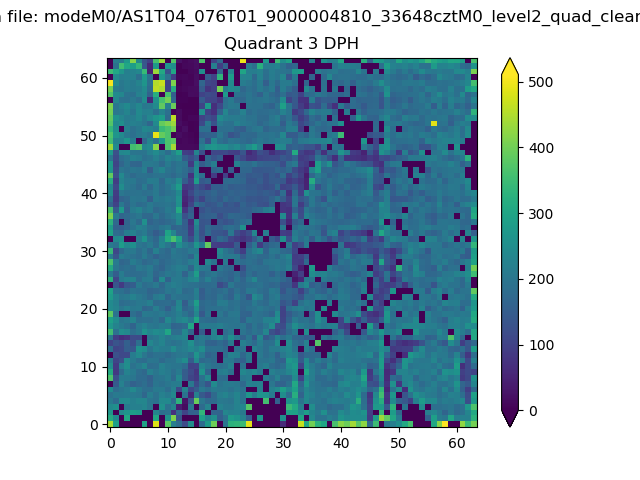 |
 |
Quadrant C |
| Plot type | Count rate plots | Images |
|---|---|---|
| Comparison with Poisson distribution Blue bars denote a histogram of data divided into 1 sec bins. Red curve is a Poisson curve with rate = median count rate of data. |
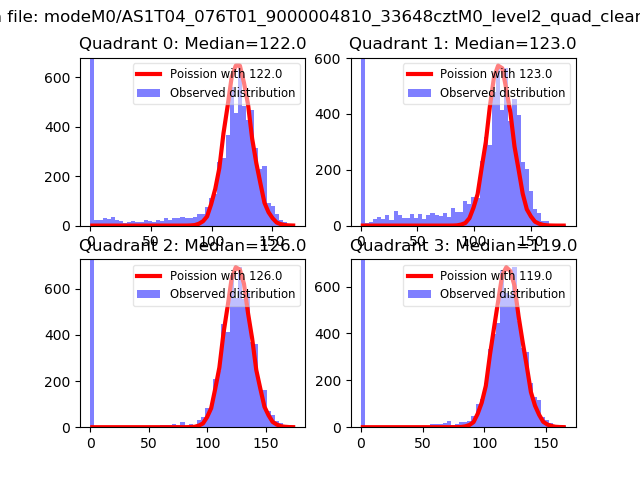 |
 |
| Quadrant-wise count rates Data is divided into 100 sec bins |
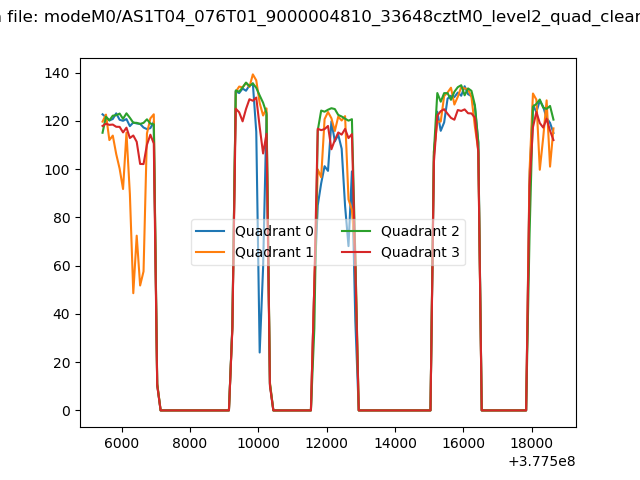 |
|
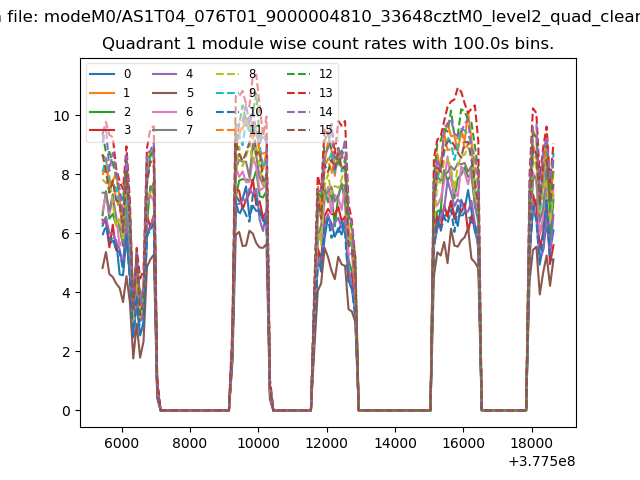
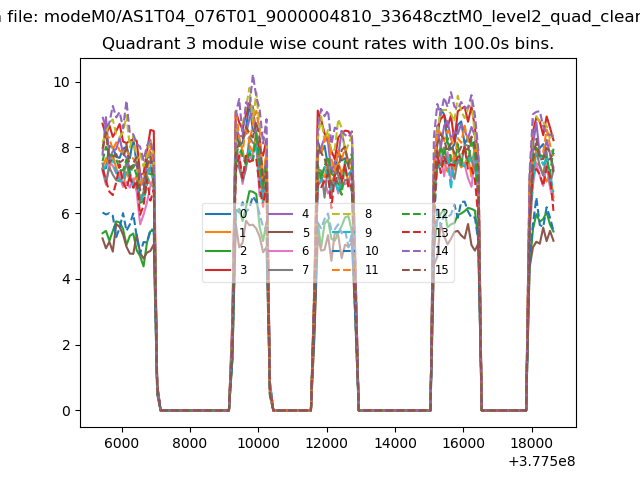
| Module-wise count rates for Quadrant A Data is divided into 100 sec bins |
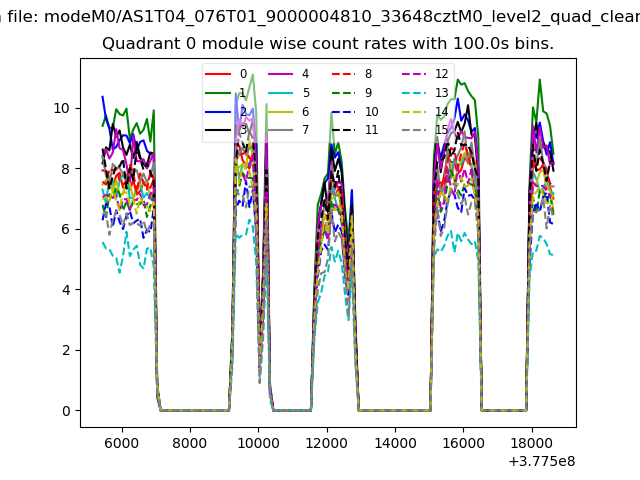 |
 |
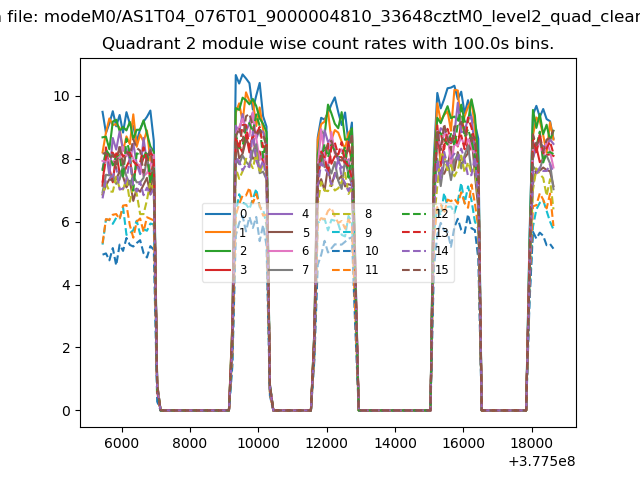
| Module-wise count rates for Quadrant B Data is divided into 100 sec bins |
 |
 |
| Module-wise count rates for Quadrant C Data is divided into 100 sec bins |
 |
 |
| Module-wise count rates for Quadrant D Data is divided into 100 sec bins |
 |
 |
| Parameter | Plot |
|---|---|
| CZT HV Monitor | 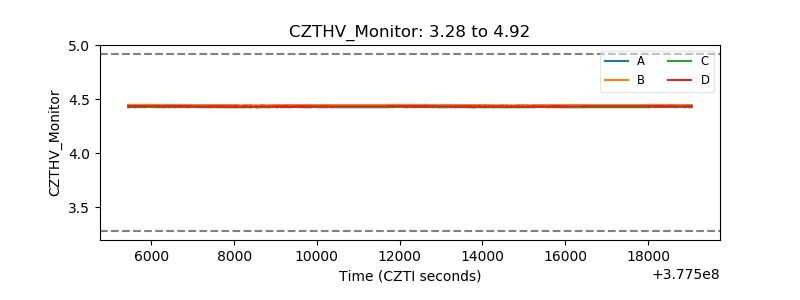 |
| D_VDD | 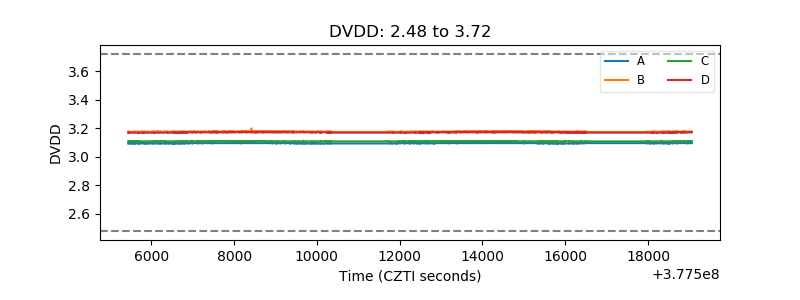 |
| Temperature 1 | 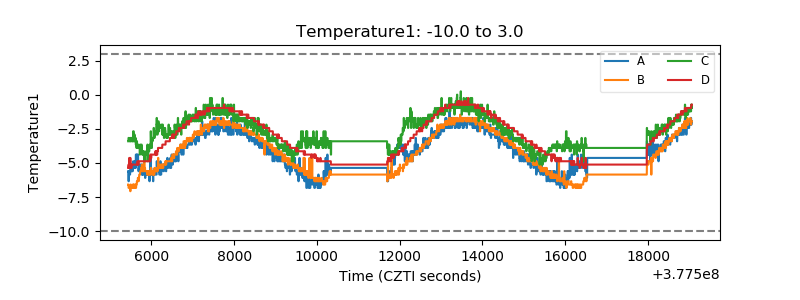 |
| Veto HV Monitor | 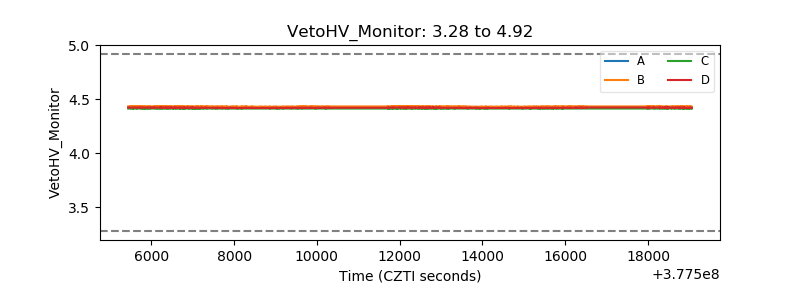 |
| Veto LLD | 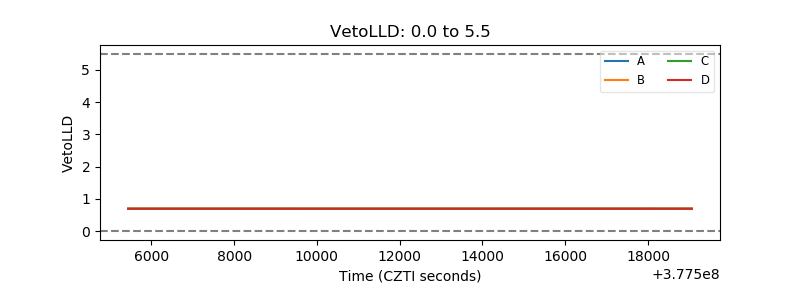 |
| Alpha Counter | 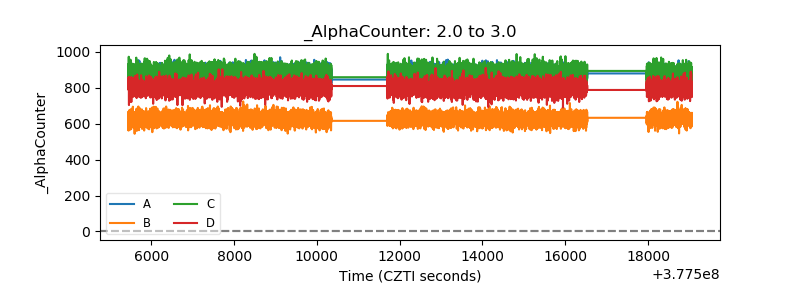 |
| _CPM_Rate | 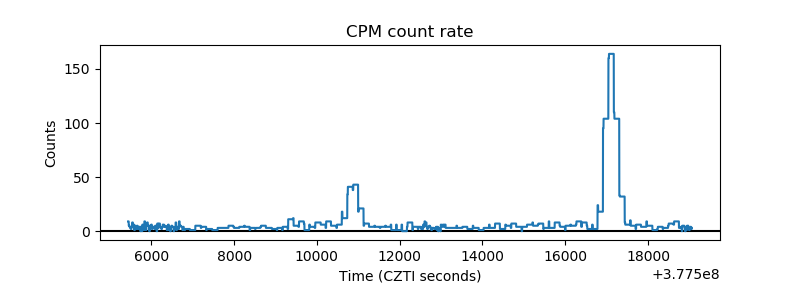 |
| CZT Counter | 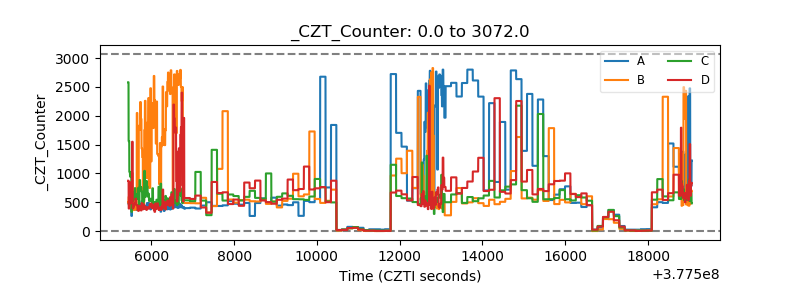 |
| +2.5 Volts monitor |  |
| +5 Volts monitor |  |
| _ROLL_ROT | 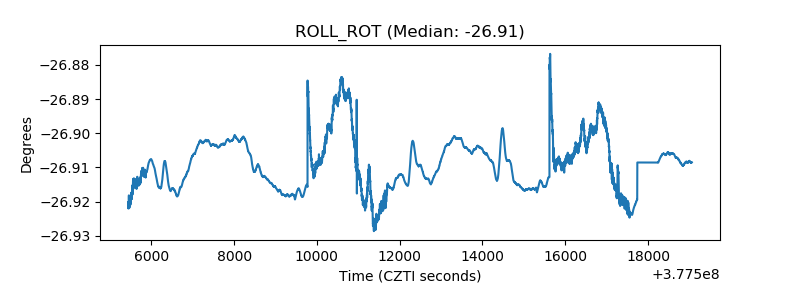 |
| _Roll_DEC | 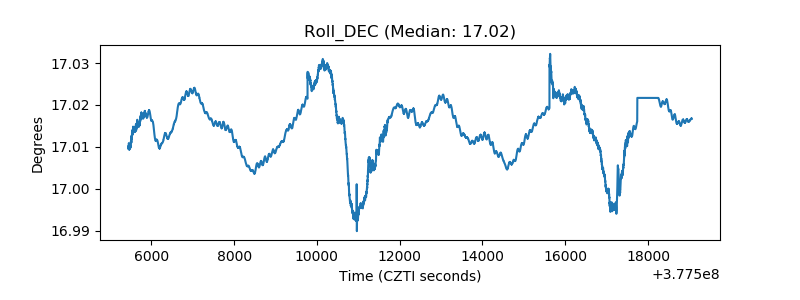 |
| _Roll_RA | 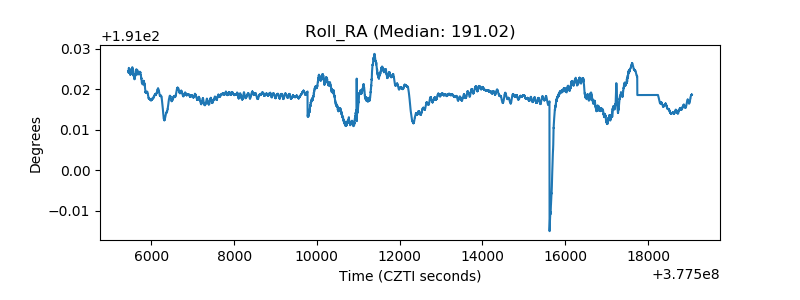 |
| Veto Counter | 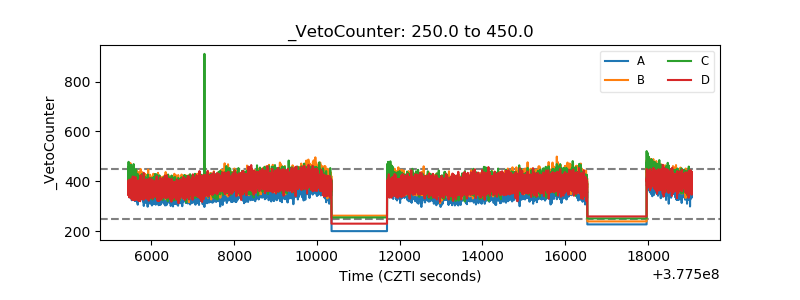 |