| Param | Original file | Final file |
|---|---|---|
| Filename | modeM0/AS1T04_076T01_9000004810_33649cztM0_level2.evt | modeM0/AS1T04_076T01_9000004810_33649cztM0_level2_quad_clean.evt |
| Size (bytes) | 599,126,400 | 59,097,600 |
| Size | 571.4 MB | 56.4 MB |
| Events in quadrant A | 5,038,592 | 349,927 |
| Events in quadrant B | 4,453,370 | 347,648 |
| Events in quadrant C | 3,783,530 | 353,962 |
| Events in quadrant D | 4,484,993 | 340,168 |
| Mode SS | |||
|---|---|---|---|
| Quadrant | BADHDUFLAG | Total packets | Discarded packets |
| A | 0 | 114 | 0 |
| B | 0 | 114 | 0 |
| C | 0 | 114 | 0 |
| D | 0 | 114 | 0 |
| Mode M9 | |||
|---|---|---|---|
| Quadrant | BADHDUFLAG | Total packets | Discarded packets |
| A | 0 | 19 | 0 |
| B | 0 | 19 | 0 |
| C | 0 | 19 | 0 |
| D | 0 | 20 | 0 |
| Mode M0 | |||
|---|---|---|---|
| Quadrant | BADHDUFLAG | Total packets | Discarded packets |
| A | 0 | 18606 | 3 |
| B | 0 | 16819 | 2 |
| C | 0 | 14700 | 2 |
| D | 0 | 17396 | 2 |
| Quadrant | Total seconds | Saturated seconds | Saturation percentage |
|---|---|---|---|
| A | 5688 | 618 | 10.864979% |
| B | 5688 | 517 | 9.089311% |
| C | 5688 | 99 | 1.740506% |
| D | 5688 | 129 | 2.267932% |
Noise dominated data is calculated using 1-second bins in cleaned event files. If a bin has >2000 counts, and if more than 50% of those come from <1% of pixels, then it is considered to be noise-dominated and hence unusable.
| Quadrant | # 1 sec bins | Bins with >0 counts | Bins with >2000 counts | High rate bins dominated by noise | Noise dominated (total time) | Noise dominated (detector-on time) | Marked lightcurve |
|---|---|---|---|---|---|---|---|
| A | 7241 | 5689 | 509 | 509 | 7.03% | 8.95% | 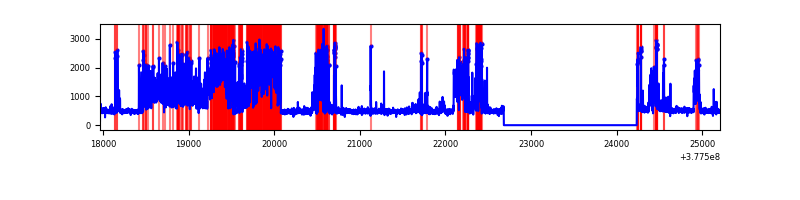 |
| B | 7241 | 5688 | 437 | 437 | 6.04% | 7.68% | 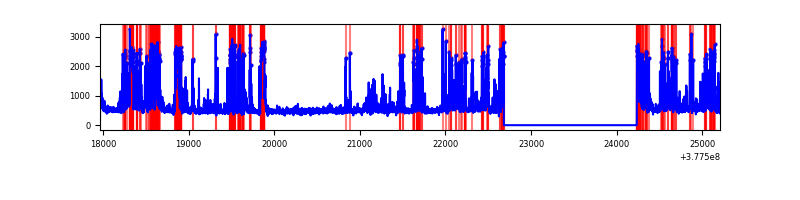 |
| C | 7241 | 5689 | 79 | 79 | 1.09% | 1.39% | 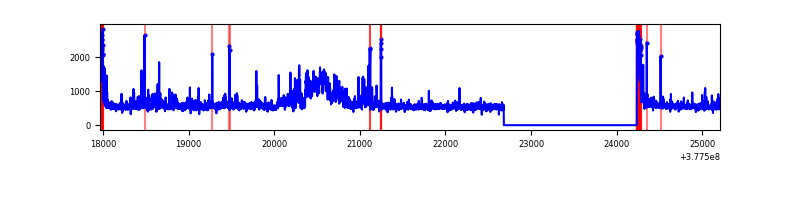 |
| D | 7241 | 5689 | 116 | 116 | 1.60% | 2.04% | 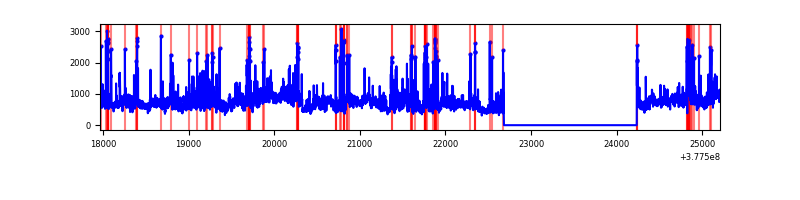 |
Top three noisy pixels from each quadrant. If the there are fewer than three noisy pixels in the level2.evt file, extra rows are filled as -1
| Pixel properties | Quadrant properties | ||||||
|---|---|---|---|---|---|---|---|
| Quadrant | DetID | PixID | Counts | Sigma | Mean | Median | Sigma |
| A | 15 | 169 | 1818824 | 13561.15 | 659 | 645 | 134.1 |
| A | 15 | 237 | 564043 | 4202.19 | 659 | 645 | 134.1 |
| A | 7 | 16 | 84690 | 626.86 | 659 | 645 | 134.1 |
| B | 5 | 172 | 1655548 | 13089.82 | 656 | 637 | 126.4 |
| B | 15 | 222 | 50306 | 392.87 | 656 | 637 | 126.4 |
| B | 0 | 229 | 35372 | 274.74 | 656 | 637 | 126.4 |
| C | 3 | 233 | 639844 | 4192.86 | 658 | 663 | 152.4 |
| C | 15 | 214 | 265205 | 1735.33 | 658 | 663 | 152.4 |
| C | 0 | 10 | 224012 | 1465.11 | 658 | 663 | 152.4 |
| D | 8 | 195 | 1014705 | 5746.66 | 655 | 641 | 176.5 |
| D | 7 | 223 | 161680 | 912.6 | 655 | 641 | 176.5 |
| D | 2 | 250 | 157430 | 888.52 | 655 | 641 | 176.5 |
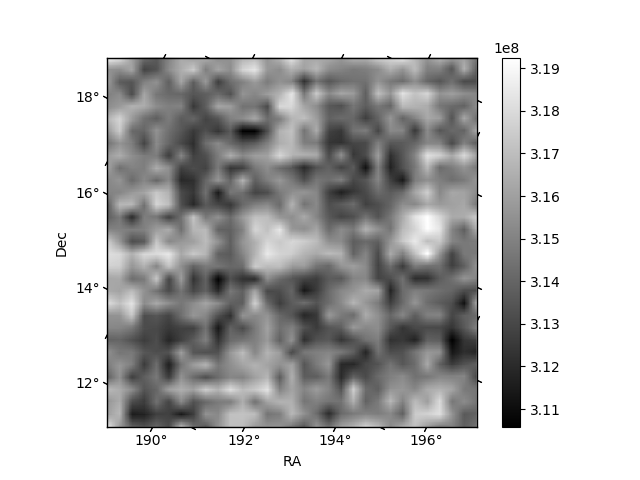
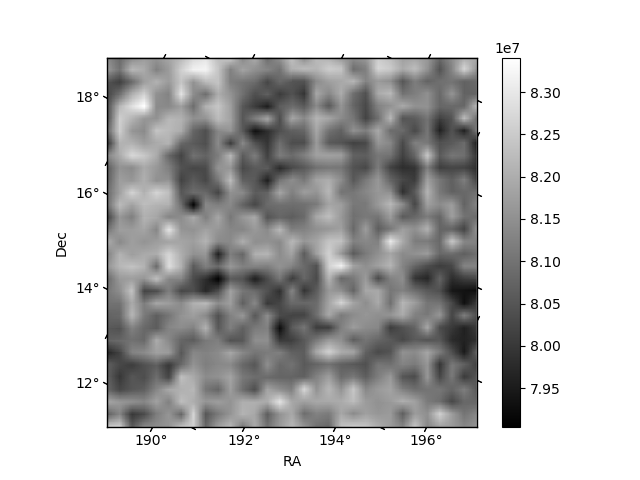
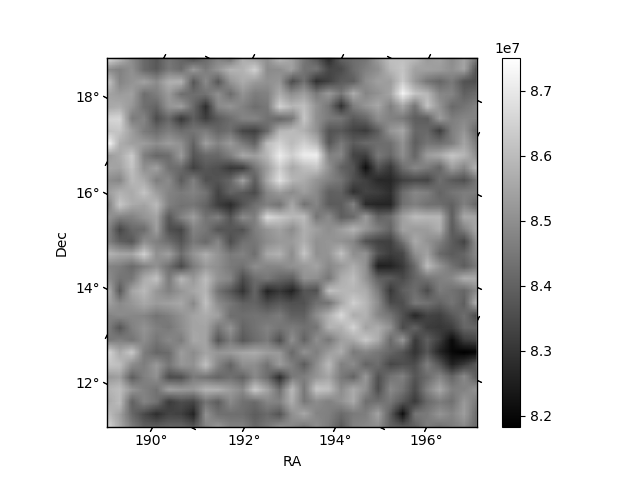
Histogram calculated using DETX and DETY for each event in the final _common_clean file
| Quadrant A | 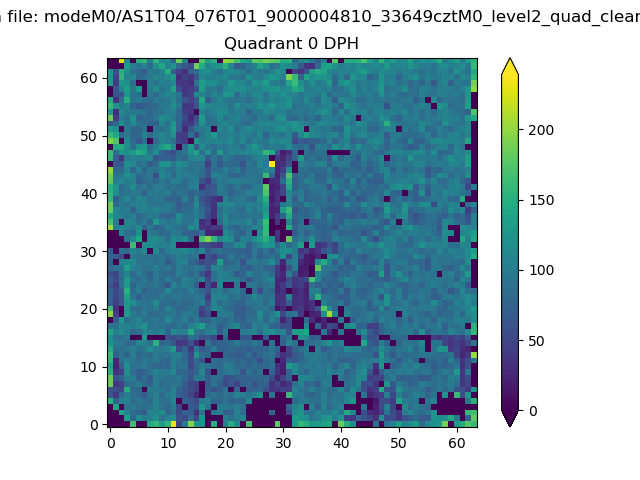 |
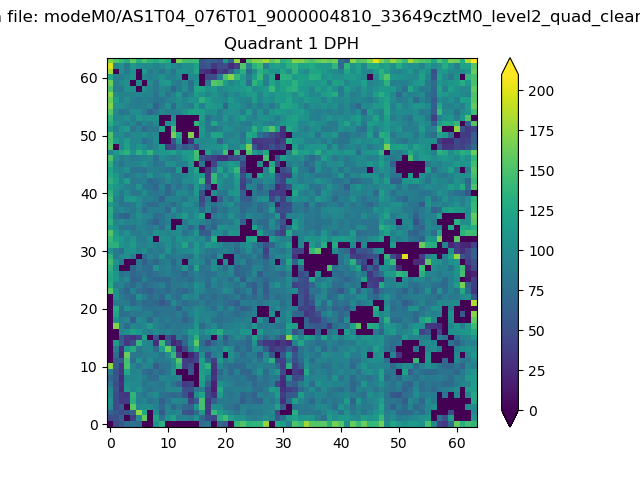 |
Quadrant B |
|---|---|---|---|
| Quadrant D |  |
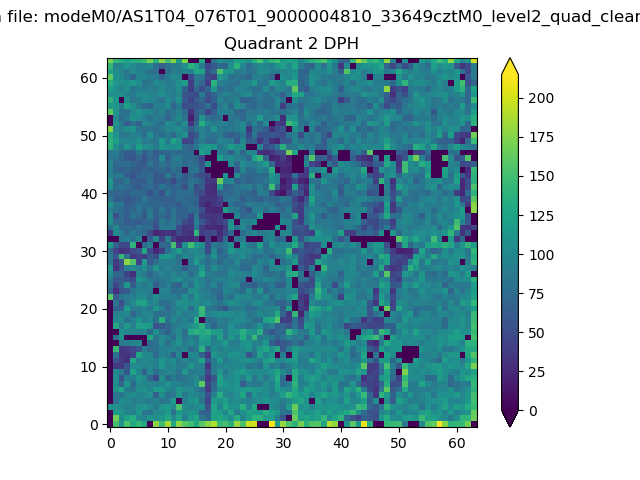 |
Quadrant C |
| Plot type | Count rate plots | Images |
|---|---|---|
| Comparison with Poisson distribution Blue bars denote a histogram of data divided into 1 sec bins. Red curve is a Poisson curve with rate = median count rate of data. |
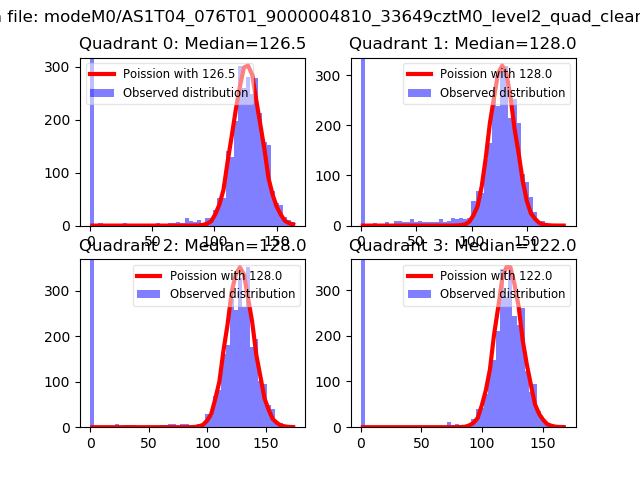 |
 |
| Quadrant-wise count rates Data is divided into 100 sec bins |
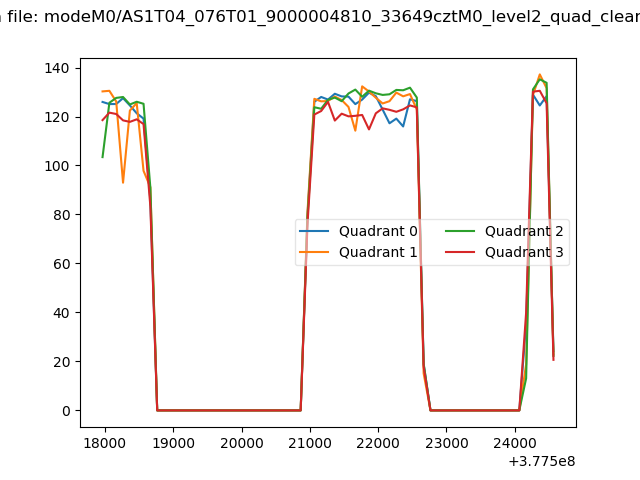 |
|
| Module-wise count rates for Quadrant A Data is divided into 100 sec bins |
 |
 |
| Module-wise count rates for Quadrant B Data is divided into 100 sec bins |
 |
 |
| Module-wise count rates for Quadrant C Data is divided into 100 sec bins |
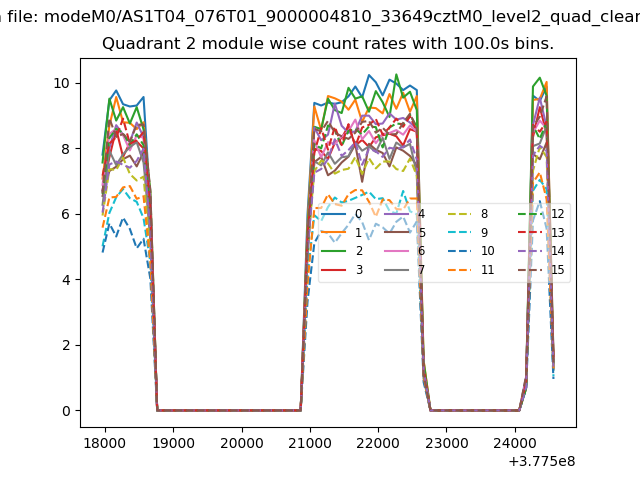 |
 |
| Module-wise count rates for Quadrant D Data is divided into 100 sec bins |
 |
 |
| Parameter | Plot |
|---|---|
| CZT HV Monitor |  |
| D_VDD | 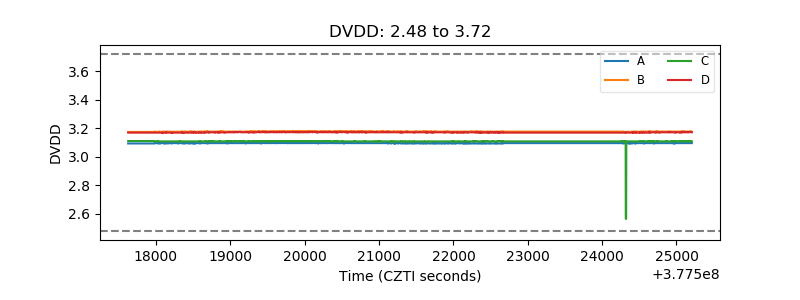 |
| Temperature 1 | 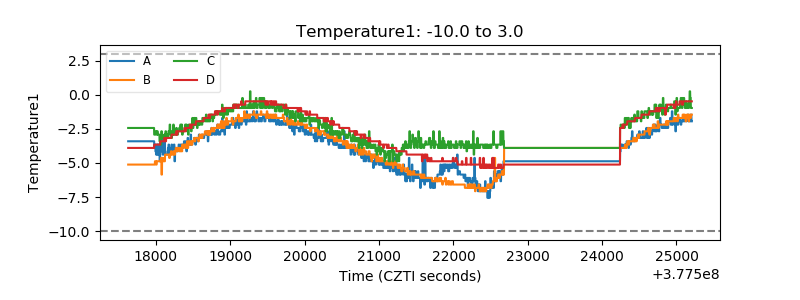 |
| Veto HV Monitor | 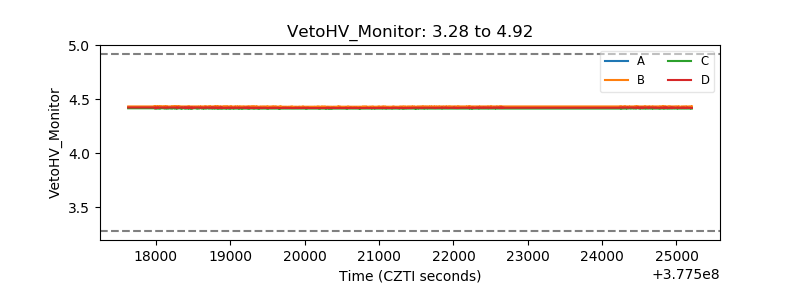 |
| Veto LLD |  |
| Alpha Counter | 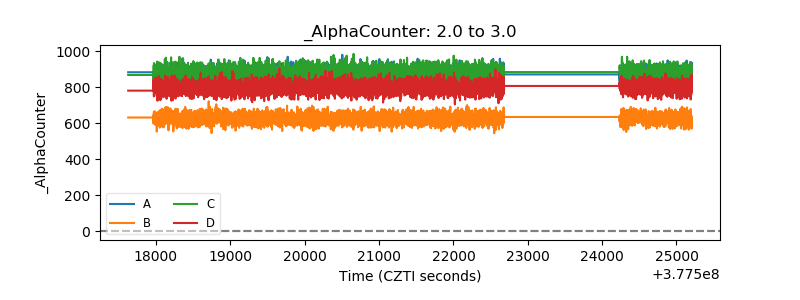 |
| _CPM_Rate | 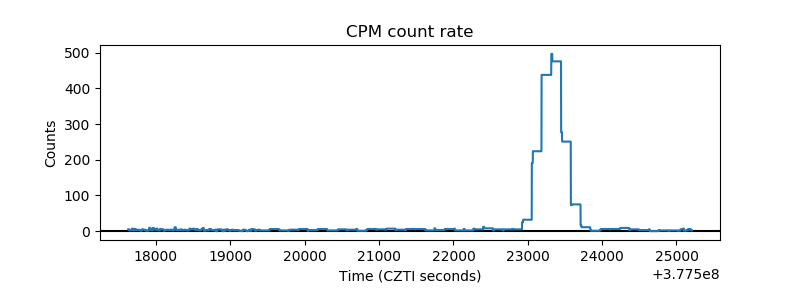 |
| CZT Counter | 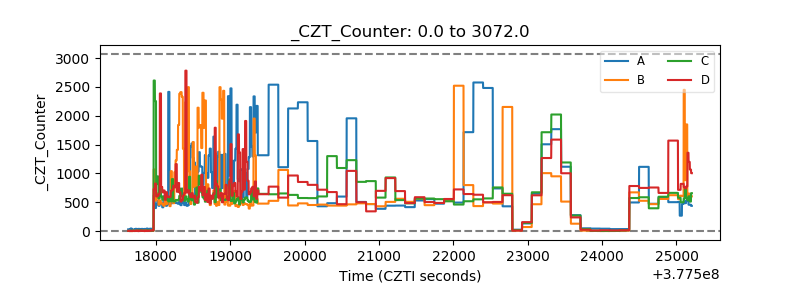 |
| +2.5 Volts monitor |  |
| +5 Volts monitor | 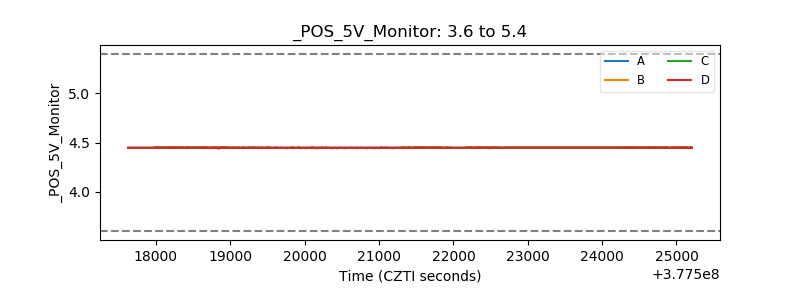 |
| _ROLL_ROT | 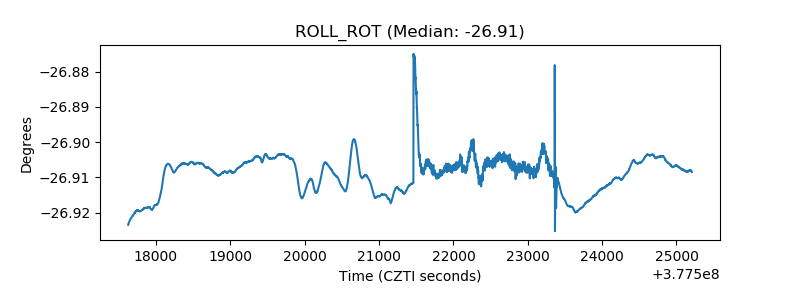 |
| _Roll_DEC | 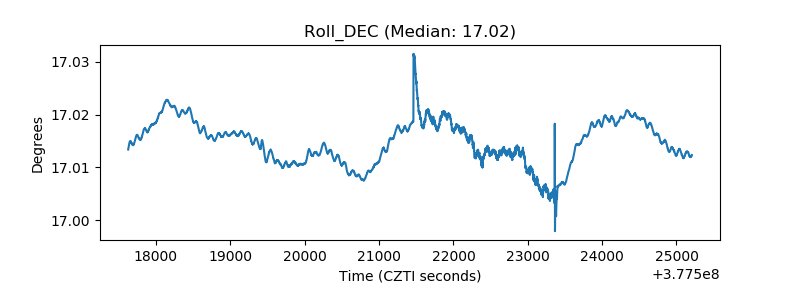 |
| _Roll_RA | 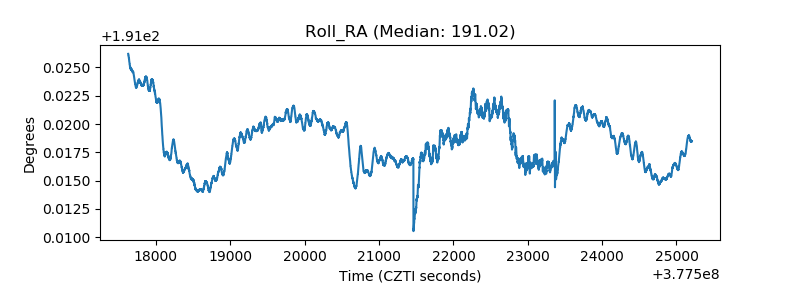 |
| Veto Counter | 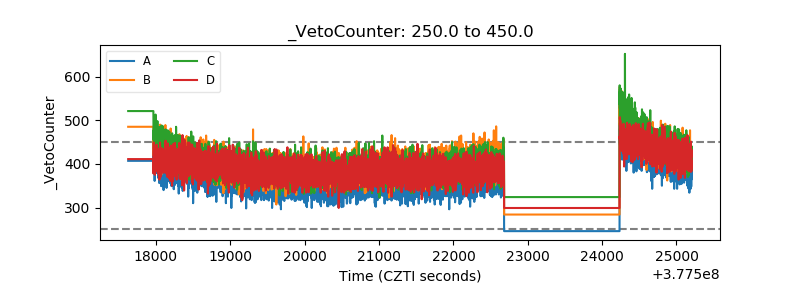 |