| Param | Original file | Final file |
|---|---|---|
| Filename | modeM0/AS1T04_076T01_9000004810_33650cztM0_level2.evt | modeM0/AS1T04_076T01_9000004810_33650cztM0_level2_quad_clean.evt |
| Size (bytes) | 583,850,880 | 51,203,520 |
| Size | 556.8 MB | 48.8 MB |
| Events in quadrant A | 3,470,535 | 294,425 |
| Events in quadrant B | 5,104,051 | 290,779 |
| Events in quadrant C | 3,626,217 | 298,864 |
| Events in quadrant D | 5,106,738 | 278,244 |
| Mode SS | |||
|---|---|---|---|
| Quadrant | BADHDUFLAG | Total packets | Discarded packets |
| A | 0 | 114 | 0 |
| B | 0 | 114 | 0 |
| C | 0 | 114 | 0 |
| D | 0 | 114 | 0 |
| Mode M9 | |||
|---|---|---|---|
| Quadrant | BADHDUFLAG | Total packets | Discarded packets |
| A | 0 | 21 | 0 |
| B | 0 | 21 | 0 |
| C | 0 | 21 | 0 |
| D | 0 | 22 | 0 |
| Mode M0 | |||
|---|---|---|---|
| Quadrant | BADHDUFLAG | Total packets | Discarded packets |
| A | 0 | 13806 | 3 |
| B | 0 | 18766 | 2 |
| C | 0 | 14269 | 2 |
| D | 0 | 19098 | 2 |
| Quadrant | Total seconds | Saturated seconds | Saturation percentage |
|---|---|---|---|
| A | 5533 | 193 | 3.488162% |
| B | 5533 | 804 | 14.530996% |
| C | 5533 | 117 | 2.114585% |
| D | 5533 | 360 | 6.506416% |
Noise dominated data is calculated using 1-second bins in cleaned event files. If a bin has >2000 counts, and if more than 50% of those come from <1% of pixels, then it is considered to be noise-dominated and hence unusable.
| Quadrant | # 1 sec bins | Bins with >0 counts | Bins with >2000 counts | High rate bins dominated by noise | Noise dominated (total time) | Noise dominated (detector-on time) | Marked lightcurve |
|---|---|---|---|---|---|---|---|
| A | 7206 | 5534 | 132 | 132 | 1.83% | 2.39% | 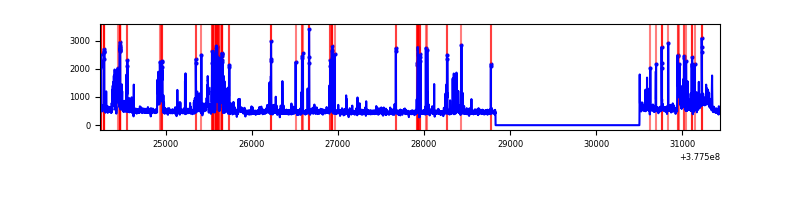 |
| B | 7206 | 5534 | 673 | 673 | 9.34% | 12.16% | 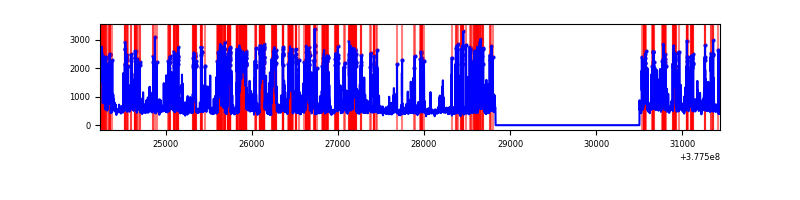 |
| C | 7206 | 5534 | 106 | 106 | 1.47% | 1.92% | 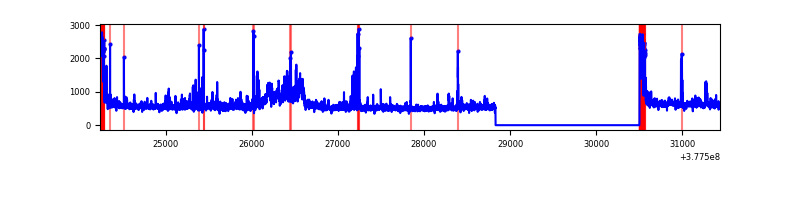 |
| D | 7206 | 5534 | 347 | 347 | 4.82% | 6.27% | 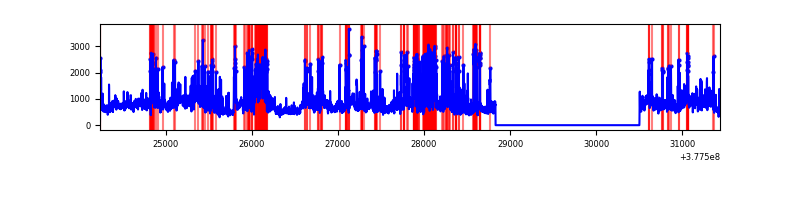 |
Top three noisy pixels from each quadrant. If the there are fewer than three noisy pixels in the level2.evt file, extra rows are filled as -1
| Pixel properties | Quadrant properties | ||||||
|---|---|---|---|---|---|---|---|
| Quadrant | DetID | PixID | Counts | Sigma | Mean | Median | Sigma |
| A | 15 | 237 | 591903 | 4402.85 | 667 | 653 | 134.3 |
| A | 15 | 169 | 253171 | 1880.42 | 667 | 653 | 134.3 |
| A | 13 | 6 | 22428 | 162.15 | 667 | 653 | 134.3 |
| B | 5 | 172 | 2261454 | 18605.13 | 634 | 618 | 121.5 |
| B | 5 | 200 | 157990 | 1295.06 | 634 | 618 | 121.5 |
| B | 4 | 251 | 29948 | 241.37 | 634 | 618 | 121.5 |
| C | 3 | 233 | 380917 | 2496.41 | 654 | 659 | 152.3 |
| C | 0 | 10 | 278542 | 1824.31 | 654 | 659 | 152.3 |
| C | 15 | 214 | 257531 | 1686.37 | 654 | 659 | 152.3 |
| D | 8 | 195 | 982092 | 5508.55 | 644 | 632 | 178.2 |
| D | 2 | 250 | 560874 | 3144.42 | 644 | 632 | 178.2 |
| D | 7 | 223 | 261389 | 1463.53 | 644 | 632 | 178.2 |
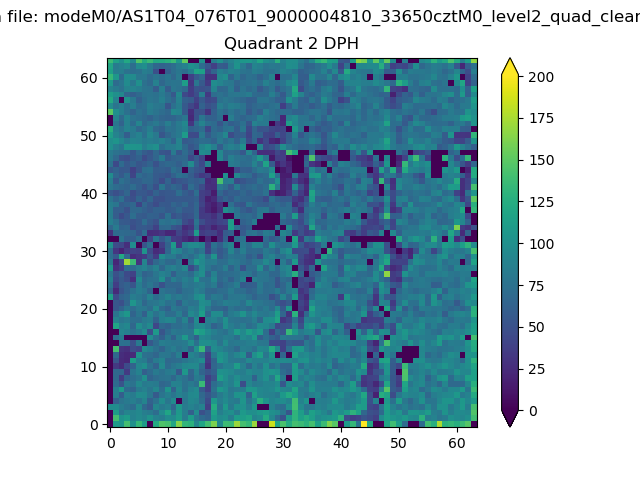
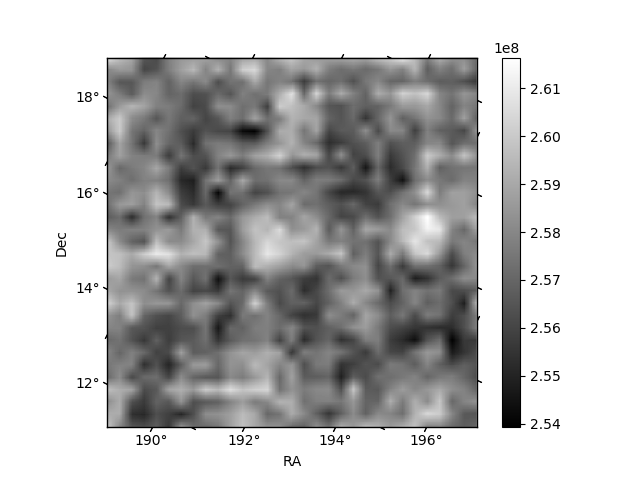
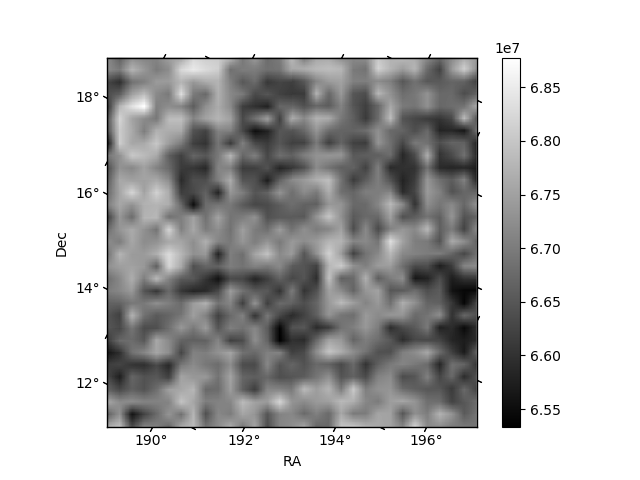
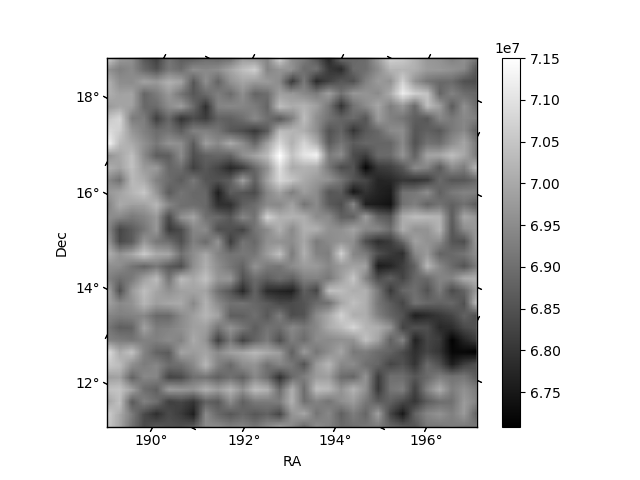
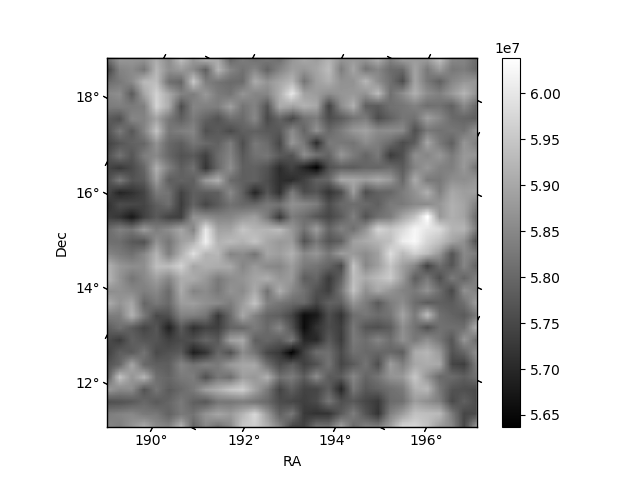
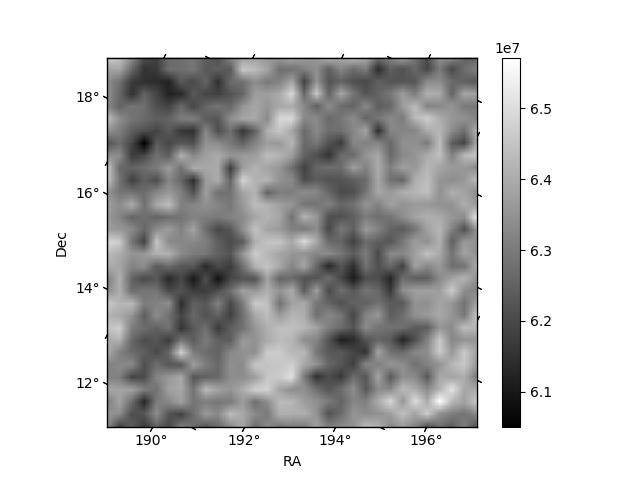
Histogram calculated using DETX and DETY for each event in the final _common_clean file
| Quadrant A | 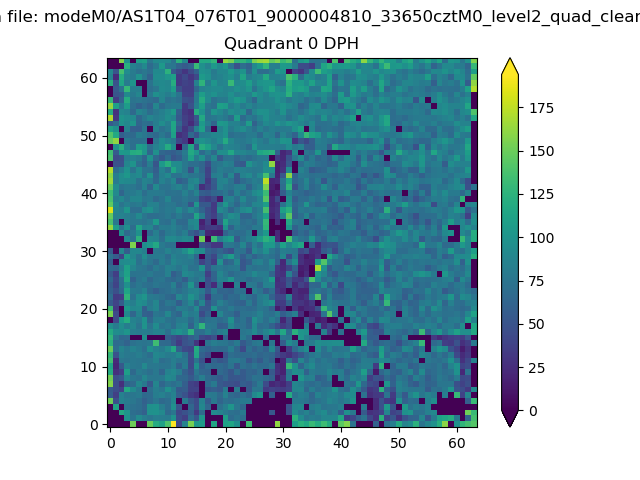 |
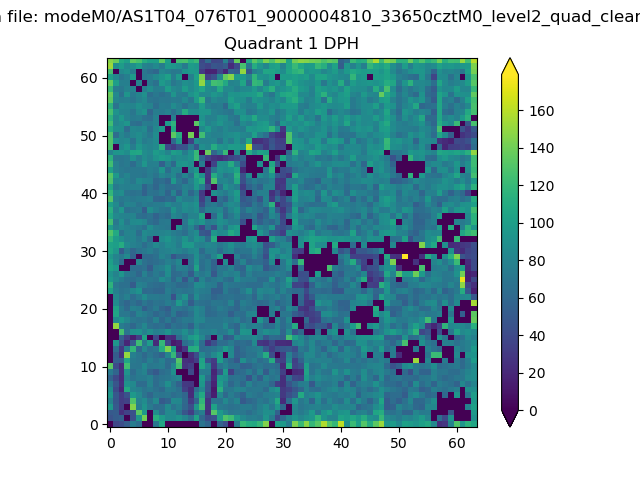 |
Quadrant B |
|---|---|---|---|
| Quadrant D | 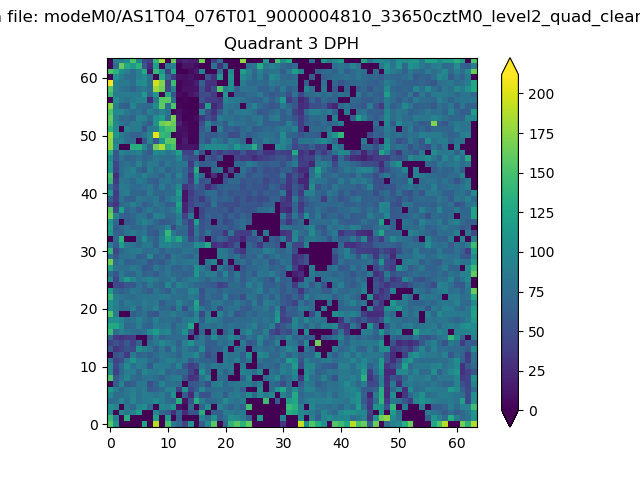 |
 |
Quadrant C |
| Plot type | Count rate plots | Images |
|---|---|---|
| Comparison with Poisson distribution Blue bars denote a histogram of data divided into 1 sec bins. Red curve is a Poisson curve with rate = median count rate of data. |
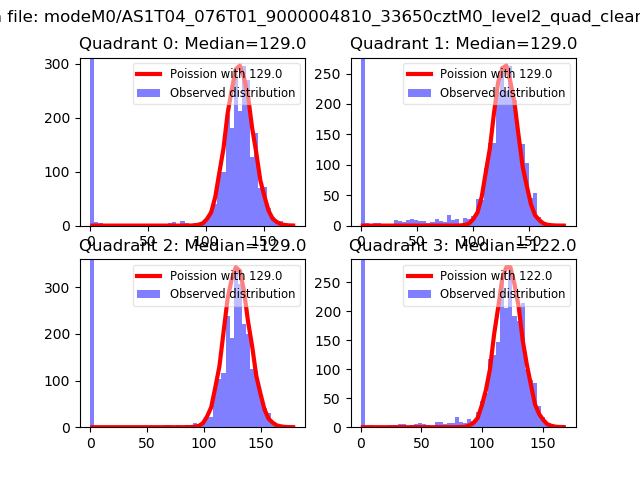 |
 |
| Quadrant-wise count rates Data is divided into 100 sec bins |
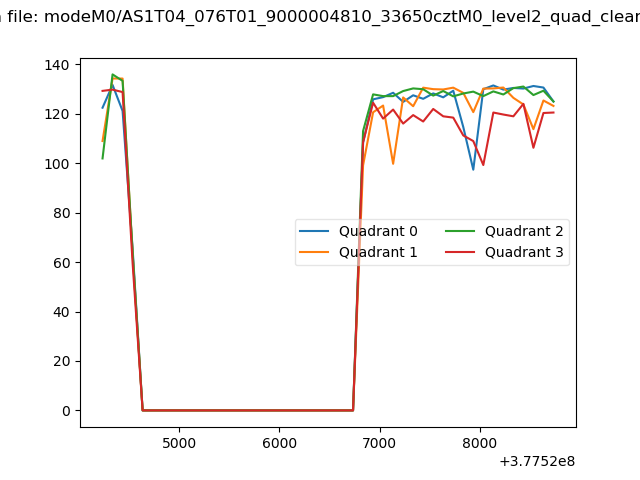 |
|
| Module-wise count rates for Quadrant A Data is divided into 100 sec bins |
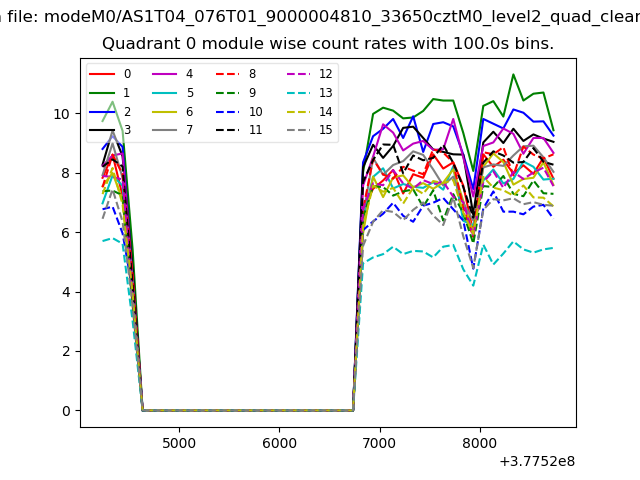 |
 |
| Module-wise count rates for Quadrant B Data is divided into 100 sec bins |
 |
 |
| Module-wise count rates for Quadrant C Data is divided into 100 sec bins |
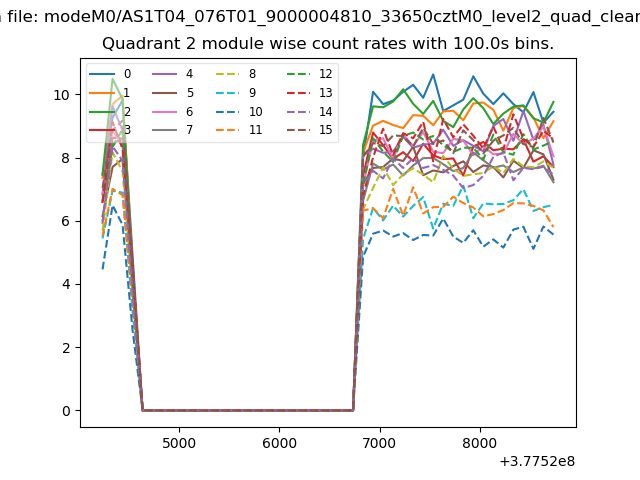 |
 |
| Module-wise count rates for Quadrant D Data is divided into 100 sec bins |
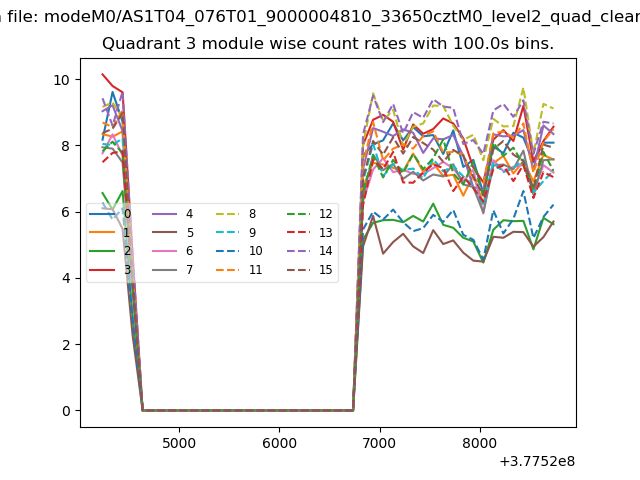 |
 |
| Parameter | Plot |
|---|---|
| CZT HV Monitor | 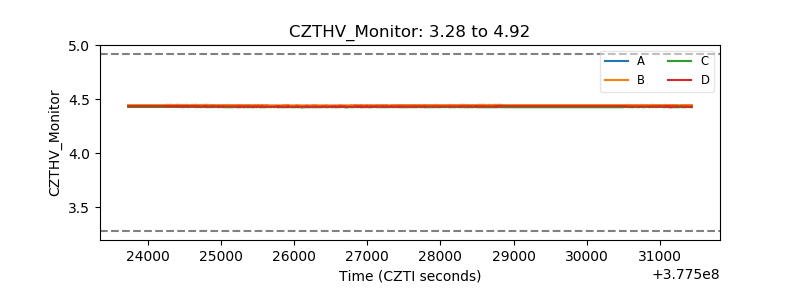 |
| D_VDD | 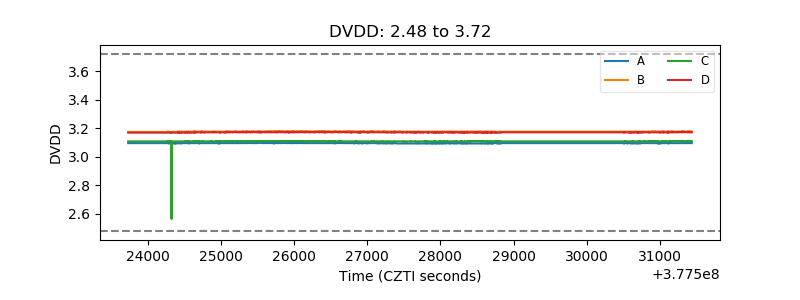 |
| Temperature 1 | 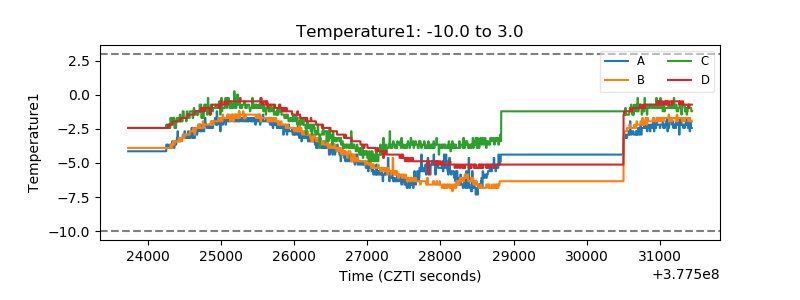 |
| Veto HV Monitor |  |
| Veto LLD | 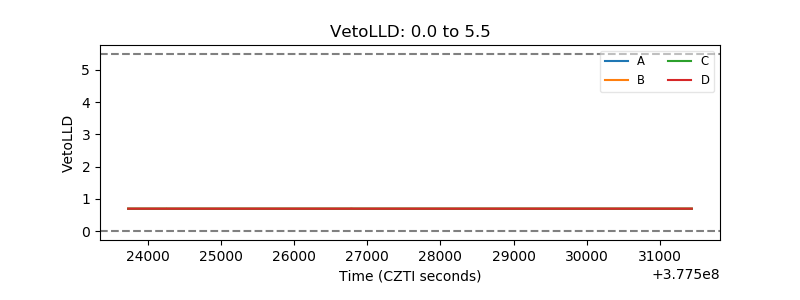 |
| Alpha Counter | 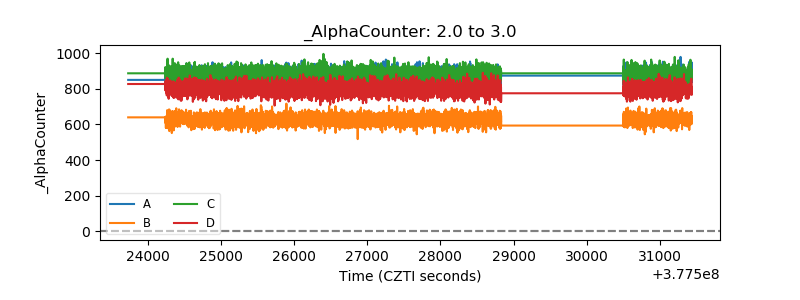 |
| _CPM_Rate | 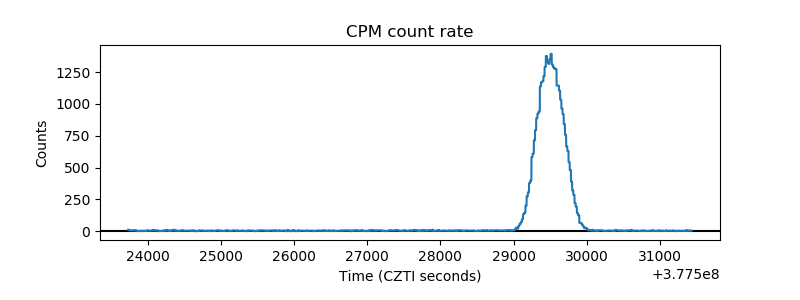 |
| CZT Counter | 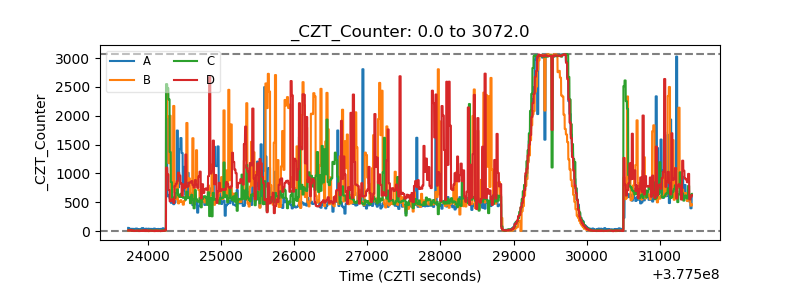 |
| +2.5 Volts monitor |  |
| +5 Volts monitor |  |
| _ROLL_ROT | 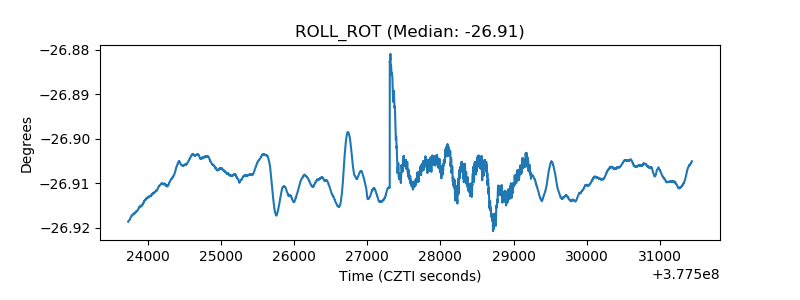 |
| _Roll_DEC |  |
| _Roll_RA | 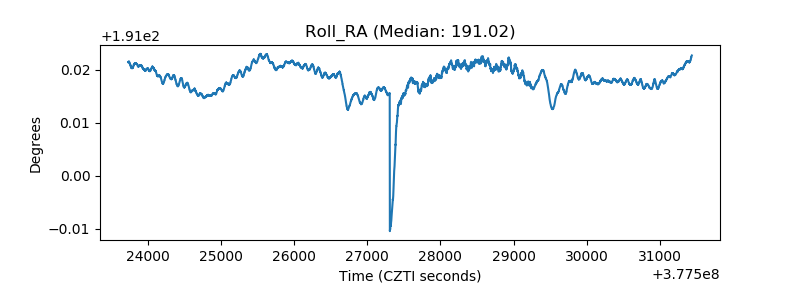 |
| Veto Counter | 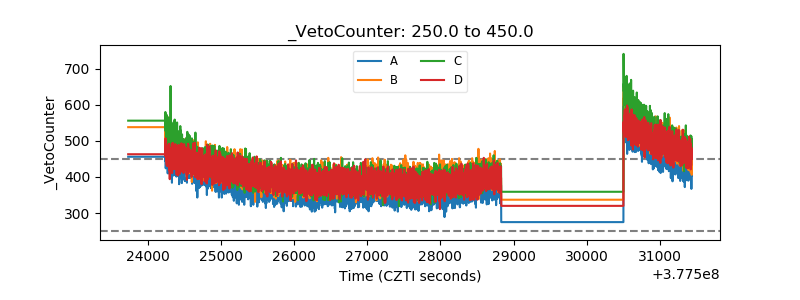 |