| Param | Original file | Final file |
|---|---|---|
| Filename | modeM0/AS1T04_076T01_9000004810_33652cztM0_level2.evt | modeM0/AS1T04_076T01_9000004810_33652cztM0_level2_quad_clean.evt |
| Size (bytes) | 544,230,720 | 51,566,400 |
| Size | 519.0 MB | 49.2 MB |
| Events in quadrant A | 3,363,248 | 300,381 |
| Events in quadrant B | 4,516,025 | 298,604 |
| Events in quadrant C | 3,431,022 | 305,528 |
| Events in quadrant D | 4,808,344 | 280,657 |
| Mode SS | |||
|---|---|---|---|
| Quadrant | BADHDUFLAG | Total packets | Discarded packets |
| A | 0 | 110 | 0 |
| B | 0 | 110 | 0 |
| C | 0 | 110 | 0 |
| D | 0 | 110 | 0 |
| Mode M9 | |||
|---|---|---|---|
| Quadrant | BADHDUFLAG | Total packets | Discarded packets |
| A | 0 | 23 | 0 |
| B | 0 | 23 | 0 |
| C | 0 | 23 | 0 |
| D | 0 | 24 | 0 |
| Mode M0 | |||
|---|---|---|---|
| Quadrant | BADHDUFLAG | Total packets | Discarded packets |
| A | 0 | 13430 | 3 |
| B | 0 | 16911 | 2 |
| C | 0 | 13525 | 2 |
| D | 0 | 17966 | 2 |
| Quadrant | Total seconds | Saturated seconds | Saturation percentage |
|---|---|---|---|
| A | 5366 | 174 | 3.242639% |
| B | 5366 | 535 | 9.970183% |
| C | 5366 | 99 | 1.844950% |
| D | 5366 | 320 | 5.963474% |
Noise dominated data is calculated using 1-second bins in cleaned event files. If a bin has >2000 counts, and if more than 50% of those come from <1% of pixels, then it is considered to be noise-dominated and hence unusable.
| Quadrant | # 1 sec bins | Bins with >0 counts | Bins with >2000 counts | High rate bins dominated by noise | Noise dominated (total time) | Noise dominated (detector-on time) | Marked lightcurve |
|---|---|---|---|---|---|---|---|
| A | 7157 | 5367 | 149 | 149 | 2.08% | 2.78% | 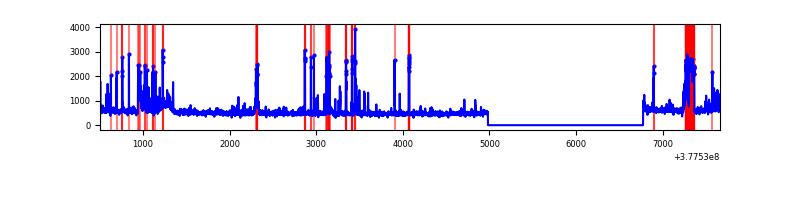 |
| B | 7157 | 5367 | 440 | 440 | 6.15% | 8.20% | 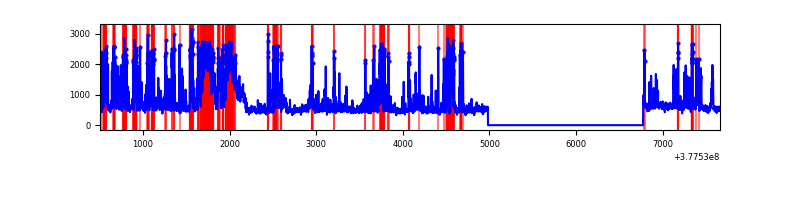 |
| C | 7157 | 5367 | 83 | 83 | 1.16% | 1.55% | 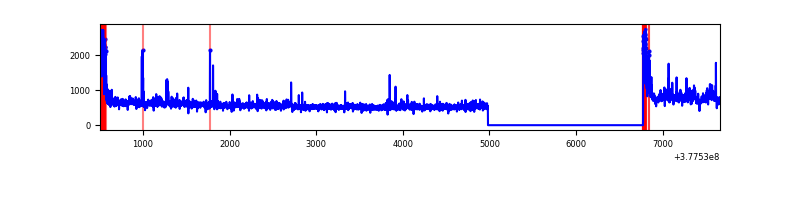 |
| D | 7157 | 5367 | 281 | 281 | 3.93% | 5.24% | 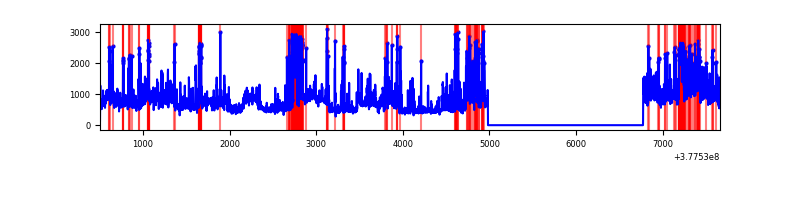 |
Top three noisy pixels from each quadrant. If the there are fewer than three noisy pixels in the level2.evt file, extra rows are filled as -1
| Pixel properties | Quadrant properties | ||||||
|---|---|---|---|---|---|---|---|
| Quadrant | DetID | PixID | Counts | Sigma | Mean | Median | Sigma |
| A | 15 | 237 | 512154 | 3785.81 | 672 | 660 | 135.1 |
| A | 15 | 169 | 200904 | 1482.1 | 672 | 660 | 135.1 |
| A | 13 | 6 | 18846 | 134.6 | 672 | 660 | 135.1 |
| B | 5 | 172 | 1205265 | 9701.6 | 653 | 636 | 124.2 |
| B | 4 | 170 | 525129 | 4224.06 | 653 | 636 | 124.2 |
| B | 5 | 200 | 80974 | 647.01 | 653 | 636 | 124.2 |
| C | 3 | 233 | 305268 | 2013.07 | 662 | 669 | 151.3 |
| C | 15 | 214 | 249127 | 1642.04 | 662 | 669 | 151.3 |
| C | 0 | 10 | 235511 | 1552.05 | 662 | 669 | 151.3 |
| D | 8 | 195 | 858968 | 4880.47 | 647 | 637 | 175.9 |
| D | 2 | 250 | 605038 | 3436.63 | 647 | 637 | 175.9 |
| D | 13 | 249 | 336156 | 1907.76 | 647 | 637 | 175.9 |
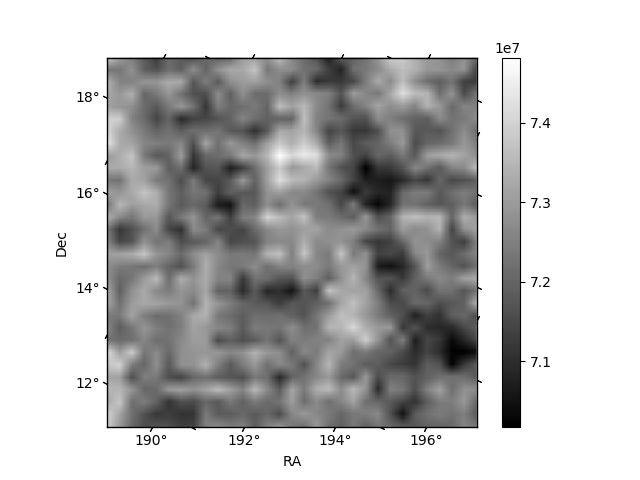
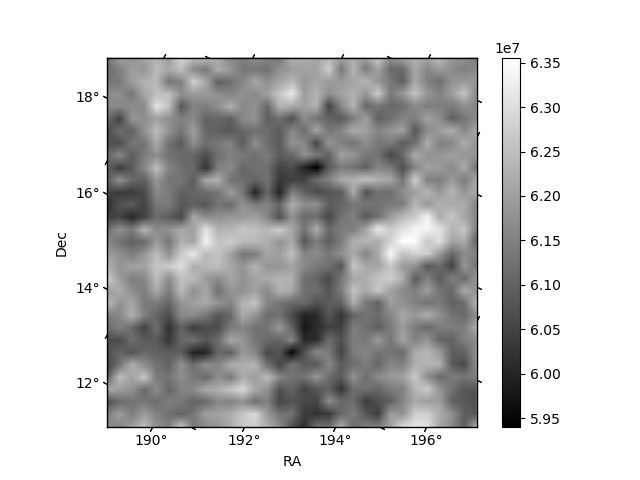
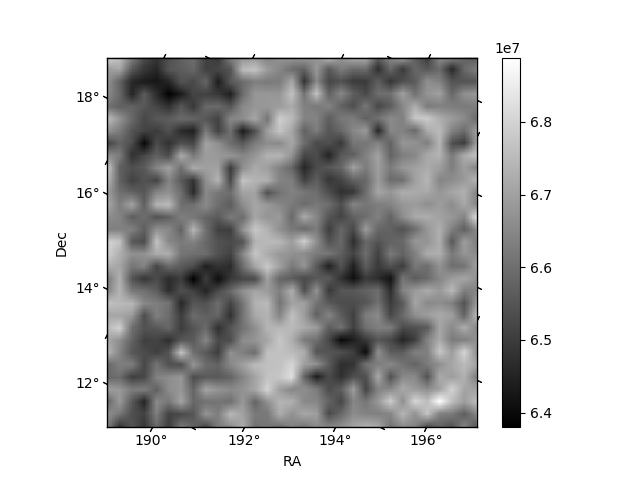
Histogram calculated using DETX and DETY for each event in the final _common_clean file
| Quadrant A |  |
 |
Quadrant B |
|---|---|---|---|
| Quadrant D |  |
 |
Quadrant C |
| Plot type | Count rate plots | Images |
|---|---|---|
| Comparison with Poisson distribution Blue bars denote a histogram of data divided into 1 sec bins. Red curve is a Poisson curve with rate = median count rate of data. |
 |
 |
| Quadrant-wise count rates Data is divided into 100 sec bins |
 |
|
| Module-wise count rates for Quadrant A Data is divided into 100 sec bins |
 |
 |
| Module-wise count rates for Quadrant B Data is divided into 100 sec bins |
 |
 |
| Module-wise count rates for Quadrant C Data is divided into 100 sec bins |
 |
 |
| Module-wise count rates for Quadrant D Data is divided into 100 sec bins |
 |
 |
| Parameter | Plot |
|---|---|
| CZT HV Monitor |  |
| D_VDD | 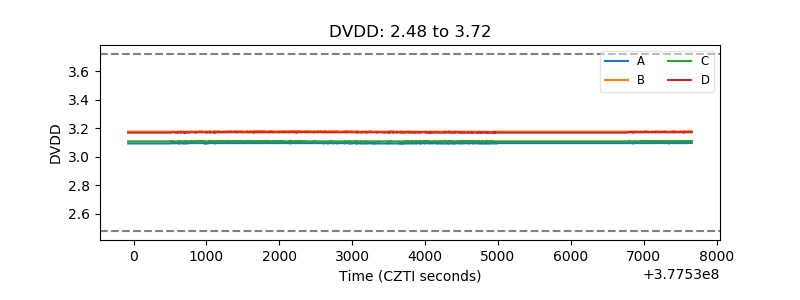 |
| Temperature 1 |  |
| Veto HV Monitor |  |
| Veto LLD |  |
| Alpha Counter |  |
| _CPM_Rate |  |
| CZT Counter |  |
| +2.5 Volts monitor |  |
| +5 Volts monitor |  |
| _ROLL_ROT |  |
| _Roll_DEC |  |
| _Roll_RA |  |
| Veto Counter |  |