| Param | Original file | Final file |
|---|---|---|
| Filename | modeM0/AS1T04_076T01_9000004810_33653cztM0_level2.evt | modeM0/AS1T04_076T01_9000004810_33653cztM0_level2_quad_clean.evt |
| Size (bytes) | 652,377,600 | 57,683,520 |
| Size | 622.2 MB | 55.0 MB |
| Events in quadrant A | 4,538,066 | 358,315 |
| Events in quadrant B | 4,702,974 | 318,977 |
| Events in quadrant C | 4,574,432 | 356,947 |
| Events in quadrant D | 5,580,590 | 336,621 |
| Mode SS | |||
|---|---|---|---|
| Quadrant | BADHDUFLAG | Total packets | Discarded packets |
| A | 0 | 108 | 0 |
| B | 0 | 108 | 0 |
| C | 0 | 108 | 0 |
| D | 0 | 108 | 0 |
| Mode M9 | |||
|---|---|---|---|
| Quadrant | BADHDUFLAG | Total packets | Discarded packets |
| A | 0 | 22 | 0 |
| B | 0 | 22 | 0 |
| C | 0 | 22 | 0 |
| D | 0 | 23 | 0 |
| Mode M0 | |||
|---|---|---|---|
| Quadrant | BADHDUFLAG | Total packets | Discarded packets |
| A | 0 | 16984 | 3 |
| B | 0 | 17504 | 2 |
| C | 0 | 17627 | 2 |
| D | 0 | 20295 | 2 |
| Quadrant | Total seconds | Saturated seconds | Saturation percentage |
|---|---|---|---|
| A | 5363 | 526 | 9.807943% |
| B | 5363 | 693 | 12.921872% |
| C | 5363 | 125 | 2.330785% |
| D | 5363 | 367 | 6.843185% |
Noise dominated data is calculated using 1-second bins in cleaned event files. If a bin has >2000 counts, and if more than 50% of those come from <1% of pixels, then it is considered to be noise-dominated and hence unusable.
| Quadrant | # 1 sec bins | Bins with >0 counts | Bins with >2000 counts | High rate bins dominated by noise | Noise dominated (total time) | Noise dominated (detector-on time) | Marked lightcurve |
|---|---|---|---|---|---|---|---|
| A | 7303 | 5363 | 421 | 421 | 5.76% | 7.85% | 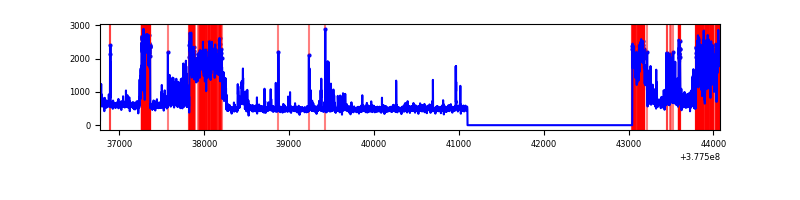 |
| B | 7304 | 5363 | 601 | 601 | 8.23% | 11.21% | 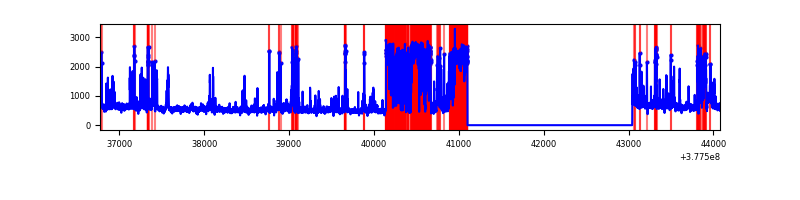 |
| C | 7304 | 5364 | 109 | 109 | 1.49% | 2.03% | 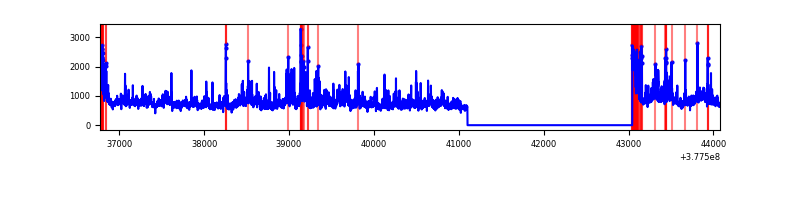 |
| D | 7304 | 5364 | 327 | 327 | 4.48% | 6.10% | 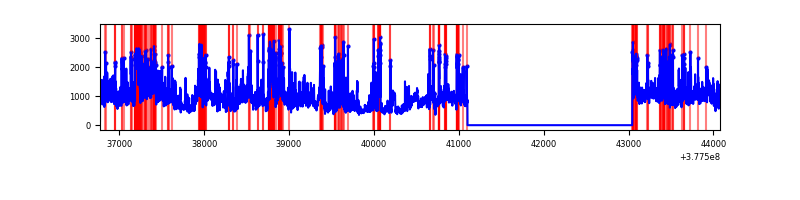 |
Top three noisy pixels from each quadrant. If the there are fewer than three noisy pixels in the level2.evt file, extra rows are filled as -1
| Pixel properties | Quadrant properties | ||||||
|---|---|---|---|---|---|---|---|
| Quadrant | DetID | PixID | Counts | Sigma | Mean | Median | Sigma |
| A | 15 | 237 | 1241268 | 8910.07 | 694 | 683 | 139.2 |
| A | 15 | 169 | 593649 | 4258.77 | 694 | 683 | 139.2 |
| A | 13 | 254 | 9647 | 64.38 | 694 | 683 | 139.2 |
| B | 5 | 172 | 992212 | 7867.42 | 676 | 661 | 126.0 |
| B | 15 | 222 | 714099 | 5660.74 | 676 | 661 | 126.0 |
| B | 0 | 229 | 200896 | 1588.76 | 676 | 661 | 126.0 |
| C | 3 | 233 | 1269140 | 8047.29 | 695 | 704 | 157.6 |
| C | 0 | 10 | 254659 | 1611.16 | 695 | 704 | 157.6 |
| C | 15 | 214 | 248686 | 1573.26 | 695 | 704 | 157.6 |
| D | 8 | 195 | 1195187 | 6784.39 | 681 | 667 | 176.1 |
| D | 2 | 250 | 501222 | 2842.95 | 681 | 667 | 176.1 |
| D | 7 | 223 | 201025 | 1137.95 | 681 | 667 | 176.1 |
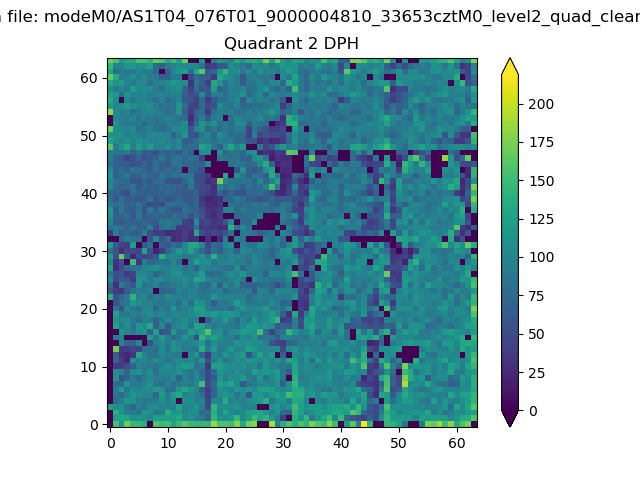
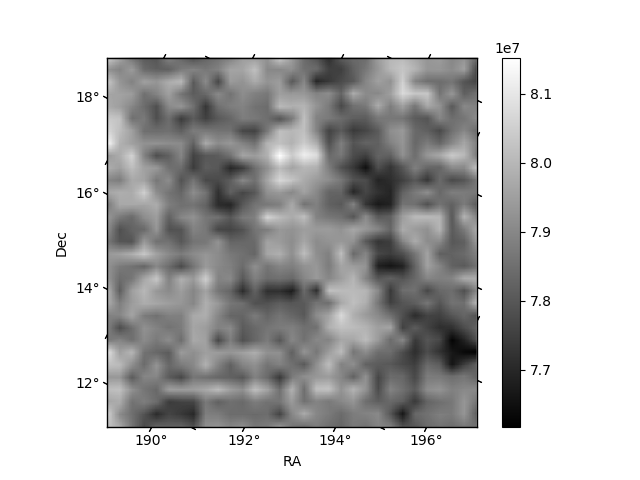
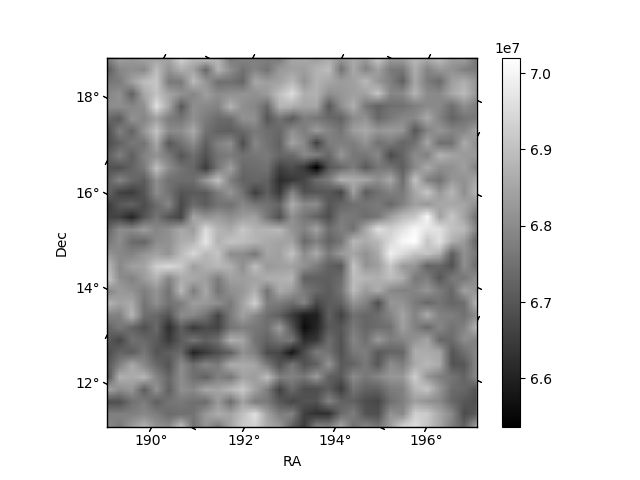
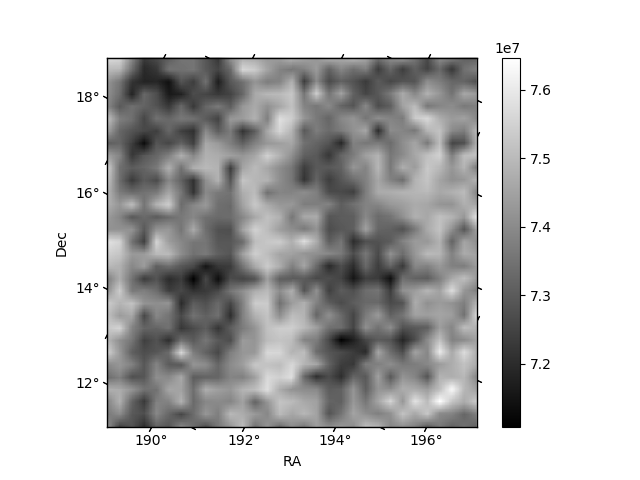
Histogram calculated using DETX and DETY for each event in the final _common_clean file
| Quadrant A | 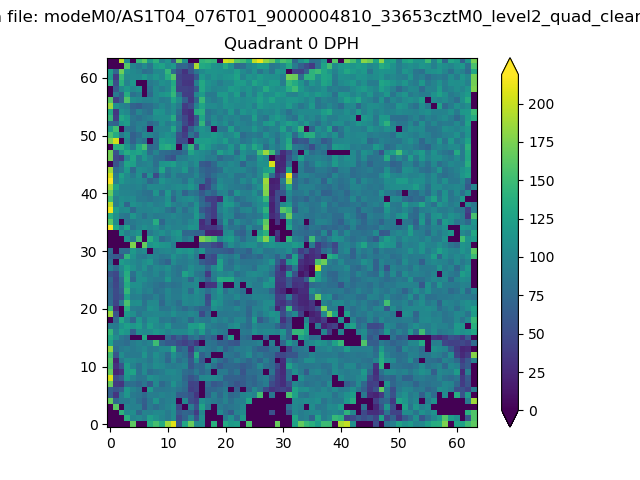 |
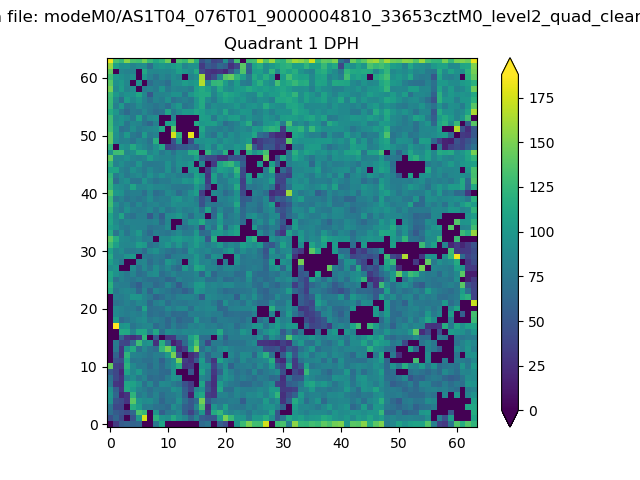 |
Quadrant B |
|---|---|---|---|
| Quadrant D | 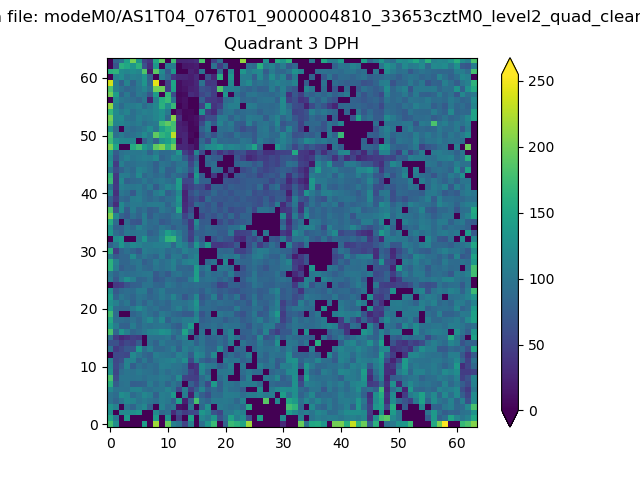 |
 |
Quadrant C |
| Plot type | Count rate plots | Images |
|---|---|---|
| Comparison with Poisson distribution Blue bars denote a histogram of data divided into 1 sec bins. Red curve is a Poisson curve with rate = median count rate of data. |
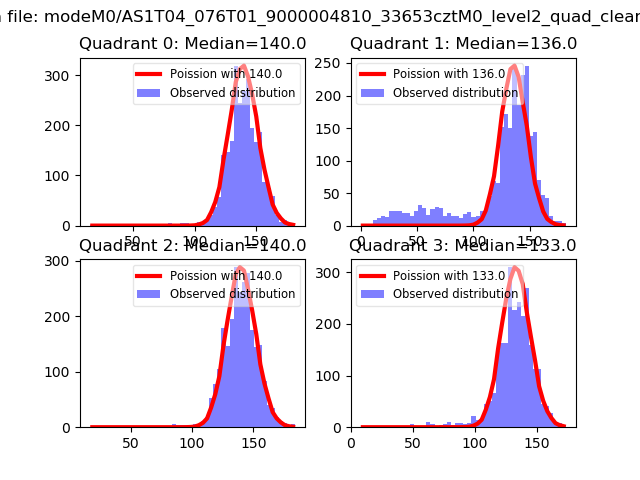 |
 |
| Quadrant-wise count rates Data is divided into 100 sec bins |
 |
|
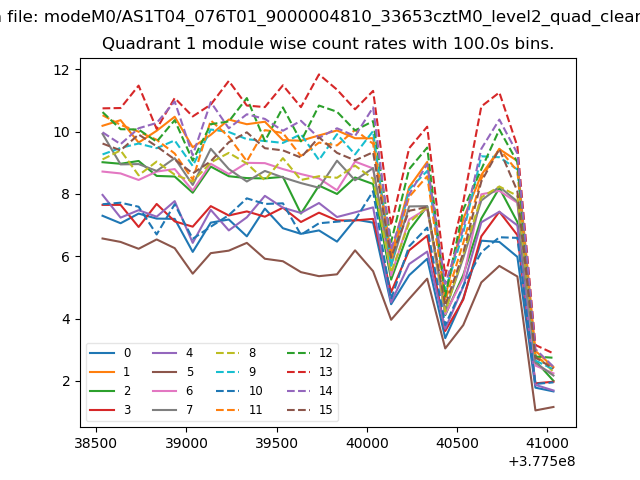
| Module-wise count rates for Quadrant A Data is divided into 100 sec bins |
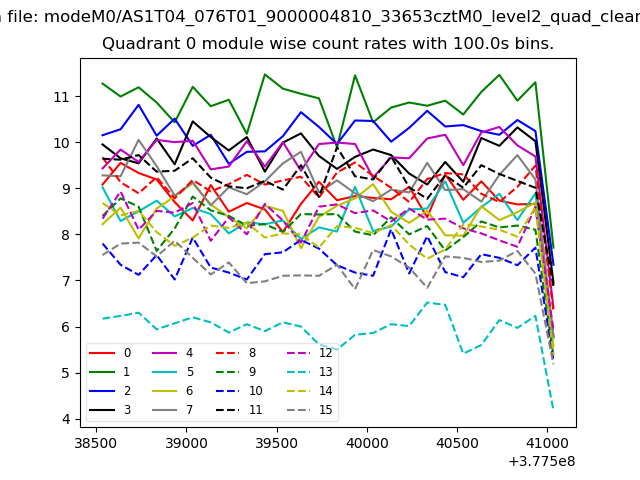 |
 |
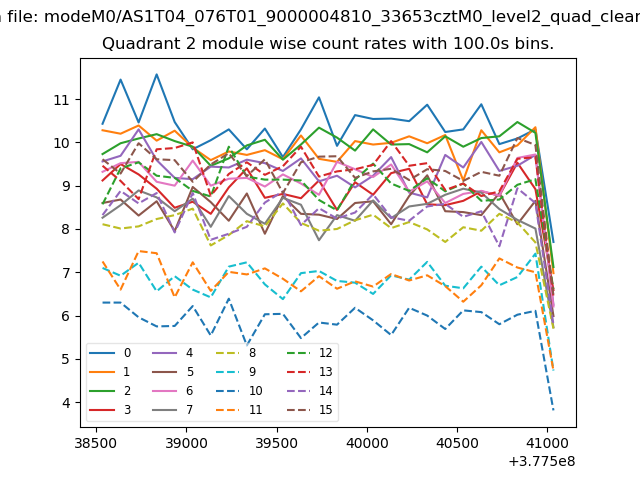
| Module-wise count rates for Quadrant B Data is divided into 100 sec bins |
 |
 |
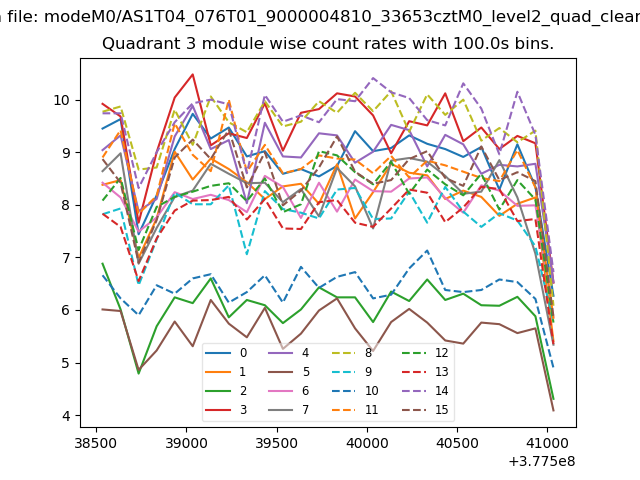
| Module-wise count rates for Quadrant C Data is divided into 100 sec bins |
 |
 |
| Module-wise count rates for Quadrant D Data is divided into 100 sec bins |
 |
 |
| Parameter | Plot |
|---|---|
| CZT HV Monitor | 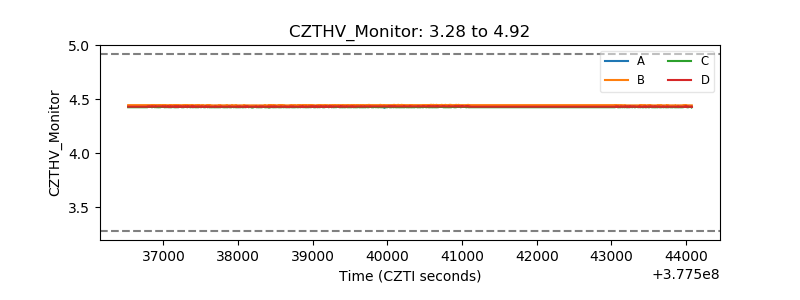 |
| D_VDD | 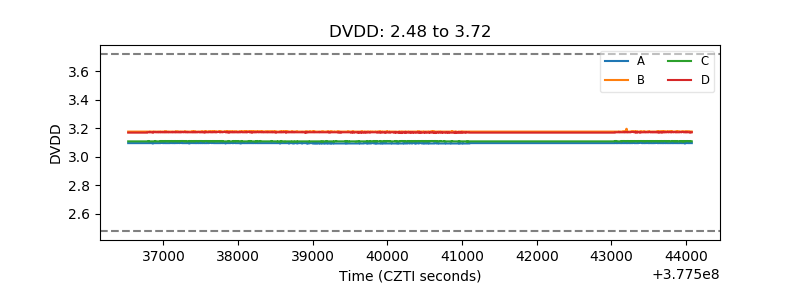 |
| Temperature 1 | 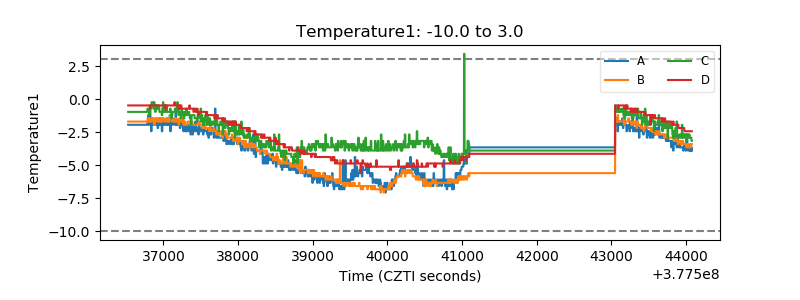 |
| Veto HV Monitor | 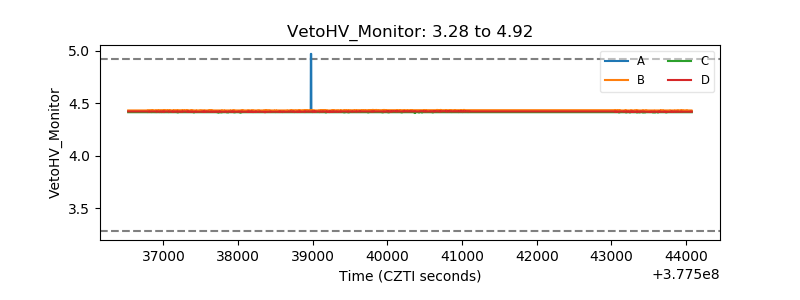 |
| Veto LLD | 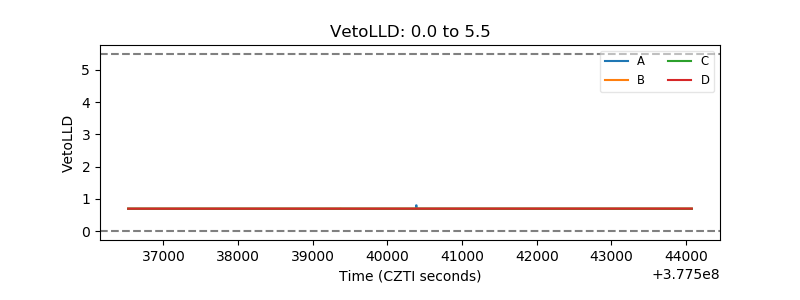 |
| Alpha Counter | 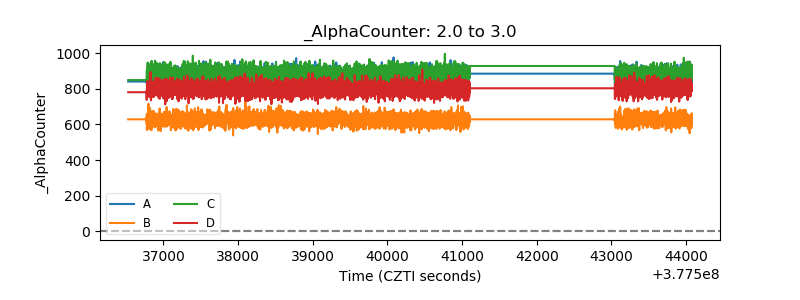 |
| _CPM_Rate | 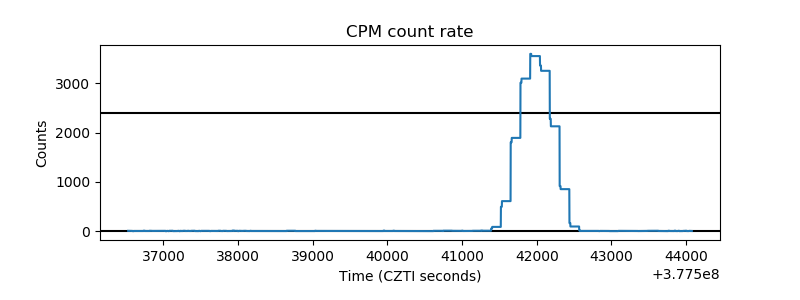 |
| CZT Counter | 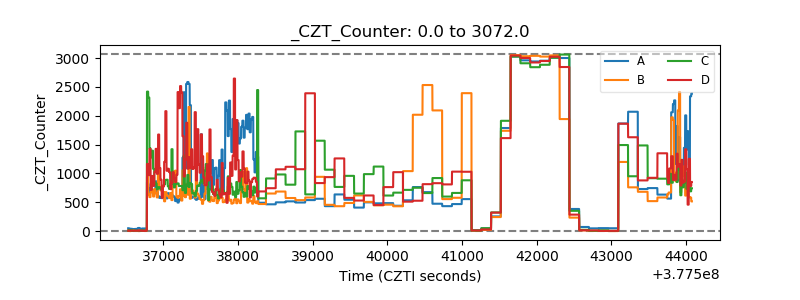 |
| +2.5 Volts monitor | 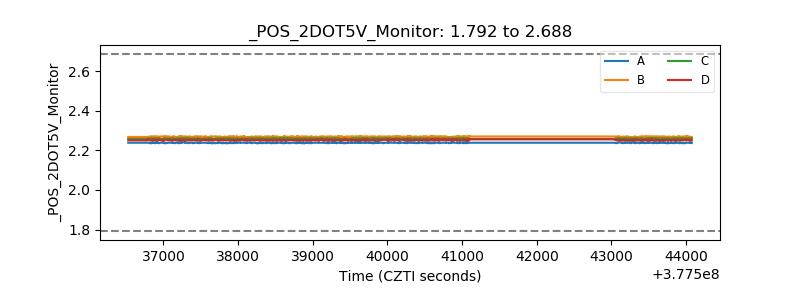 |
| +5 Volts monitor |  |
| _ROLL_ROT | 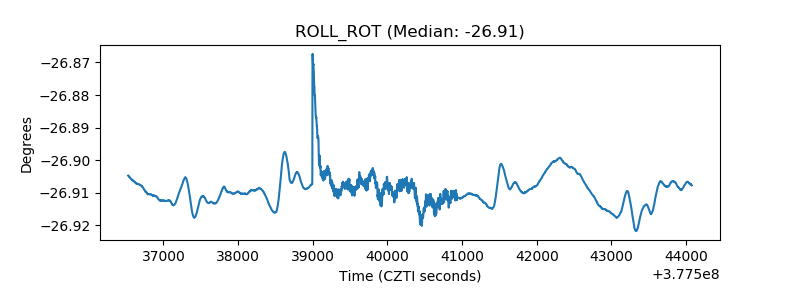 |
| _Roll_DEC | 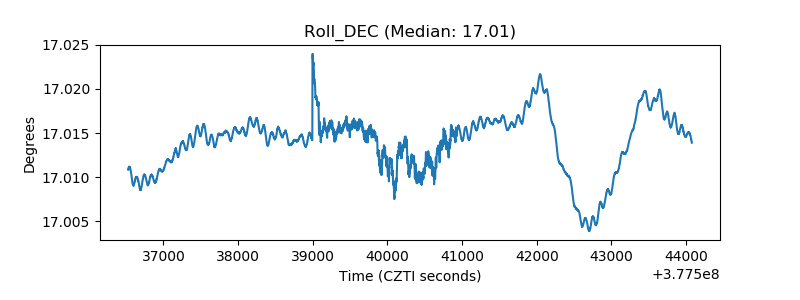 |
| _Roll_RA | 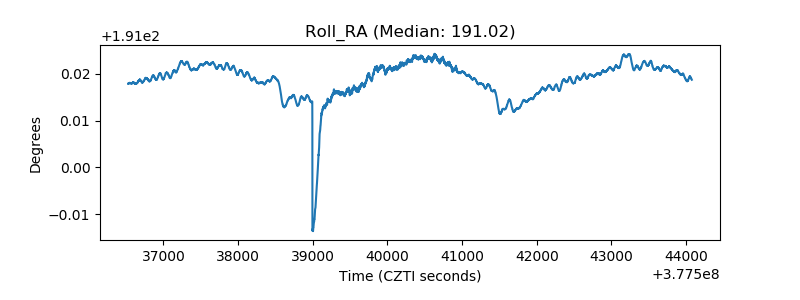 |
| Veto Counter | 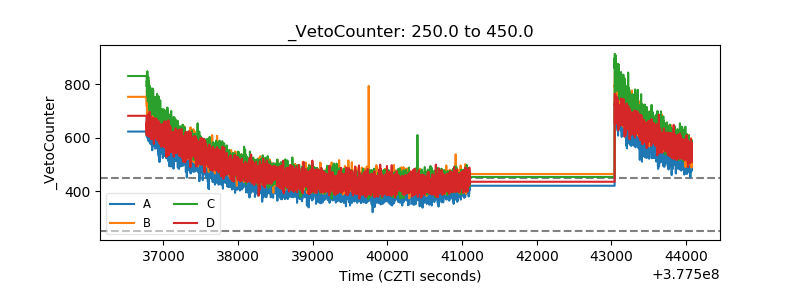 |