| Param | Original file | Final file |
|---|---|---|
| Filename | modeM0/AS1T04_076T01_9000004810_33655cztM0_level2.evt | modeM0/AS1T04_076T01_9000004810_33655cztM0_level2_quad_clean.evt |
| Size (bytes) | 495,887,040 | 79,162,560 |
| Size | 472.9 MB | 75.5 MB |
| Events in quadrant A | 2,799,624 | 517,179 |
| Events in quadrant B | 3,801,032 | 520,744 |
| Events in quadrant C | 4,206,454 | 524,443 |
| Events in quadrant D | 3,881,733 | 493,586 |
| Mode SS | |||
|---|---|---|---|
| Quadrant | BADHDUFLAG | Total packets | Discarded packets |
| A | 0 | 100 | 0 |
| B | 0 | 100 | 0 |
| C | 0 | 100 | 0 |
| D | 0 | 100 | 0 |
| Mode M9 | |||
|---|---|---|---|
| Quadrant | BADHDUFLAG | Total packets | Discarded packets |
| A | 0 | 21 | 0 |
| B | 0 | 21 | 0 |
| C | 0 | 21 | 0 |
| D | 0 | 22 | 0 |
| Mode M0 | |||
|---|---|---|---|
| Quadrant | BADHDUFLAG | Total packets | Discarded packets |
| A | 0 | 11329 | 3 |
| B | 0 | 14546 | 2 |
| C | 0 | 16378 | 2 |
| D | 0 | 14872 | 2 |
| Quadrant | Total seconds | Saturated seconds | Saturation percentage |
|---|---|---|---|
| A | 4859 | 23 | 0.473348% |
| B | 4859 | 405 | 8.335048% |
| C | 4859 | 274 | 5.639020% |
| D | 4859 | 127 | 2.613707% |
Noise dominated data is calculated using 1-second bins in cleaned event files. If a bin has >2000 counts, and if more than 50% of those come from <1% of pixels, then it is considered to be noise-dominated and hence unusable.
| Quadrant | # 1 sec bins | Bins with >0 counts | Bins with >2000 counts | High rate bins dominated by noise | Noise dominated (total time) | Noise dominated (detector-on time) | Marked lightcurve |
|---|---|---|---|---|---|---|---|
| A | 6981 | 4860 | 13 | 13 | 0.19% | 0.27% | 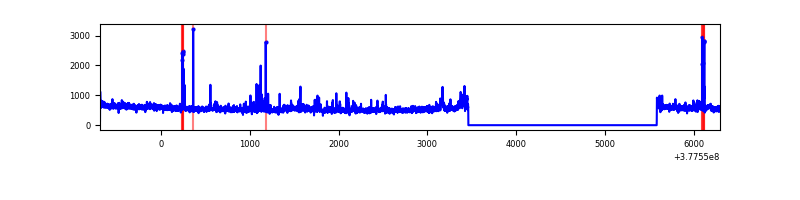 |
| B | 6981 | 4859 | 313 | 313 | 4.48% | 6.44% | 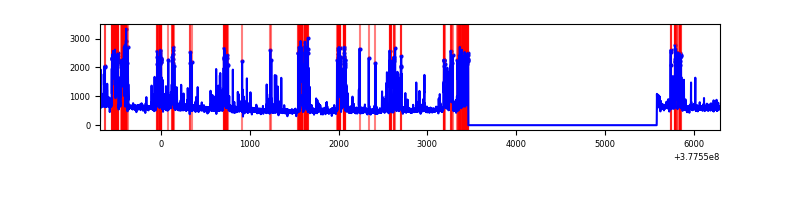 |
| C | 6981 | 4860 | 210 | 210 | 3.01% | 4.32% | 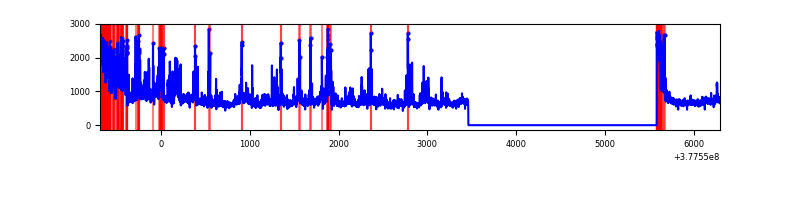 |
| D | 6981 | 4860 | 128 | 128 | 1.83% | 2.63% | 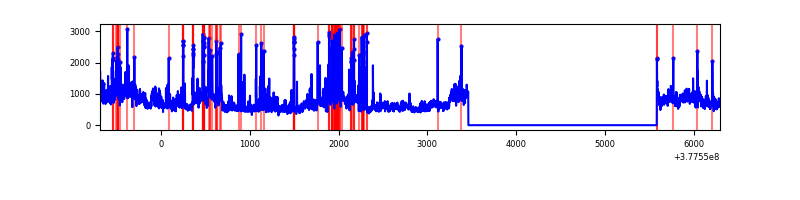 |
Top three noisy pixels from each quadrant. If the there are fewer than three noisy pixels in the level2.evt file, extra rows are filled as -1
| Pixel properties | Quadrant properties | ||||||
|---|---|---|---|---|---|---|---|
| Quadrant | DetID | PixID | Counts | Sigma | Mean | Median | Sigma |
| A | 15 | 169 | 204434 | 1566.33 | 648 | 639 | 130.1 |
| A | 15 | 237 | 69646 | 530.37 | 648 | 639 | 130.1 |
| A | 13 | 6 | 10070 | 72.48 | 648 | 639 | 130.1 |
| B | 5 | 172 | 1042052 | 8781.04 | 634 | 621 | 118.6 |
| B | 0 | 229 | 110842 | 929.35 | 634 | 621 | 118.6 |
| B | 5 | 200 | 33223 | 274.89 | 634 | 621 | 118.6 |
| C | 3 | 233 | 1220644 | 8513.34 | 628 | 637 | 143.3 |
| C | 0 | 10 | 256239 | 1783.62 | 628 | 637 | 143.3 |
| C | 15 | 214 | 220262 | 1532.57 | 628 | 637 | 143.3 |
| D | 8 | 195 | 743501 | 4721.19 | 629 | 616 | 157.4 |
| D | 13 | 249 | 301550 | 1912.5 | 629 | 616 | 157.4 |
| D | 7 | 223 | 98825 | 624.14 | 629 | 616 | 157.4 |
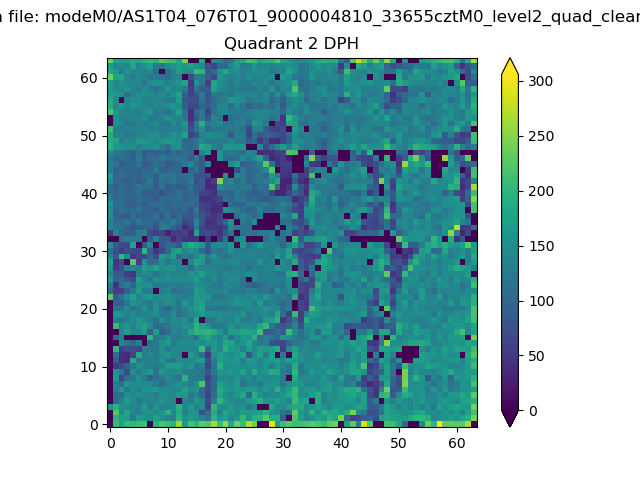
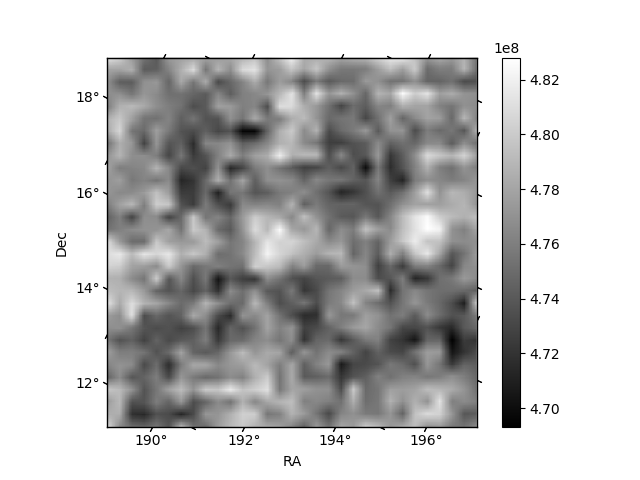
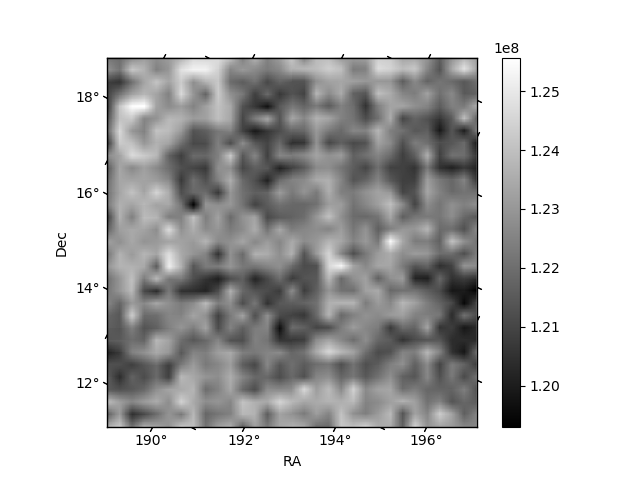
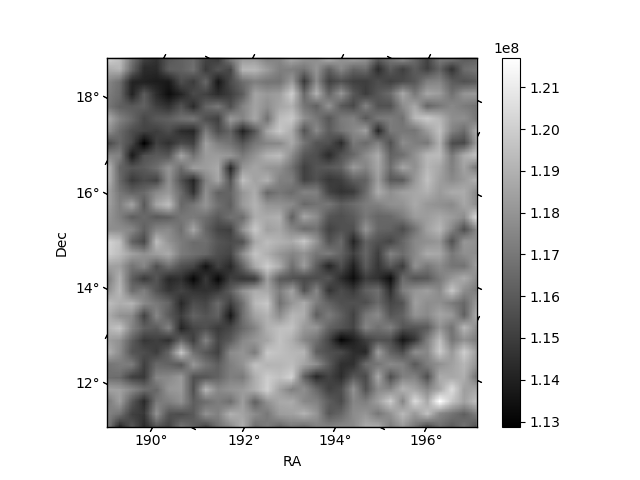
Histogram calculated using DETX and DETY for each event in the final _common_clean file
| Quadrant A | 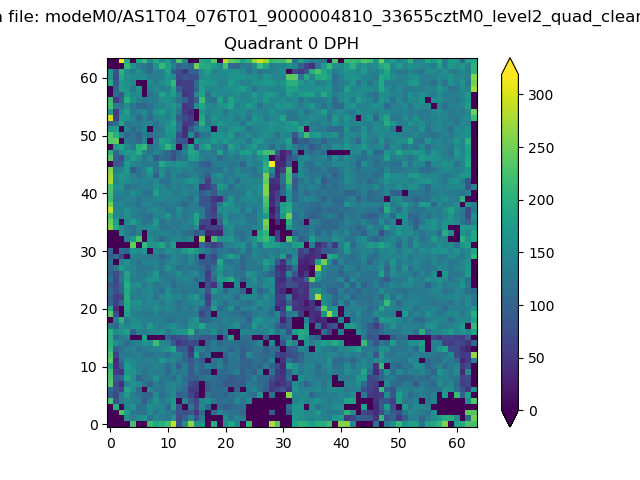 |
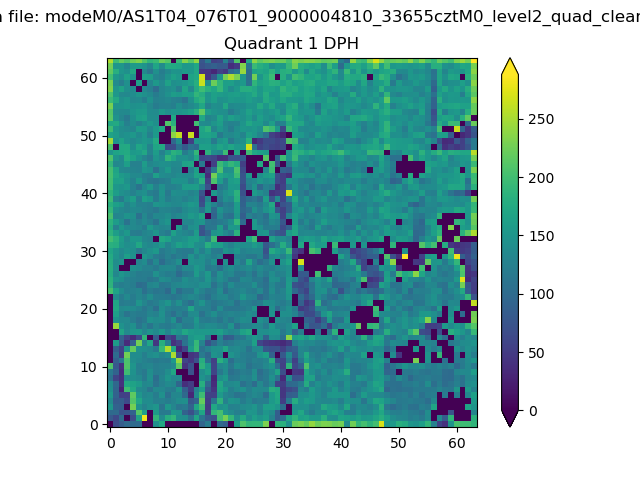 |
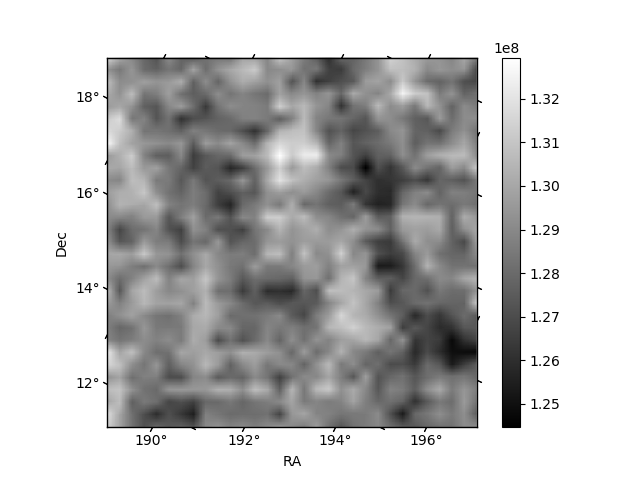
Quadrant B |
|---|---|---|---|
| Quadrant D | 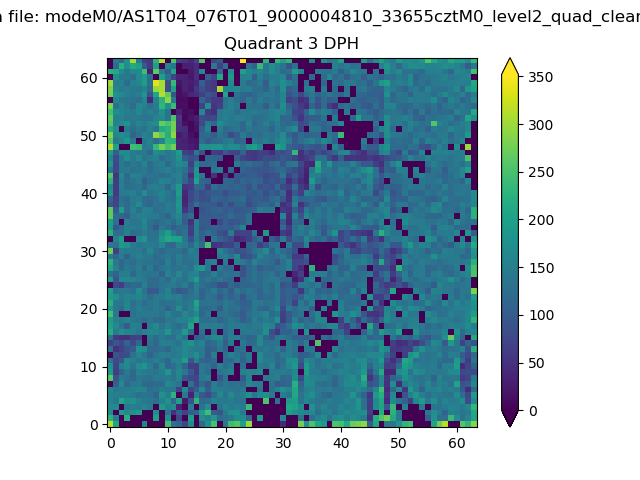 |
 |
Quadrant C |
| Plot type | Count rate plots | Images |
|---|---|---|
| Comparison with Poisson distribution Blue bars denote a histogram of data divided into 1 sec bins. Red curve is a Poisson curve with rate = median count rate of data. |
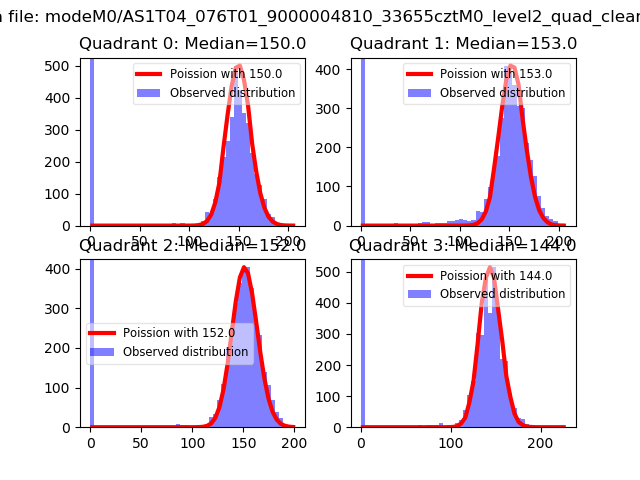 |
 |
| Quadrant-wise count rates Data is divided into 100 sec bins |
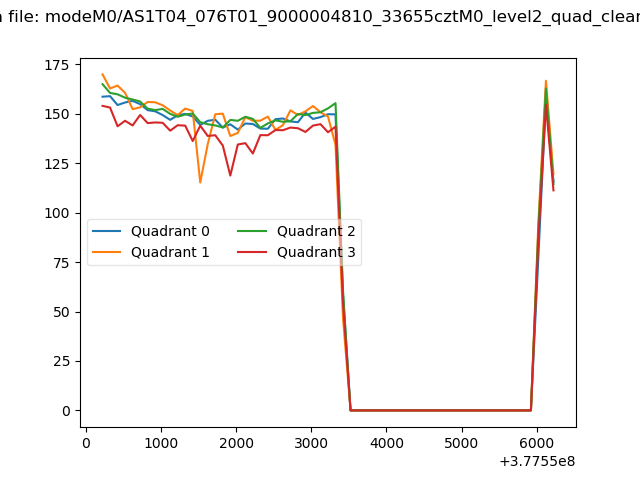 |
|
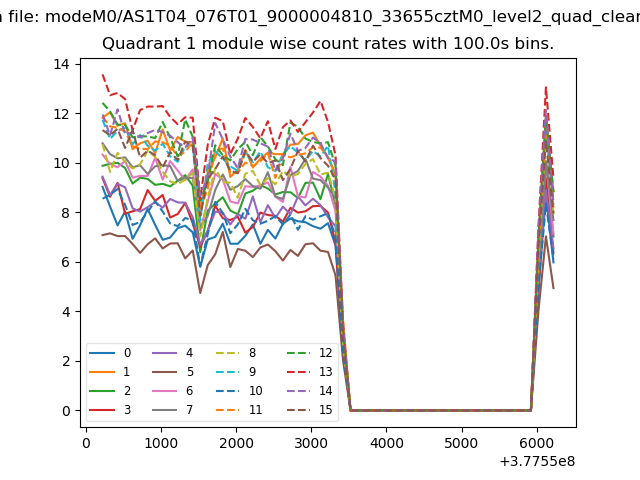
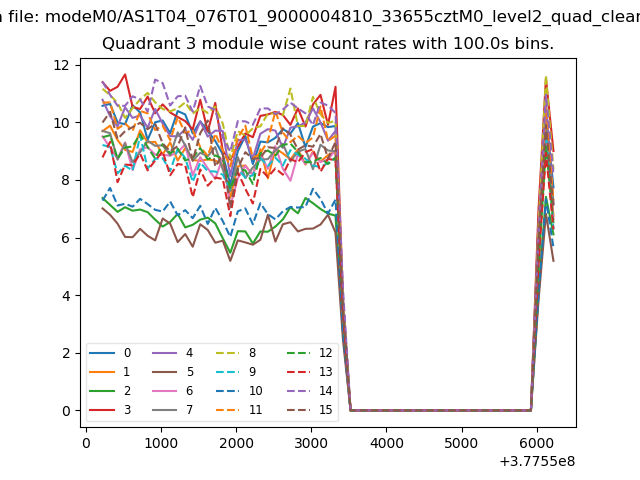
| Module-wise count rates for Quadrant A Data is divided into 100 sec bins |
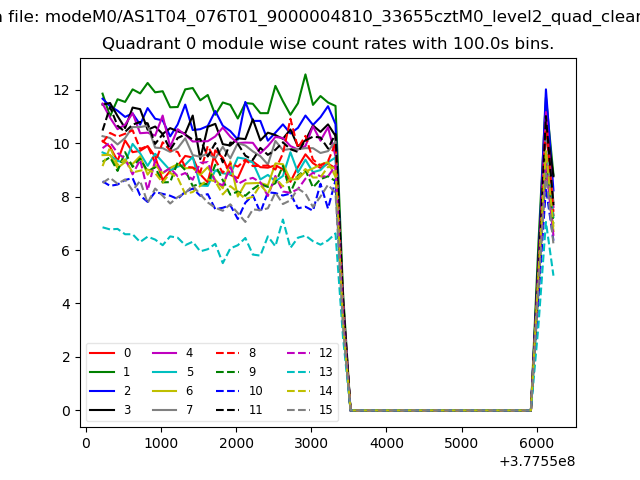 |
 |
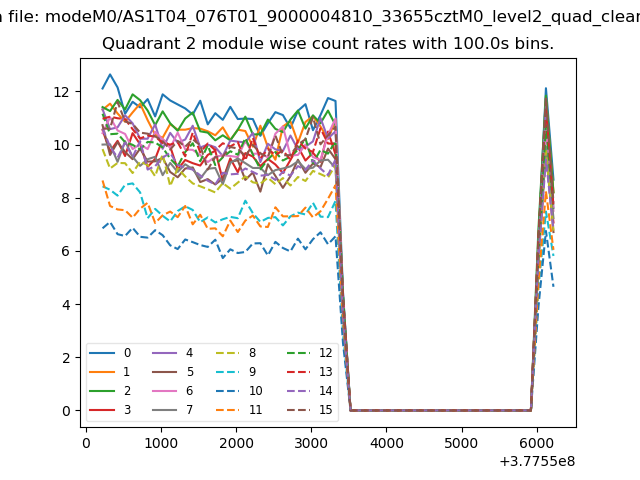
| Module-wise count rates for Quadrant B Data is divided into 100 sec bins |
 |
 |
| Module-wise count rates for Quadrant C Data is divided into 100 sec bins |
 |
 |
| Module-wise count rates for Quadrant D Data is divided into 100 sec bins |
 |
 |
| Parameter | Plot |
|---|---|
| CZT HV Monitor | 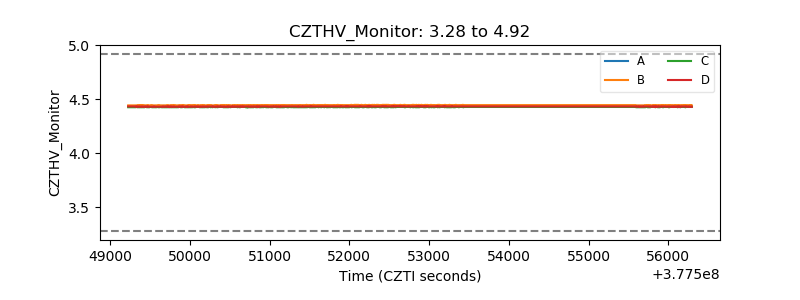 |
| D_VDD | 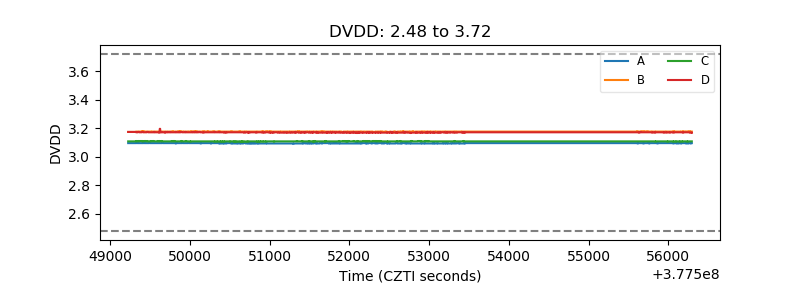 |
| Temperature 1 | 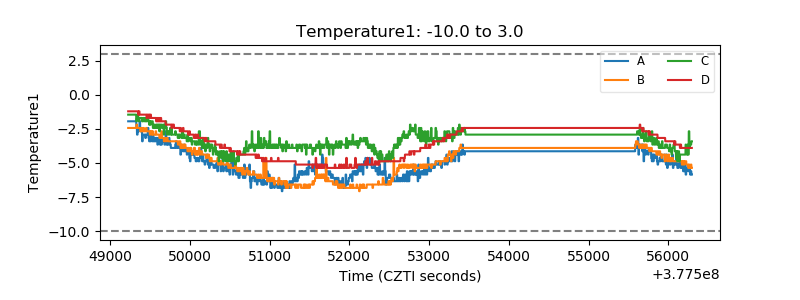 |
| Veto HV Monitor | 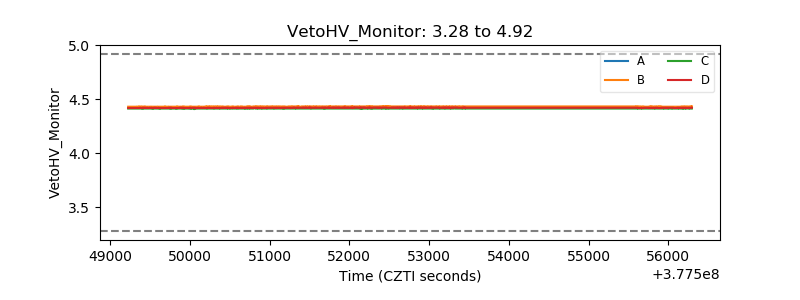 |
| Veto LLD | 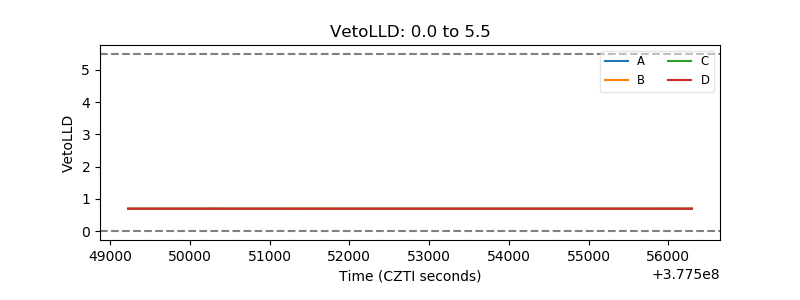 |
| Alpha Counter | 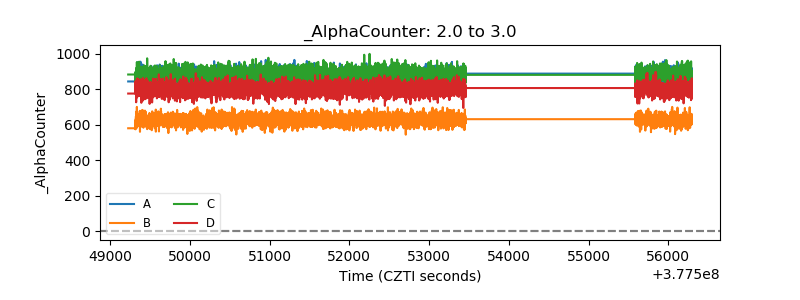 |
| _CPM_Rate | 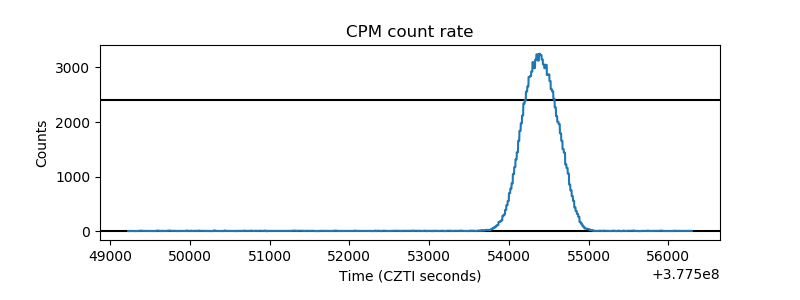 |
| CZT Counter | 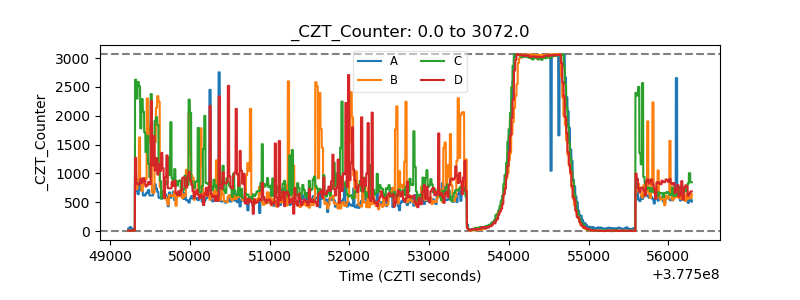 |
| +2.5 Volts monitor |  |
| +5 Volts monitor |  |
| _ROLL_ROT | 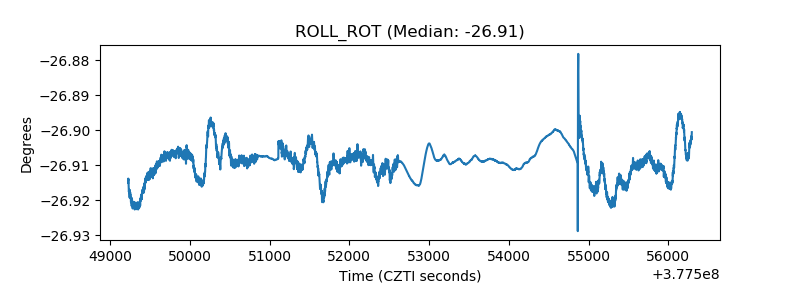 |
| _Roll_DEC | 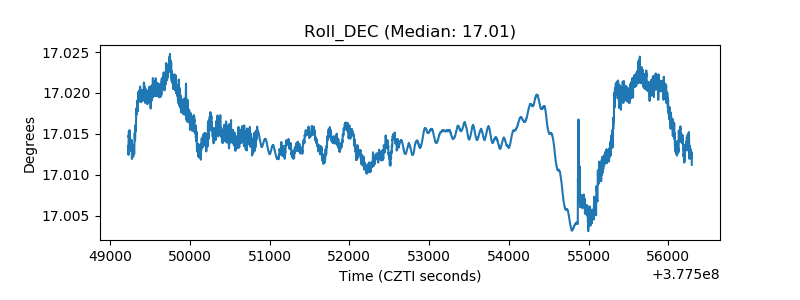 |
| _Roll_RA | 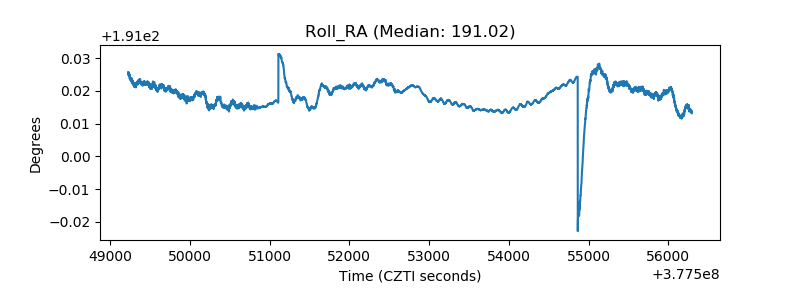 |
| Veto Counter | 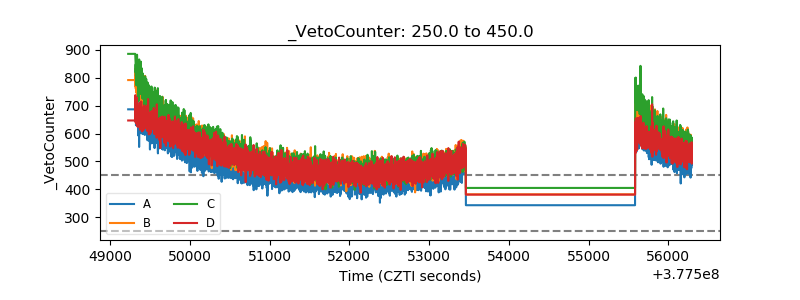 |