| Param | Original file | Final file |
|---|---|---|
| Filename | modeM0/AS1T04_076T01_9000004810_33657cztM0_level2.evt | modeM0/AS1T04_076T01_9000004810_33657cztM0_level2_quad_clean.evt |
| Size (bytes) | 489,625,920 | 88,467,840 |
| Size | 466.9 MB | 84.4 MB |
| Events in quadrant A | 3,340,845 | 583,134 |
| Events in quadrant B | 3,781,386 | 588,873 |
| Events in quadrant C | 3,163,880 | 600,944 |
| Events in quadrant D | 4,205,567 | 557,448 |
| Mode SS | |||
|---|---|---|---|
| Quadrant | BADHDUFLAG | Total packets | Discarded packets |
| A | 0 | 100 | 0 |
| B | 0 | 100 | 0 |
| C | 0 | 100 | 0 |
| D | 0 | 100 | 0 |
| Mode M9 | |||
|---|---|---|---|
| Quadrant | BADHDUFLAG | Total packets | Discarded packets |
| A | 0 | 29 | 0 |
| B | 0 | 29 | 0 |
| C | 0 | 29 | 0 |
| D | 0 | 30 | 0 |
| Mode M0 | |||
|---|---|---|---|
| Quadrant | BADHDUFLAG | Total packets | Discarded packets |
| A | 0 | 13263 | 2 |
| B | 0 | 14528 | 1 |
| C | 0 | 12554 | 1 |
| D | 0 | 16202 | 1 |
| Quadrant | Total seconds | Saturated seconds | Saturation percentage |
|---|---|---|---|
| A | 4975 | 194 | 3.899497% |
| B | 4975 | 386 | 7.758794% |
| C | 4975 | 93 | 1.869347% |
| D | 4975 | 191 | 3.839196% |
Noise dominated data is calculated using 1-second bins in cleaned event files. If a bin has >2000 counts, and if more than 50% of those come from <1% of pixels, then it is considered to be noise-dominated and hence unusable.
| Quadrant | # 1 sec bins | Bins with >0 counts | Bins with >2000 counts | High rate bins dominated by noise | Noise dominated (total time) | Noise dominated (detector-on time) | Marked lightcurve |
|---|---|---|---|---|---|---|---|
| A | 7038 | 4976 | 187 | 187 | 2.66% | 3.76% | 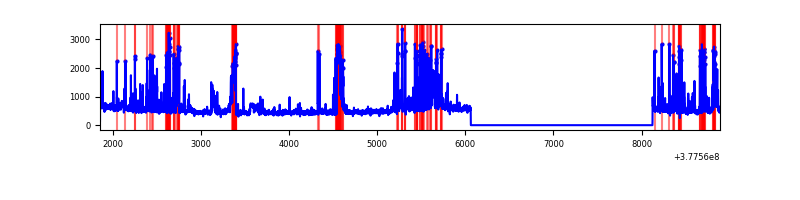 |
| B | 7038 | 4976 | 344 | 344 | 4.89% | 6.91% | 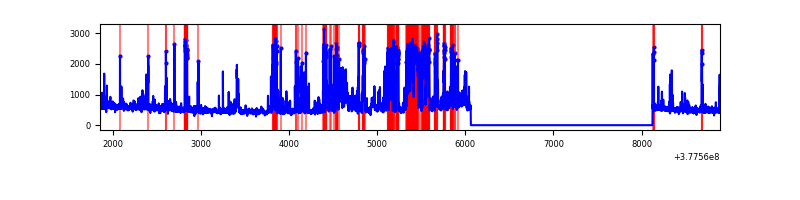 |
| C | 7038 | 4976 | 68 | 68 | 0.97% | 1.37% | 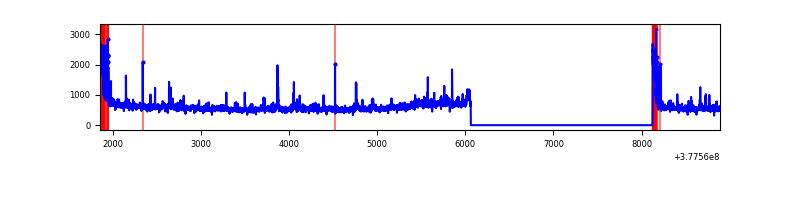 |
| D | 7038 | 4976 | 173 | 173 | 2.46% | 3.48% | 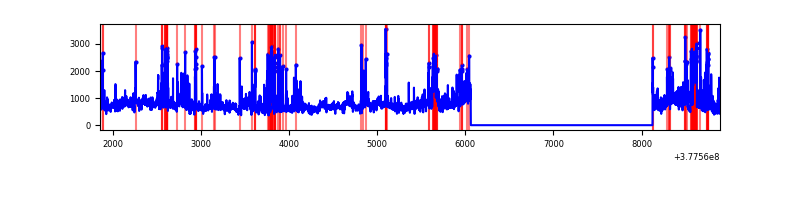 |
Top three noisy pixels from each quadrant. If the there are fewer than three noisy pixels in the level2.evt file, extra rows are filled as -1
| Pixel properties | Quadrant properties | ||||||
|---|---|---|---|---|---|---|---|
| Quadrant | DetID | PixID | Counts | Sigma | Mean | Median | Sigma |
| A | 15 | 237 | 851763 | 7071.78 | 594 | 584 | 120.4 |
| A | 15 | 169 | 158165 | 1309.22 | 594 | 584 | 120.4 |
| A | 13 | 6 | 21330 | 172.36 | 594 | 584 | 120.4 |
| B | 5 | 172 | 1264343 | 11245.0 | 586 | 570 | 112.4 |
| B | 0 | 189 | 57468 | 506.28 | 586 | 570 | 112.4 |
| B | 5 | 200 | 56855 | 500.82 | 586 | 570 | 112.4 |
| C | 3 | 233 | 313159 | 2291.59 | 590 | 597 | 136.4 |
| C | 0 | 10 | 235405 | 1721.52 | 590 | 597 | 136.4 |
| C | 15 | 214 | 230369 | 1684.6 | 590 | 597 | 136.4 |
| D | 8 | 195 | 968594 | 6257.05 | 573 | 563 | 154.7 |
| D | 12 | 6 | 253636 | 1635.79 | 573 | 563 | 154.7 |
| D | 10 | 118 | 232333 | 1498.09 | 573 | 563 | 154.7 |
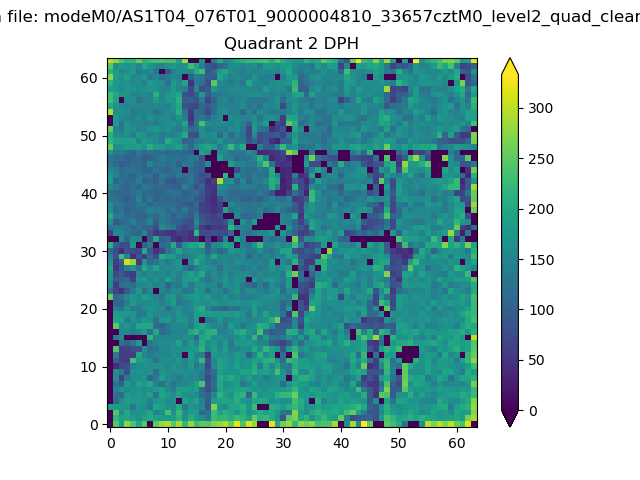
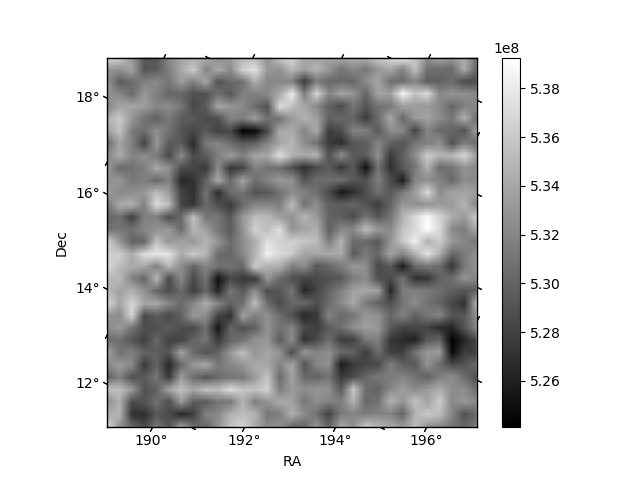
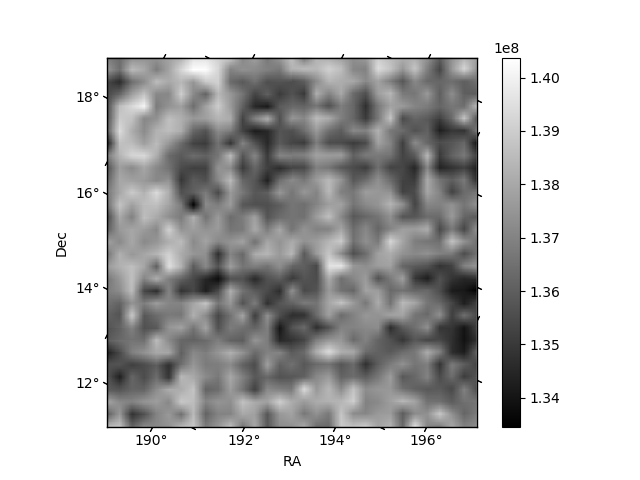
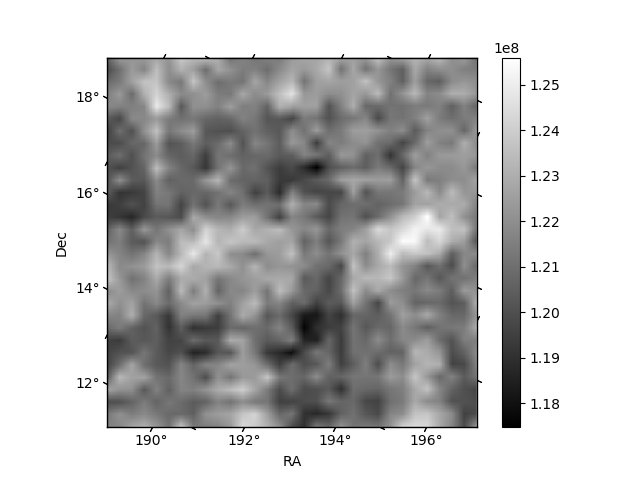
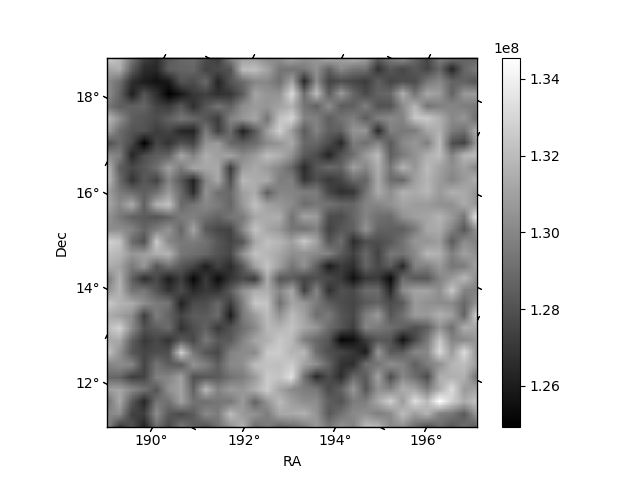
Histogram calculated using DETX and DETY for each event in the final _common_clean file
| Quadrant A | 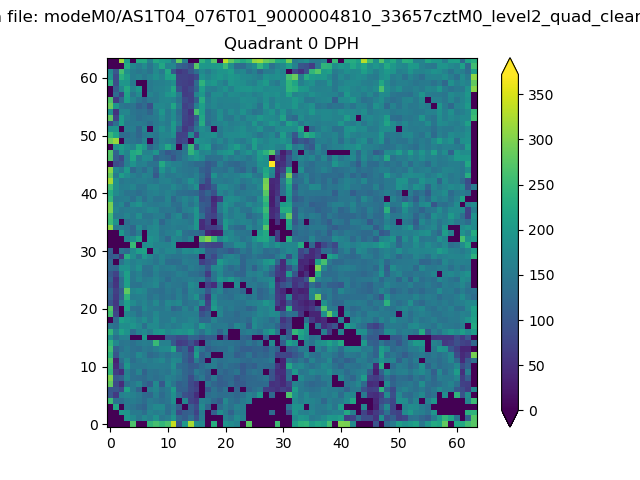 |
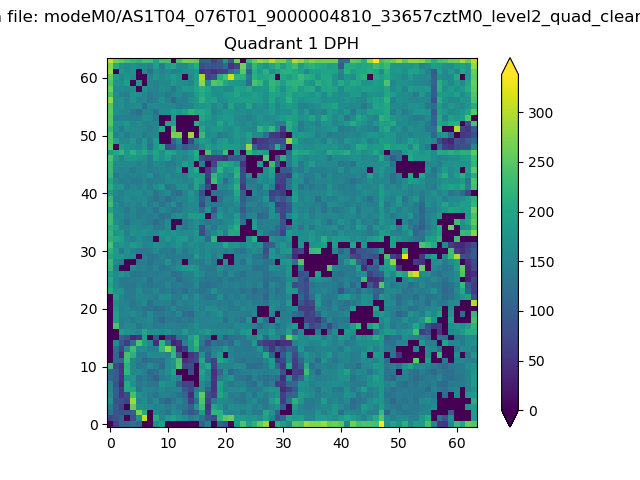 |
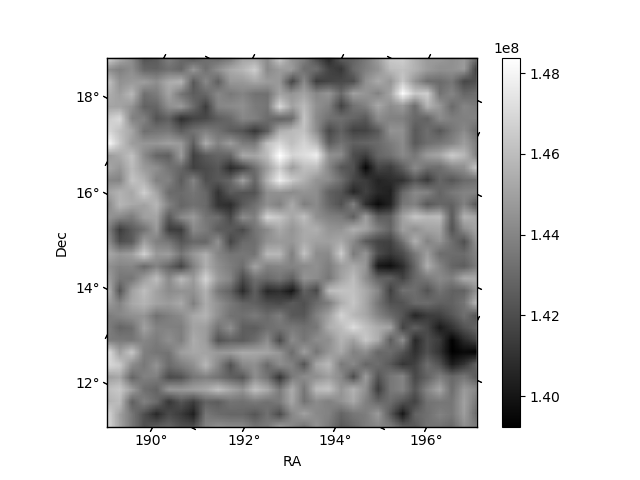
Quadrant B |
|---|---|---|---|
| Quadrant D | 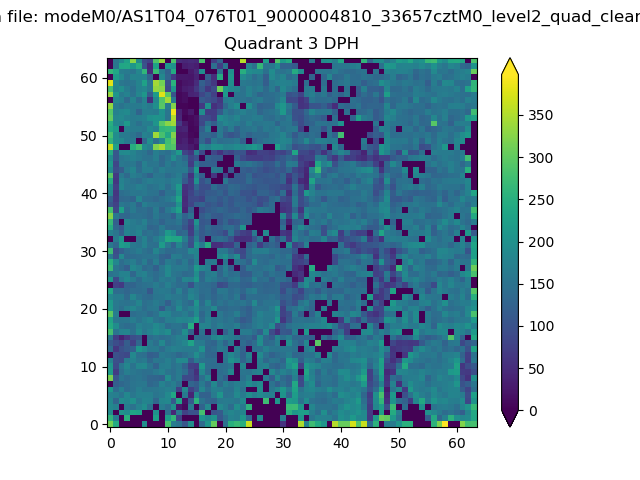 |
 |
Quadrant C |
| Plot type | Count rate plots | Images |
|---|---|---|
| Comparison with Poisson distribution Blue bars denote a histogram of data divided into 1 sec bins. Red curve is a Poisson curve with rate = median count rate of data. |
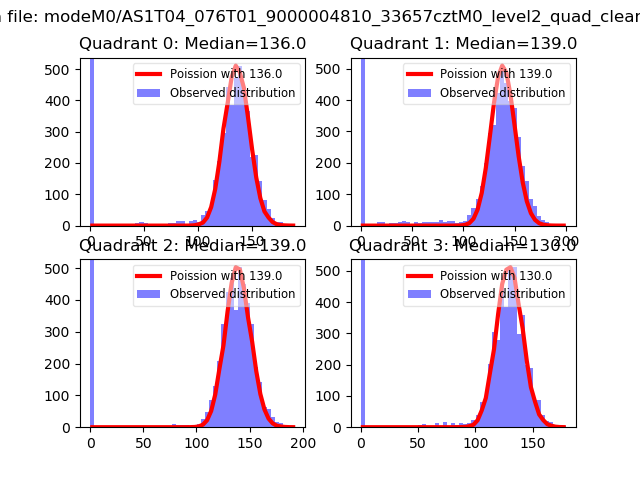 |
 |
| Quadrant-wise count rates Data is divided into 100 sec bins |
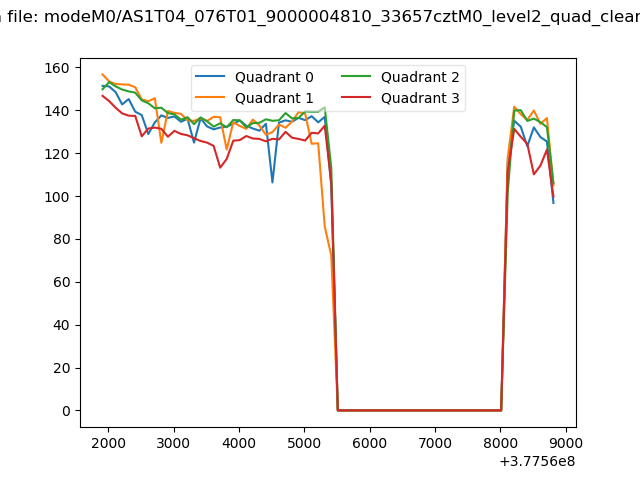 |
|
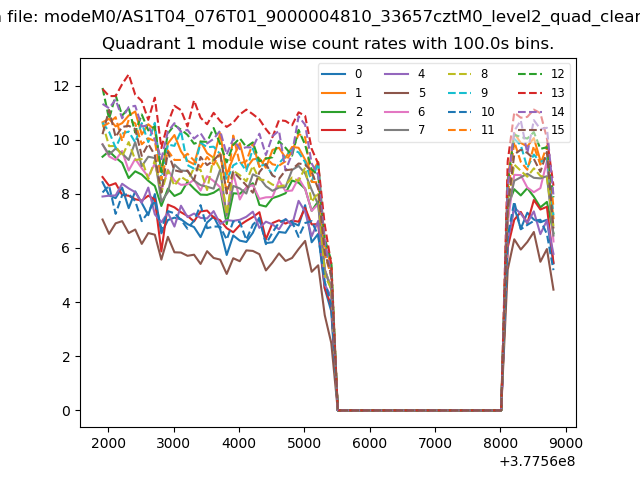
| Module-wise count rates for Quadrant A Data is divided into 100 sec bins |
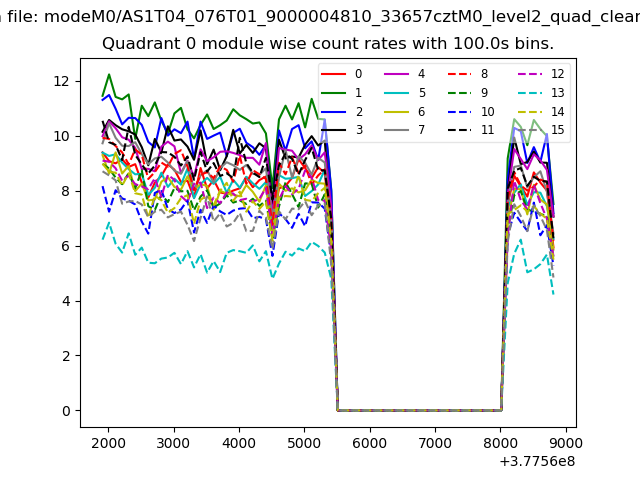 |
 |
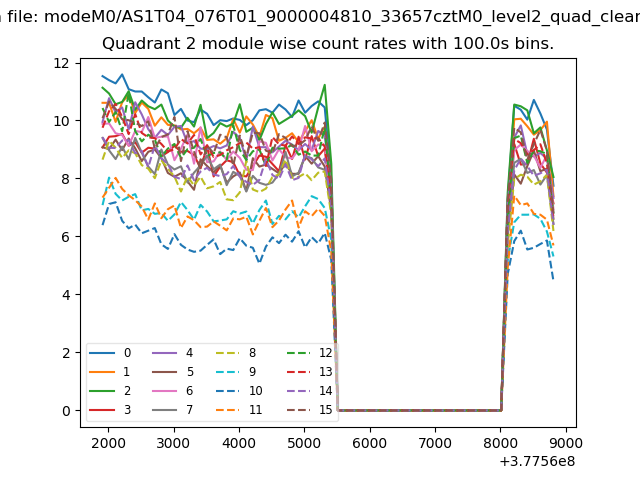
| Module-wise count rates for Quadrant B Data is divided into 100 sec bins |
 |
 |
| Module-wise count rates for Quadrant C Data is divided into 100 sec bins |
 |
 |
| Module-wise count rates for Quadrant D Data is divided into 100 sec bins |
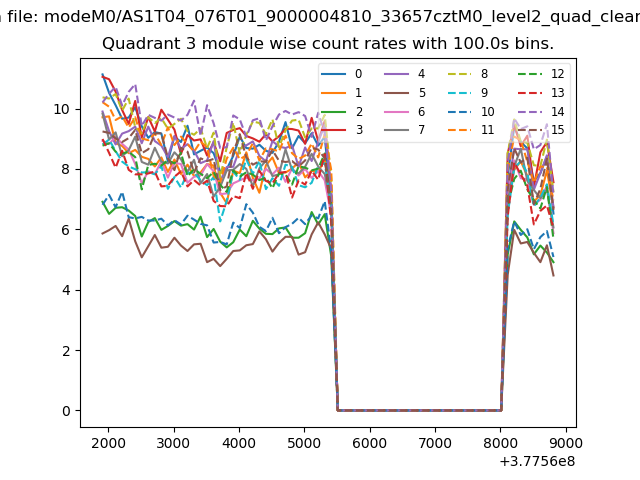 |
 |
| Parameter | Plot |
|---|---|
| CZT HV Monitor | 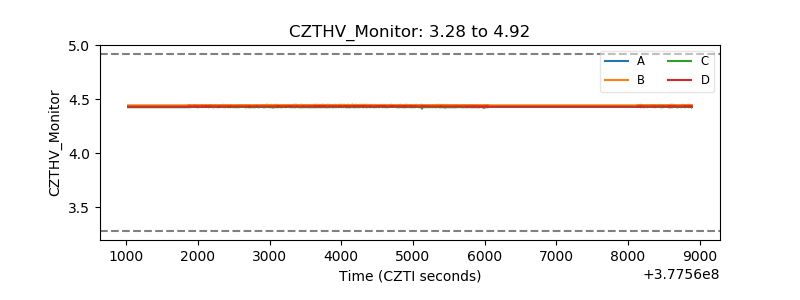 |
| D_VDD | 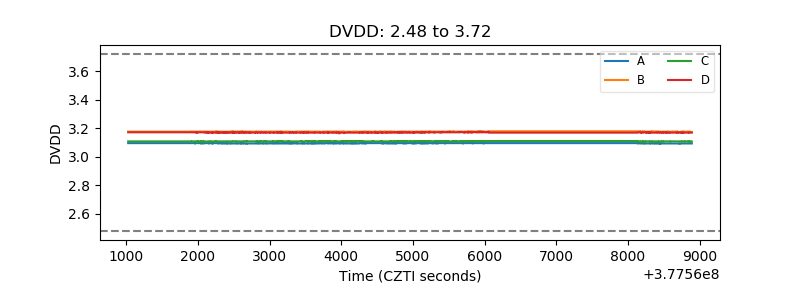 |
| Temperature 1 | 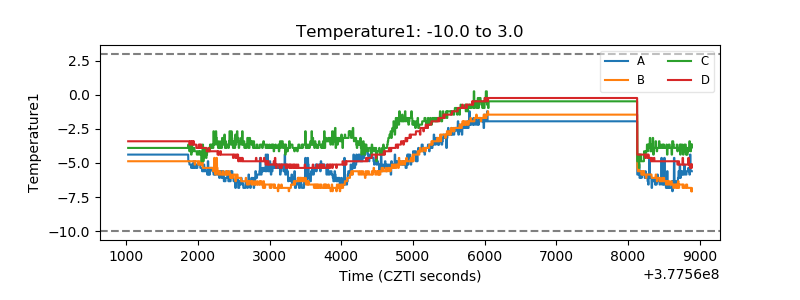 |
| Veto HV Monitor | 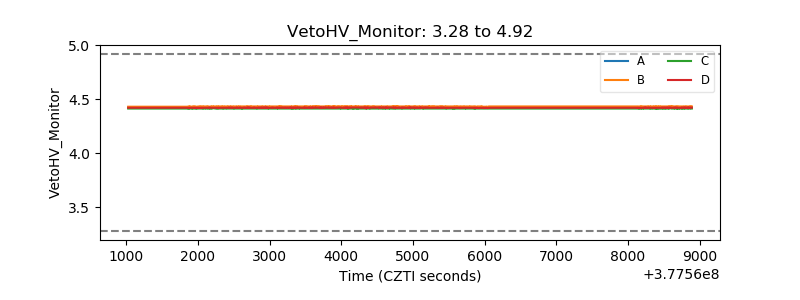 |
| Veto LLD | 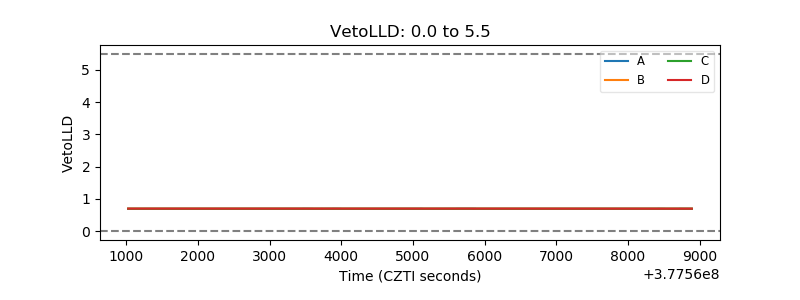 |
| Alpha Counter | 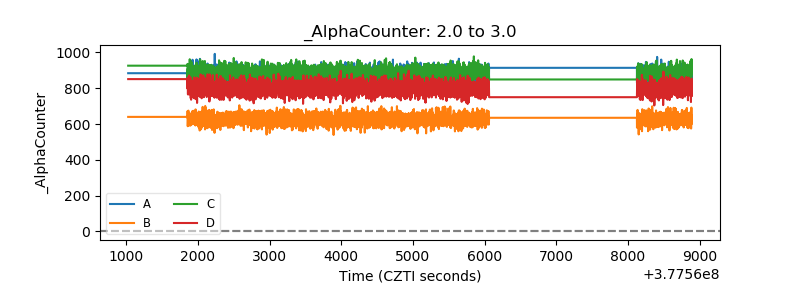 |
| _CPM_Rate | 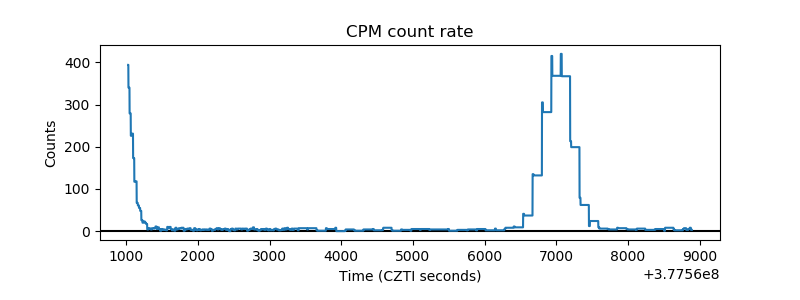 |
| CZT Counter | 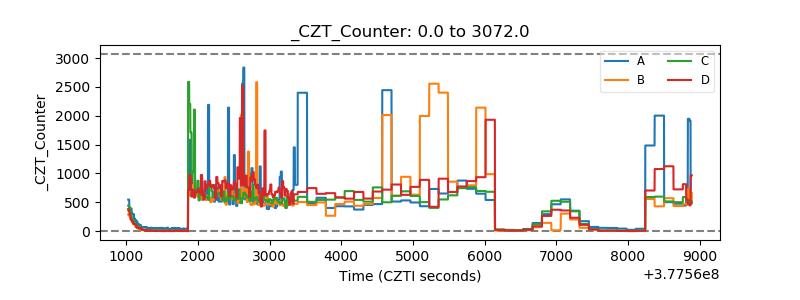 |
| +2.5 Volts monitor | 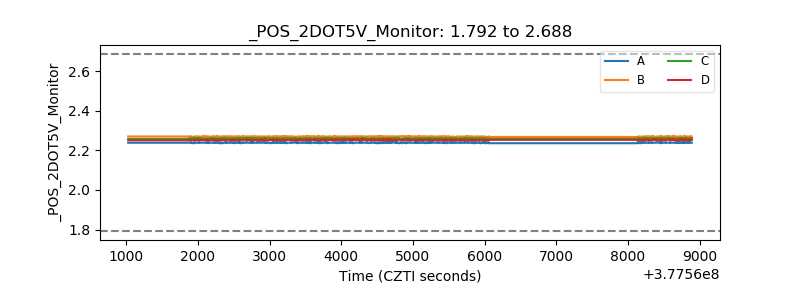 |
| +5 Volts monitor | 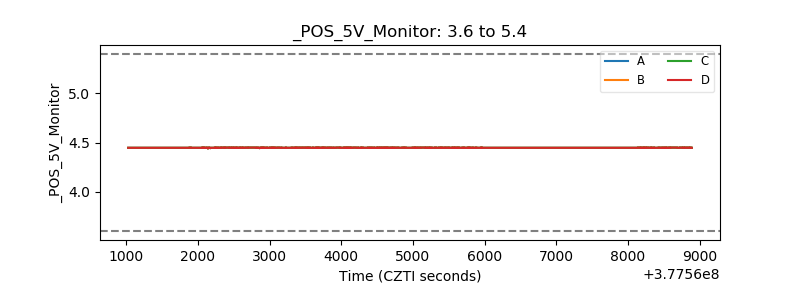 |
| _ROLL_ROT | 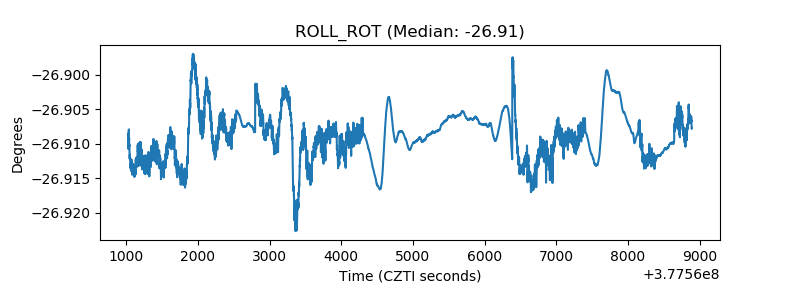 |
| _Roll_DEC | 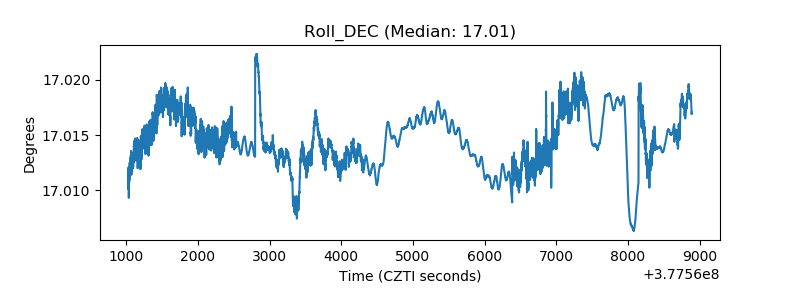 |
| _Roll_RA | 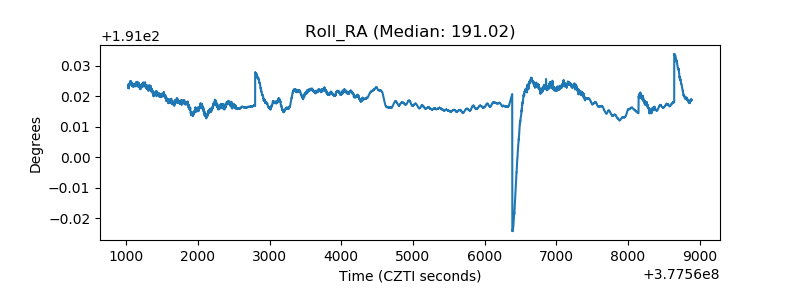 |
| Veto Counter | 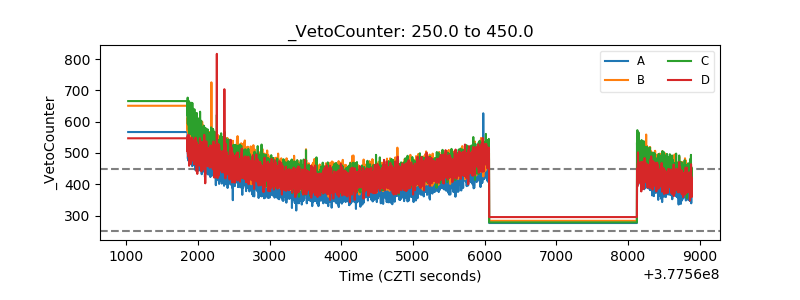 |