| Param | Original file | Final file |
|---|---|---|
| Filename | modeM0/AS1T04_076T01_9000004810_33658cztM0_level2.evt | modeM0/AS1T04_076T01_9000004810_33658cztM0_level2_quad_clean.evt |
| Size (bytes) | 479,301,120 | 77,860,800 |
| Size | 457.1 MB | 74.3 MB |
| Events in quadrant A | 3,037,379 | 501,664 |
| Events in quadrant B | 3,880,597 | 500,163 |
| Events in quadrant C | 3,097,184 | 510,026 |
| Events in quadrant D | 4,146,254 | 479,655 |
| Mode SS | |||
|---|---|---|---|
| Quadrant | BADHDUFLAG | Total packets | Discarded packets |
| A | 0 | 106 | 0 |
| B | 0 | 106 | 0 |
| C | 0 | 106 | 0 |
| D | 0 | 106 | 0 |
| Mode M9 | |||
|---|---|---|---|
| Quadrant | BADHDUFLAG | Total packets | Discarded packets |
| A | 0 | 25 | 0 |
| B | 0 | 25 | 0 |
| C | 0 | 25 | 0 |
| D | 0 | 26 | 0 |
| Mode M0 | |||
|---|---|---|---|
| Quadrant | BADHDUFLAG | Total packets | Discarded packets |
| A | 0 | 12433 | 2 |
| B | 0 | 14944 | 1 |
| C | 0 | 12389 | 1 |
| D | 0 | 15994 | 1 |
| Quadrant | Total seconds | Saturated seconds | Saturation percentage |
|---|---|---|---|
| A | 5226 | 118 | 2.257941% |
| B | 5226 | 409 | 7.826253% |
| C | 5226 | 85 | 1.626483% |
| D | 5226 | 285 | 5.453502% |
Noise dominated data is calculated using 1-second bins in cleaned event files. If a bin has >2000 counts, and if more than 50% of those come from <1% of pixels, then it is considered to be noise-dominated and hence unusable.
| Quadrant | # 1 sec bins | Bins with >0 counts | Bins with >2000 counts | High rate bins dominated by noise | Noise dominated (total time) | Noise dominated (detector-on time) | Marked lightcurve |
|---|---|---|---|---|---|---|---|
| A | 7019 | 5227 | 104 | 104 | 1.48% | 1.99% | 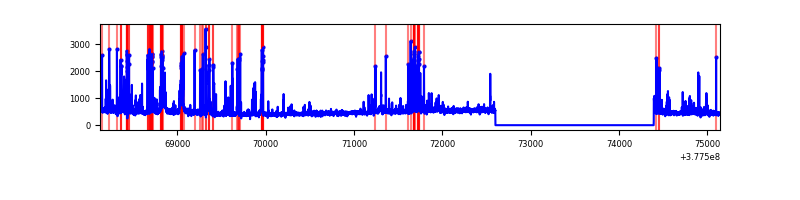 |
| B | 7018 | 5226 | 332 | 332 | 4.73% | 6.35% | 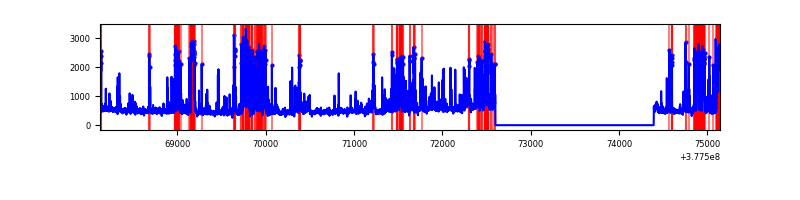 |
| C | 7019 | 5227 | 66 | 66 | 0.94% | 1.26% | 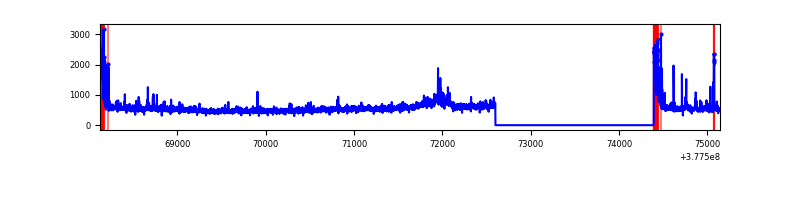 |
| D | 7019 | 5227 | 251 | 251 | 3.58% | 4.80% | 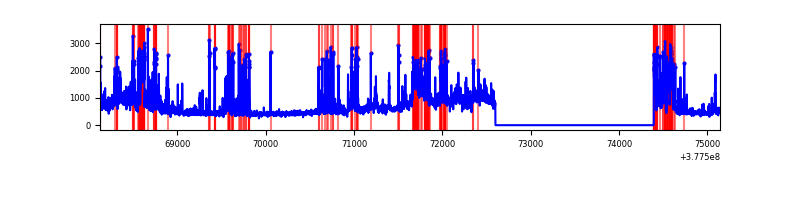 |
Top three noisy pixels from each quadrant. If the there are fewer than three noisy pixels in the level2.evt file, extra rows are filled as -1
| Pixel properties | Quadrant properties | ||||||
|---|---|---|---|---|---|---|---|
| Quadrant | DetID | PixID | Counts | Sigma | Mean | Median | Sigma |
| A | 15 | 237 | 629912 | 5093.26 | 610 | 597 | 123.6 |
| A | 15 | 169 | 21951 | 172.83 | 610 | 597 | 123.6 |
| A | 9 | 143 | 15589 | 121.34 | 610 | 597 | 123.6 |
| B | 5 | 172 | 1352905 | 11711.3 | 600 | 583 | 115.5 |
| B | 15 | 222 | 33331 | 283.6 | 600 | 583 | 115.5 |
| B | 5 | 200 | 27654 | 234.44 | 600 | 583 | 115.5 |
| C | 3 | 233 | 249711 | 1802.56 | 599 | 605 | 138.2 |
| C | 15 | 214 | 243813 | 1759.88 | 599 | 605 | 138.2 |
| C | 0 | 10 | 211378 | 1525.18 | 599 | 605 | 138.2 |
| D | 8 | 195 | 557962 | 3597.21 | 583 | 571 | 155.0 |
| D | 12 | 6 | 420834 | 2712.23 | 583 | 571 | 155.0 |
| D | 10 | 118 | 318704 | 2053.12 | 583 | 571 | 155.0 |
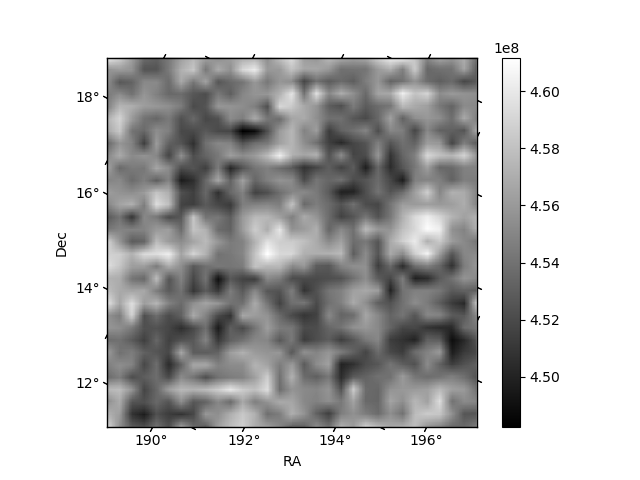
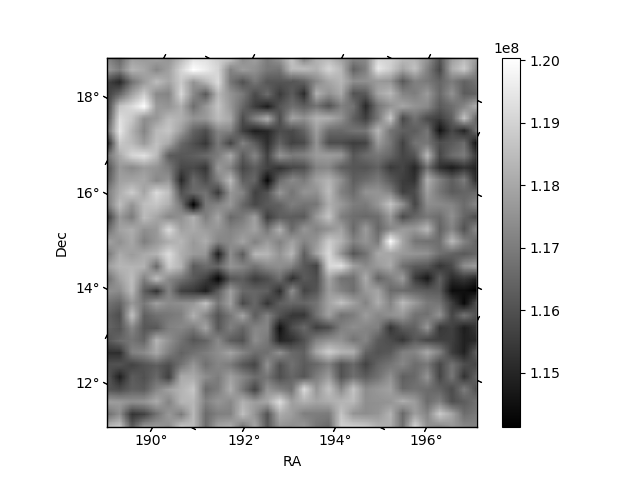
Histogram calculated using DETX and DETY for each event in the final _common_clean file
| Quadrant A | 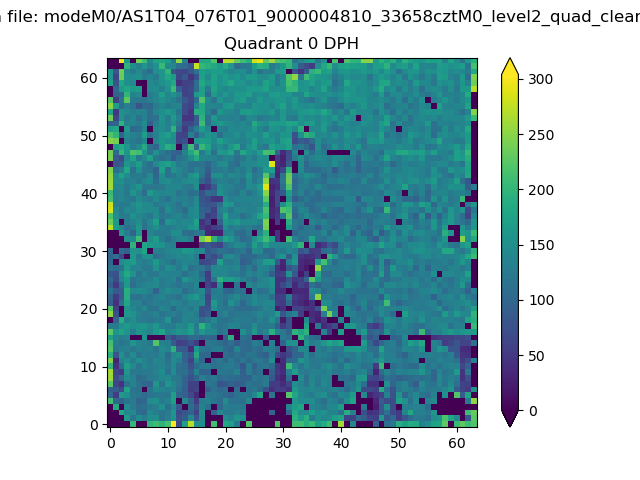 |
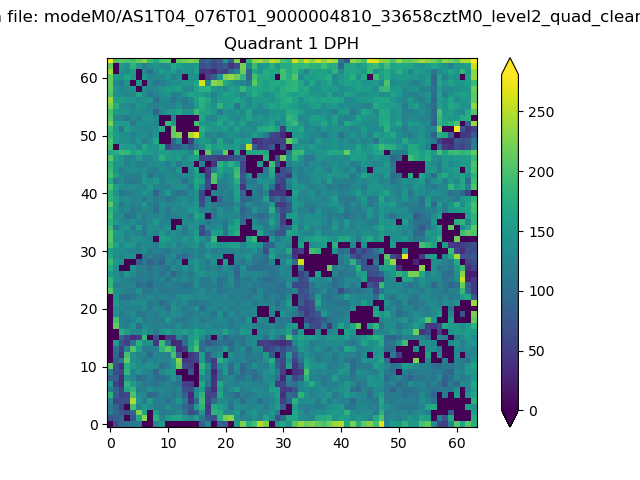 |
Quadrant B |
|---|---|---|---|
| Quadrant D |  |
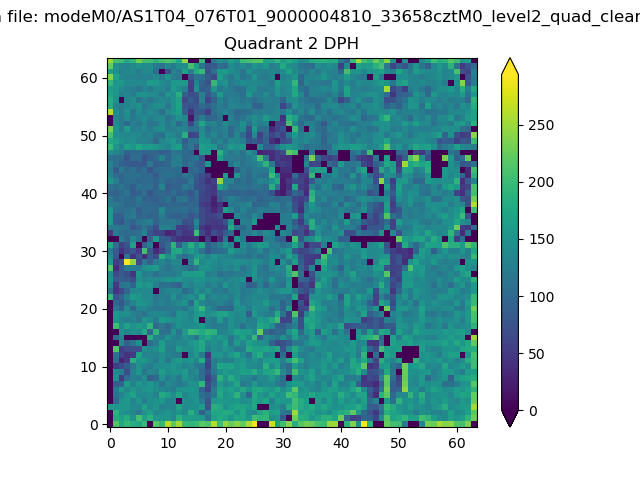 |
Quadrant C |
| Plot type | Count rate plots | Images |
|---|---|---|
| Comparison with Poisson distribution Blue bars denote a histogram of data divided into 1 sec bins. Red curve is a Poisson curve with rate = median count rate of data. |
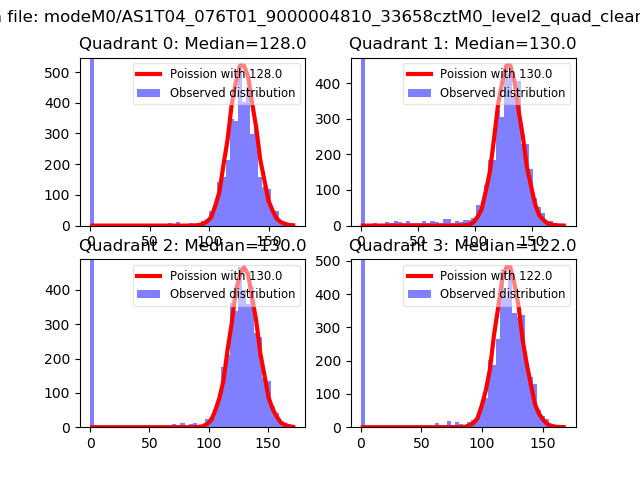 |
 |
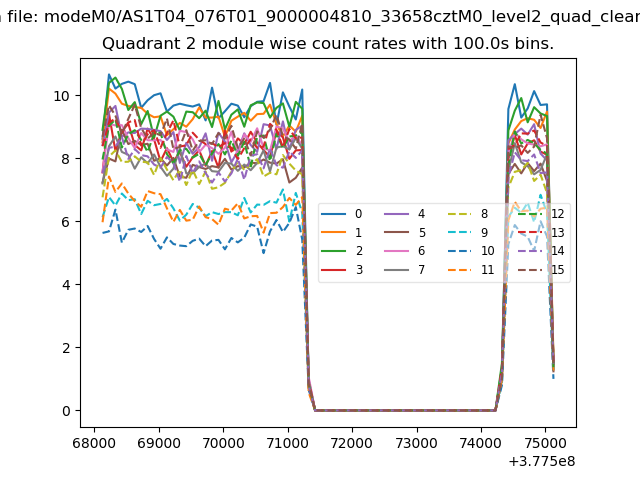
| Quadrant-wise count rates Data is divided into 100 sec bins |
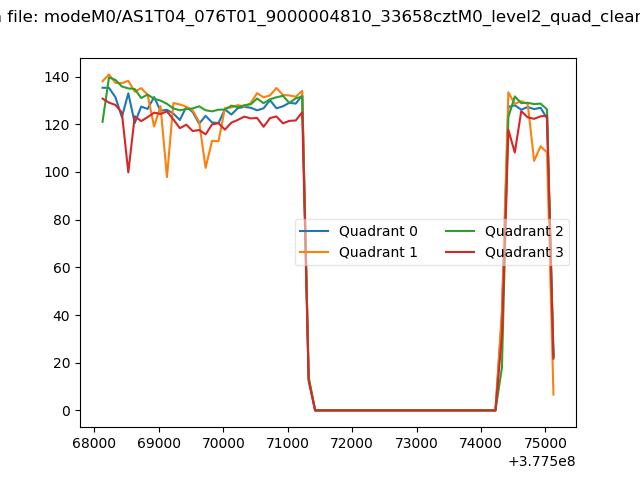 |
|
| Module-wise count rates for Quadrant A Data is divided into 100 sec bins |
 |
 |
| Module-wise count rates for Quadrant B Data is divided into 100 sec bins |
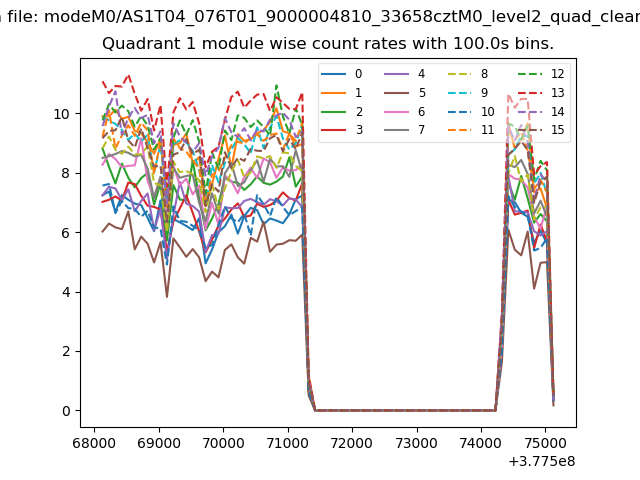 |
 |
| Module-wise count rates for Quadrant C Data is divided into 100 sec bins |
 |
 |
| Module-wise count rates for Quadrant D Data is divided into 100 sec bins |
 |
 |
| Parameter | Plot |
|---|---|
| CZT HV Monitor | 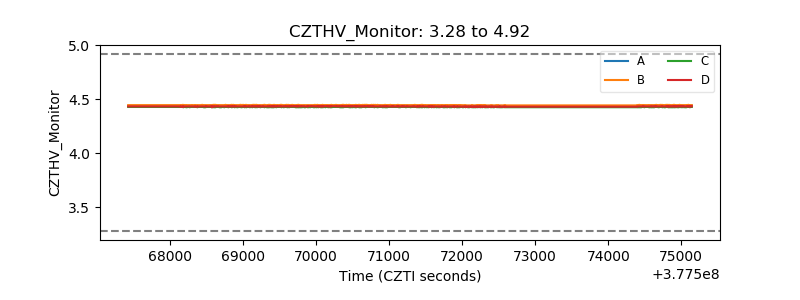 |
| D_VDD | 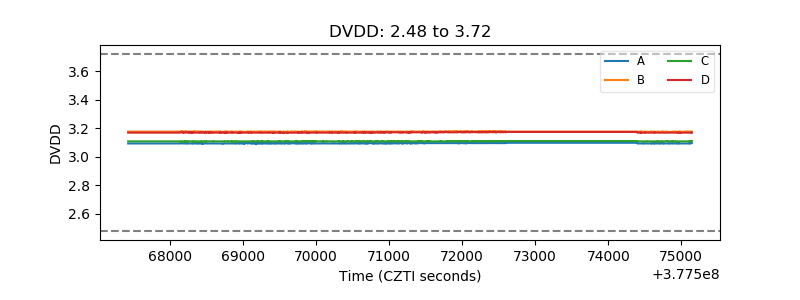 |
| Temperature 1 | 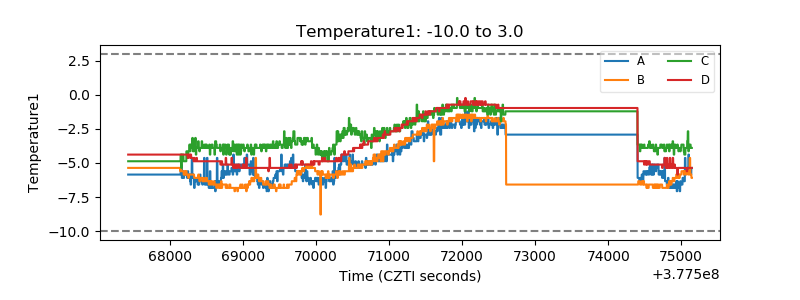 |
| Veto HV Monitor | 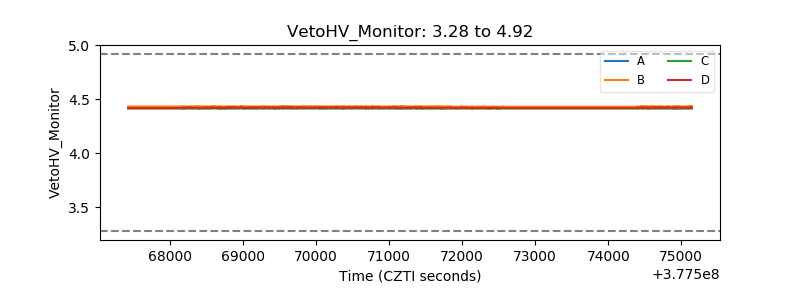 |
| Veto LLD | 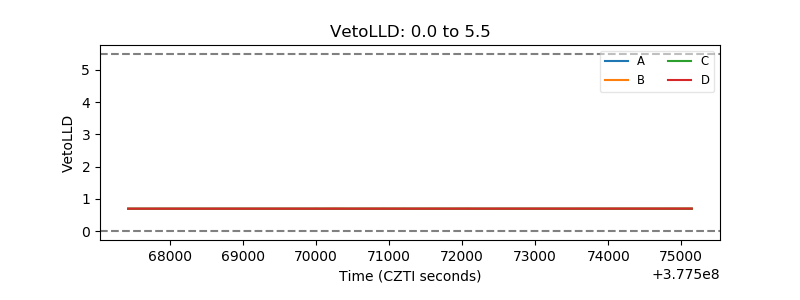 |
| Alpha Counter | 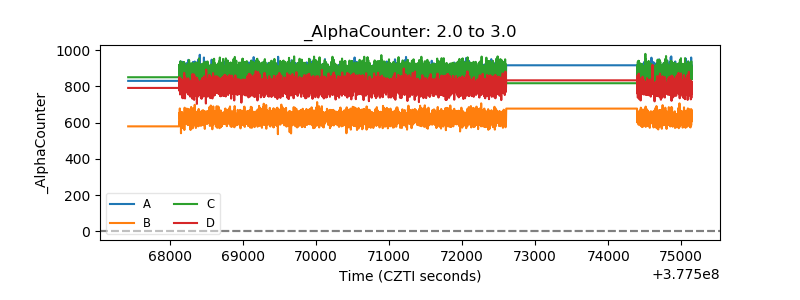 |
| _CPM_Rate | 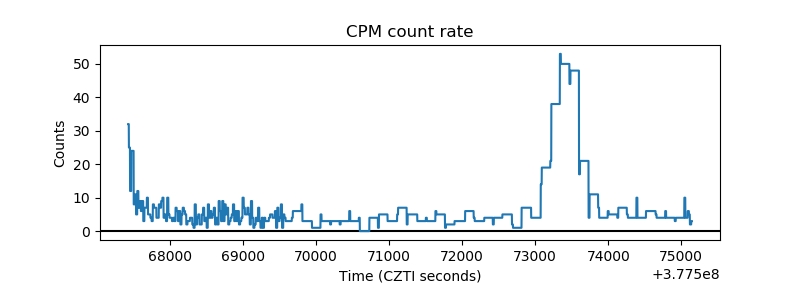 |
| CZT Counter | 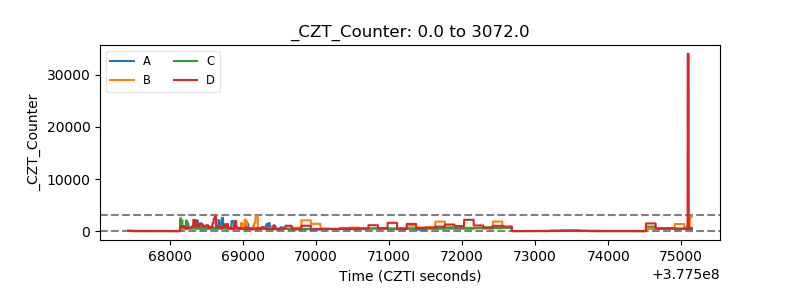 |
| +2.5 Volts monitor |  |
| +5 Volts monitor | 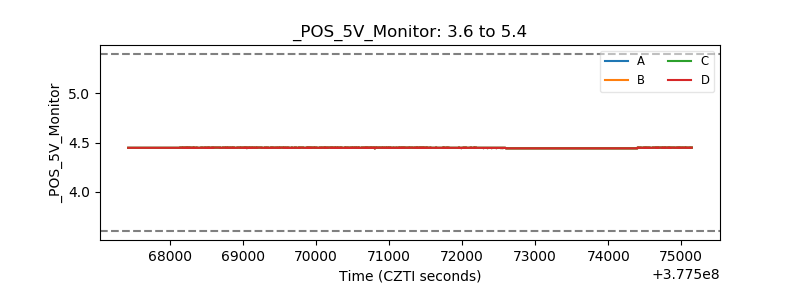 |
| _ROLL_ROT | 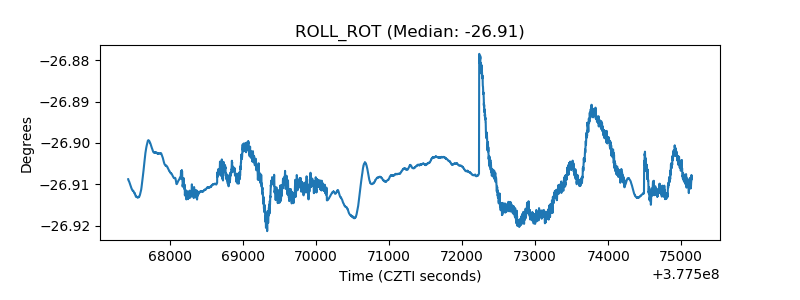 |
| _Roll_DEC | 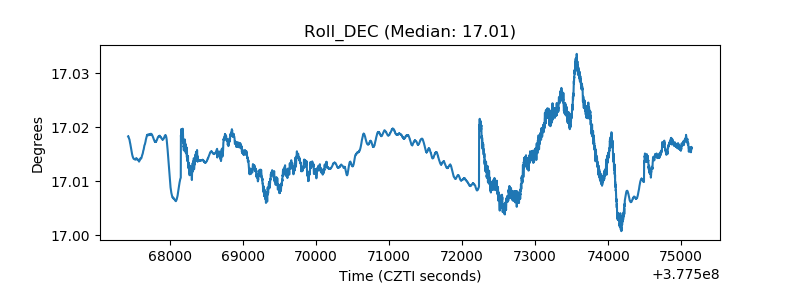 |
| _Roll_RA | 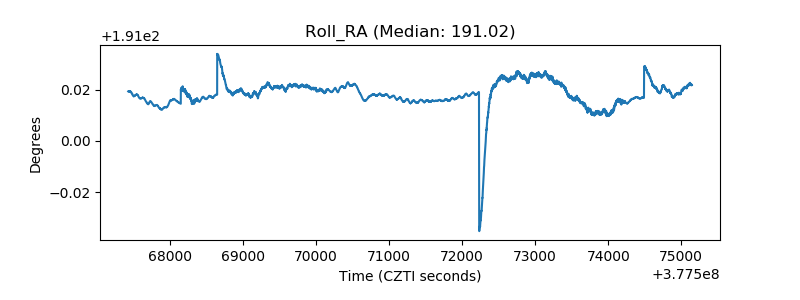 |
| Veto Counter | 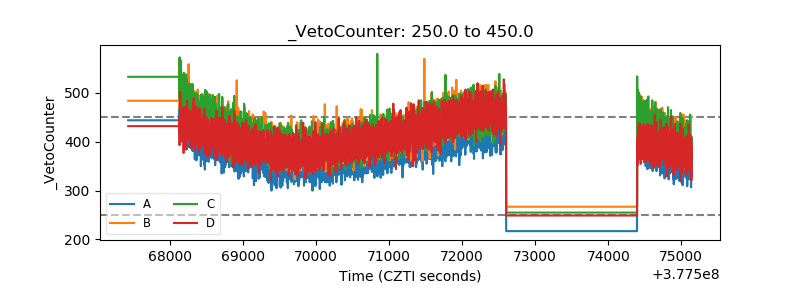 |