| Param | Original file | Final file |
|---|---|---|
| Filename | modeM0/AS1T04_076T01_9000004810_33659cztM0_level2.evt | modeM0/AS1T04_076T01_9000004810_33659cztM0_level2_quad_clean.evt |
| Size (bytes) | 580,953,600 | 77,051,520 |
| Size | 554.0 MB | 73.5 MB |
| Events in quadrant A | 4,106,885 | 477,477 |
| Events in quadrant B | 5,084,722 | 482,239 |
| Events in quadrant C | 3,563,427 | 490,252 |
| Events in quadrant D | 4,433,962 | 464,838 |
| Mode SS | |||
|---|---|---|---|
| Quadrant | BADHDUFLAG | Total packets | Discarded packets |
| A | 0 | 120 | 0 |
| B | 0 | 120 | 0 |
| C | 0 | 120 | 0 |
| D | 0 | 120 | 0 |
| Mode M9 | |||
|---|---|---|---|
| Quadrant | BADHDUFLAG | Total packets | Discarded packets |
| A | 0 | 30 | 0 |
| B | 0 | 30 | 0 |
| C | 0 | 30 | 0 |
| D | 0 | 31 | 0 |
| Mode M0 | |||
|---|---|---|---|
| Quadrant | BADHDUFLAG | Total packets | Discarded packets |
| A | 0 | 16219 | 3 |
| B | 0 | 19075 | 2 |
| C | 0 | 14482 | 2 |
| D | 0 | 17355 | 2 |
| Quadrant | Total seconds | Saturated seconds | Saturation percentage |
|---|---|---|---|
| A | 5992 | 210 | 3.504673% |
| B | 5992 | 854 | 14.252336% |
| C | 5992 | 91 | 1.518692% |
| D | 5992 | 169 | 2.820427% |
Noise dominated data is calculated using 1-second bins in cleaned event files. If a bin has >2000 counts, and if more than 50% of those come from <1% of pixels, then it is considered to be noise-dominated and hence unusable.
| Quadrant | # 1 sec bins | Bins with >0 counts | Bins with >2000 counts | High rate bins dominated by noise | Noise dominated (total time) | Noise dominated (detector-on time) | Marked lightcurve |
|---|---|---|---|---|---|---|---|
| A | 7423 | 5993 | 184 | 184 | 2.48% | 3.07% | 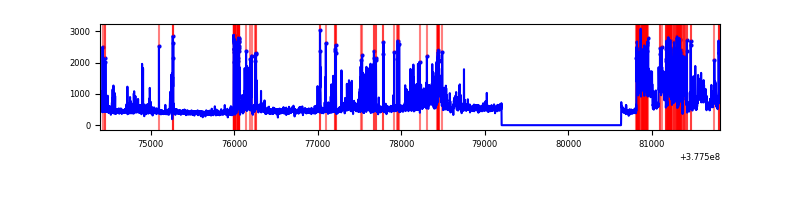 |
| B | 7423 | 5992 | 673 | 673 | 9.07% | 11.23% | 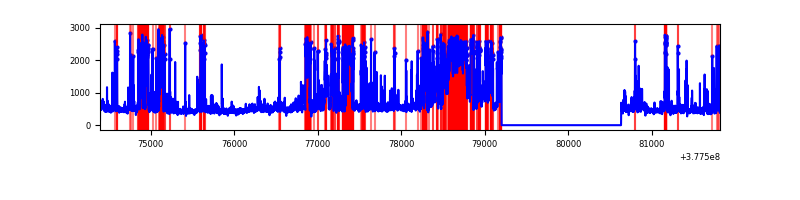 |
| C | 7423 | 5993 | 74 | 74 | 1.00% | 1.23% | 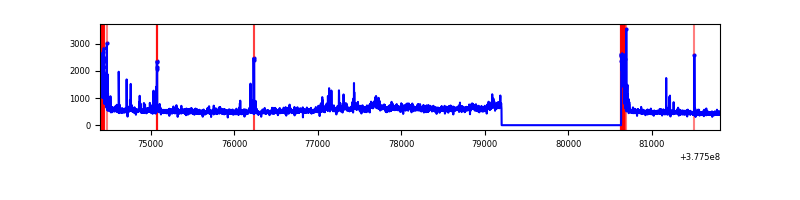 |
| D | 7423 | 5992 | 155 | 155 | 2.09% | 2.59% | 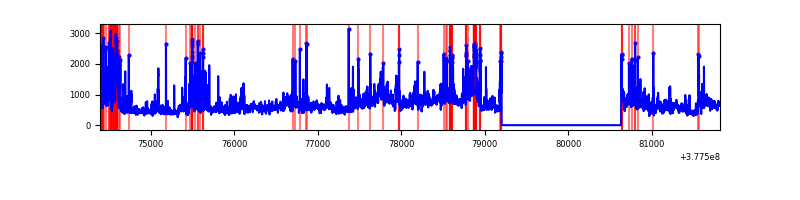 |
Top three noisy pixels from each quadrant. If the there are fewer than three noisy pixels in the level2.evt file, extra rows are filled as -1
| Pixel properties | Quadrant properties | ||||||
|---|---|---|---|---|---|---|---|
| Quadrant | DetID | PixID | Counts | Sigma | Mean | Median | Sigma |
| A | 15 | 169 | 934495 | 6692.56 | 687 | 674 | 139.5 |
| A | 15 | 237 | 432353 | 3093.78 | 687 | 674 | 139.5 |
| A | 15 | 253 | 28898 | 202.28 | 687 | 674 | 139.5 |
| B | 5 | 172 | 2193626 | 17661.49 | 649 | 631 | 124.2 |
| B | 15 | 222 | 133552 | 1070.49 | 649 | 631 | 124.2 |
| B | 15 | 201 | 51938 | 413.21 | 649 | 631 | 124.2 |
| C | 3 | 233 | 409357 | 2612.39 | 675 | 681 | 156.4 |
| C | 15 | 214 | 278970 | 1778.91 | 675 | 681 | 156.4 |
| C | 0 | 10 | 204643 | 1303.79 | 675 | 681 | 156.4 |
| D | 8 | 195 | 915349 | 5232.1 | 668 | 656 | 174.8 |
| D | 12 | 6 | 226602 | 1292.43 | 668 | 656 | 174.8 |
| D | 2 | 250 | 213410 | 1216.97 | 668 | 656 | 174.8 |
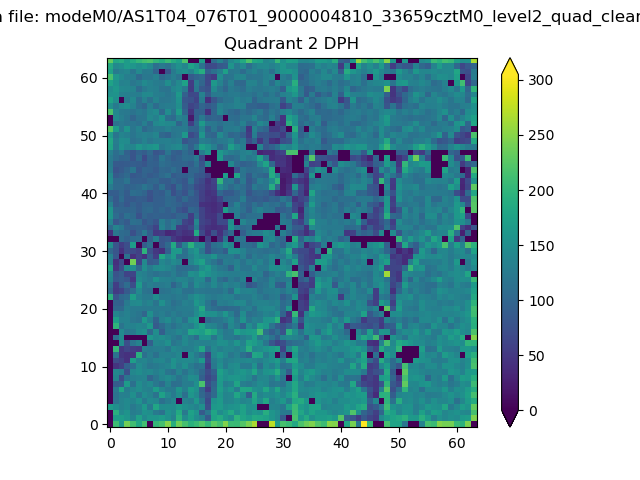
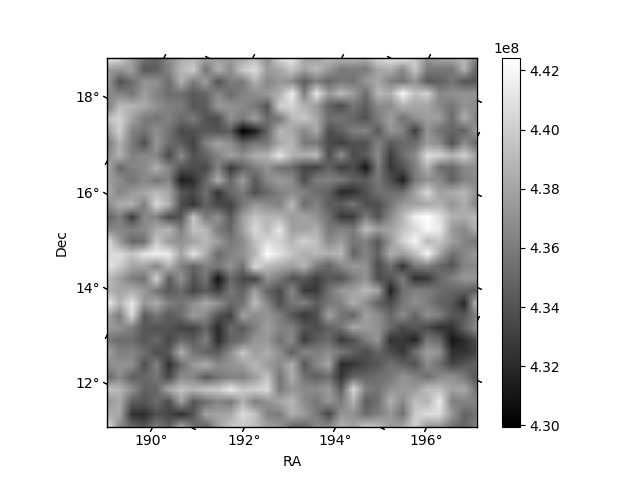
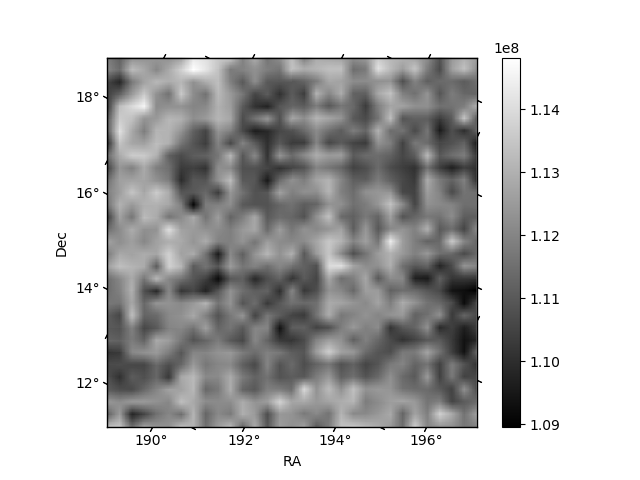
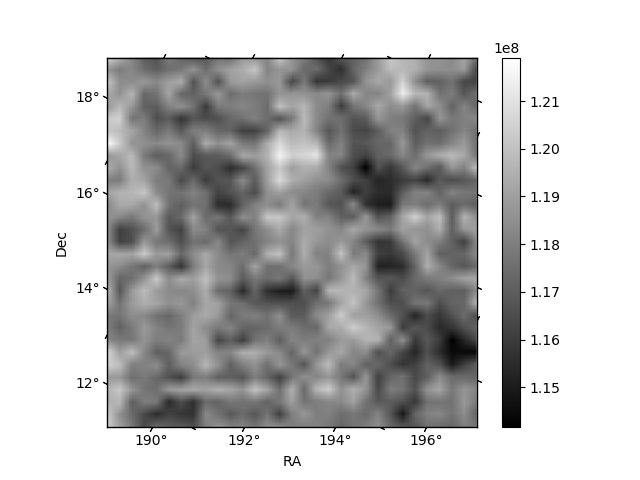
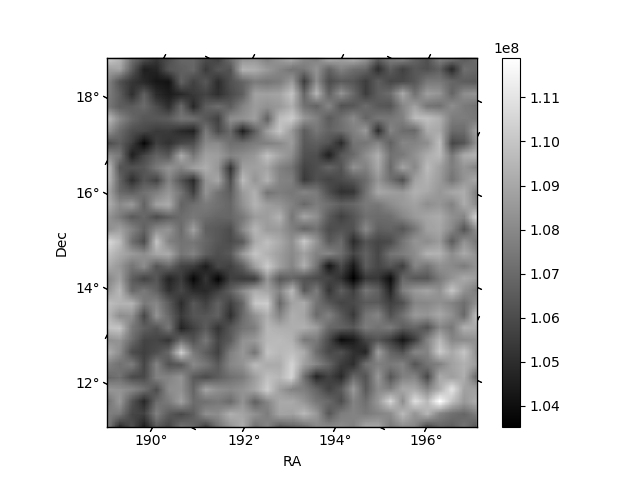
Histogram calculated using DETX and DETY for each event in the final _common_clean file
| Quadrant A | 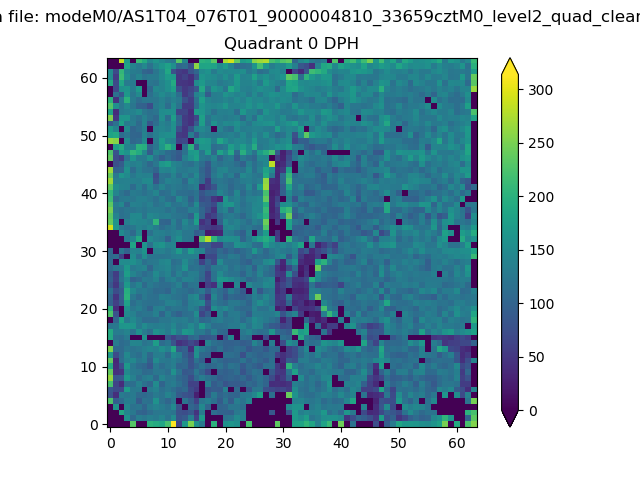 |
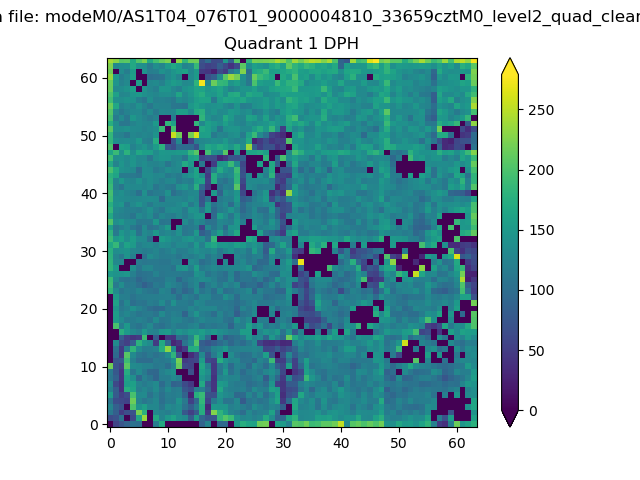 |
Quadrant B |
|---|---|---|---|
| Quadrant D | 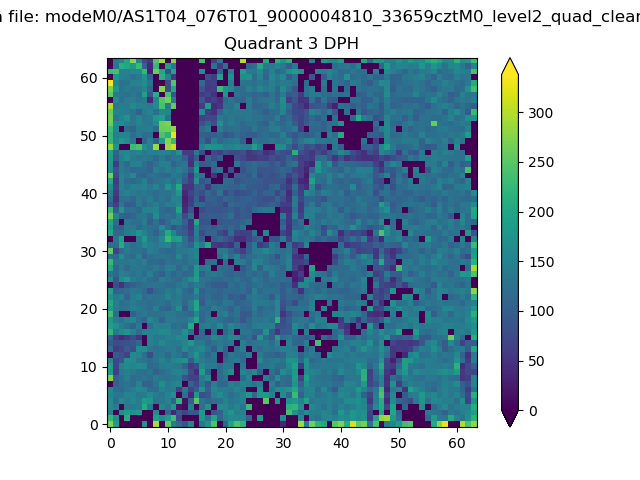 |
 |
Quadrant C |
| Plot type | Count rate plots | Images |
|---|---|---|
| Comparison with Poisson distribution Blue bars denote a histogram of data divided into 1 sec bins. Red curve is a Poisson curve with rate = median count rate of data. |
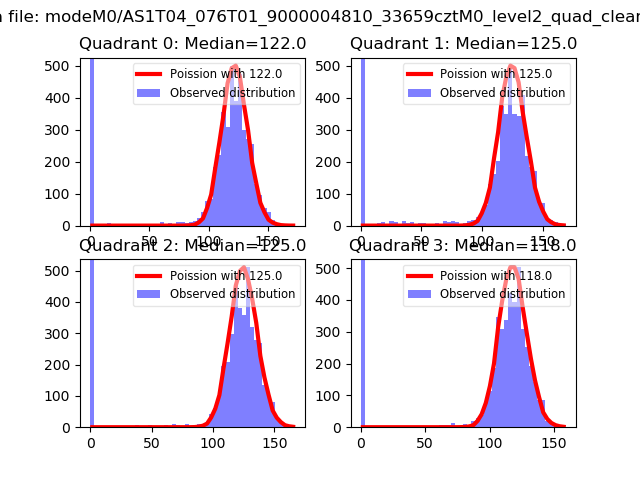 |
 |
| Quadrant-wise count rates Data is divided into 100 sec bins |
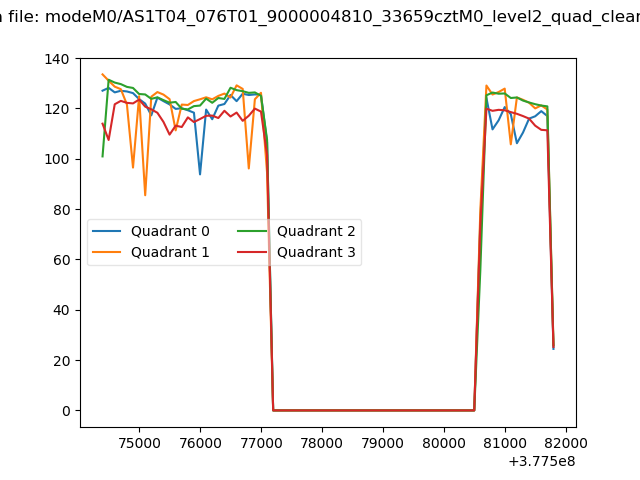 |
|
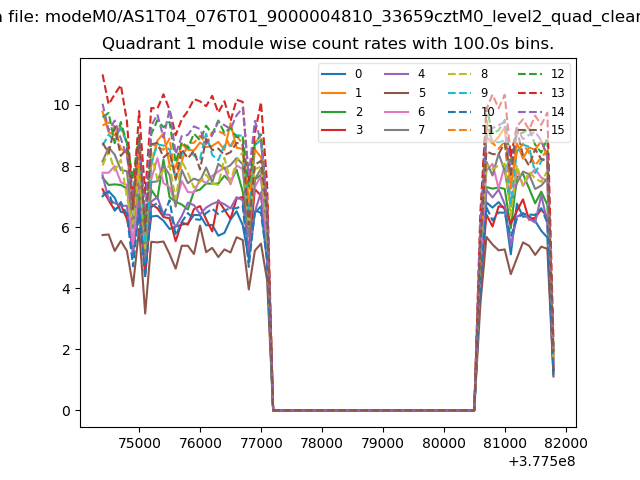
| Module-wise count rates for Quadrant A Data is divided into 100 sec bins |
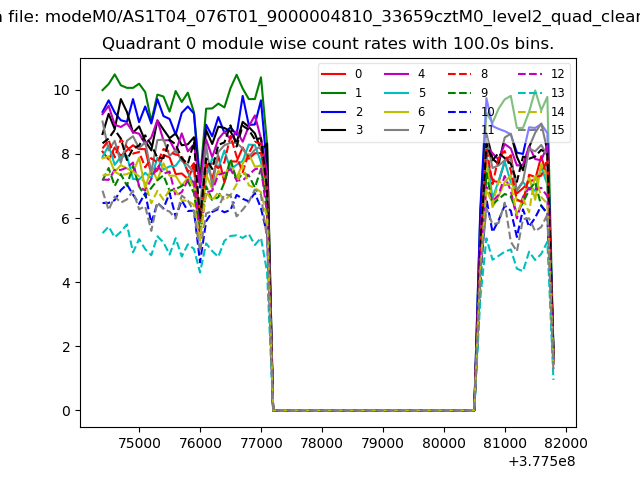 |
 |
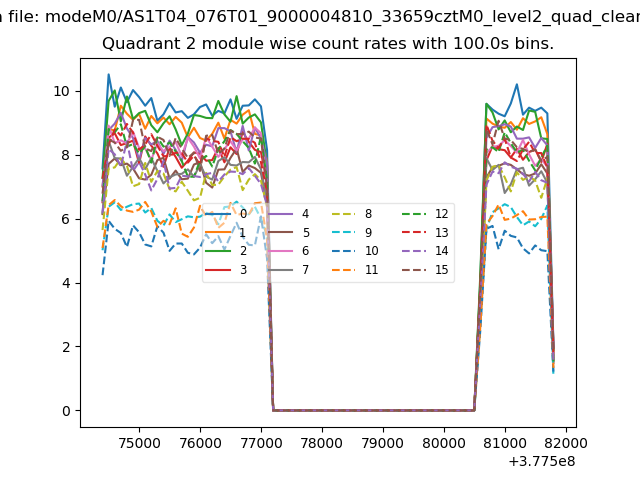
| Module-wise count rates for Quadrant B Data is divided into 100 sec bins |
 |
 |
| Module-wise count rates for Quadrant C Data is divided into 100 sec bins |
 |
 |
| Module-wise count rates for Quadrant D Data is divided into 100 sec bins |
 |
 |
| Parameter | Plot |
|---|---|
| CZT HV Monitor | 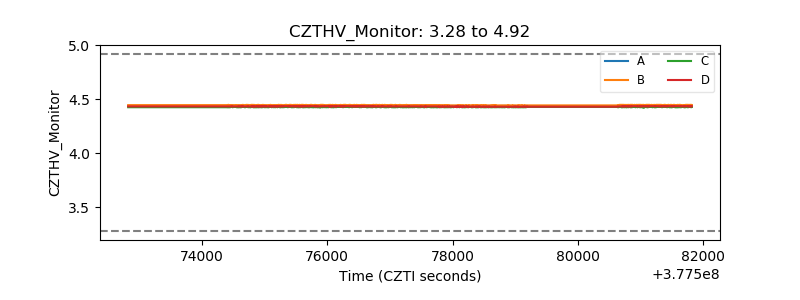 |
| D_VDD | 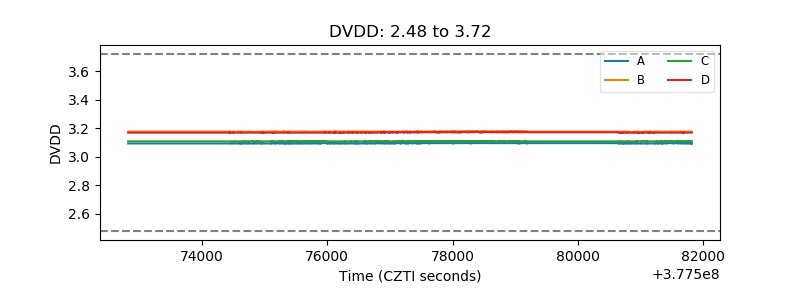 |
| Temperature 1 | 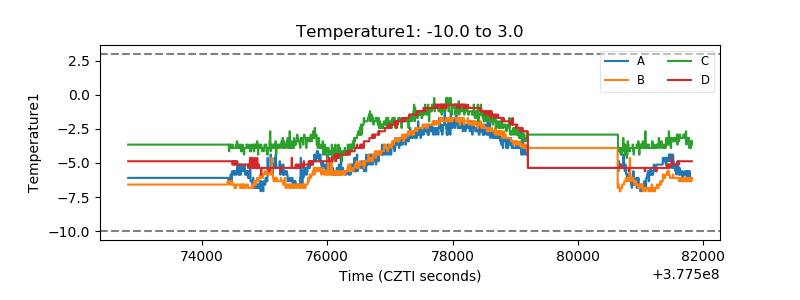 |
| Veto HV Monitor | 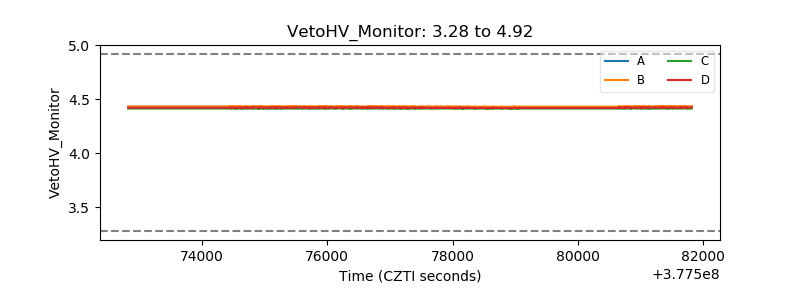 |
| Veto LLD | 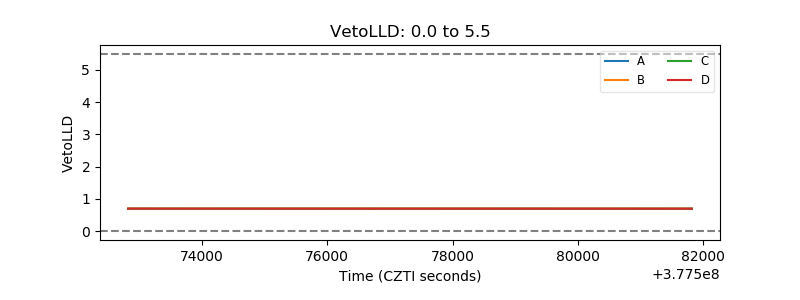 |
| Alpha Counter | 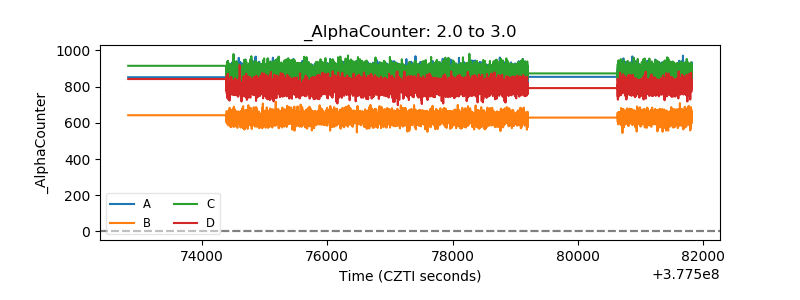 |
| _CPM_Rate | 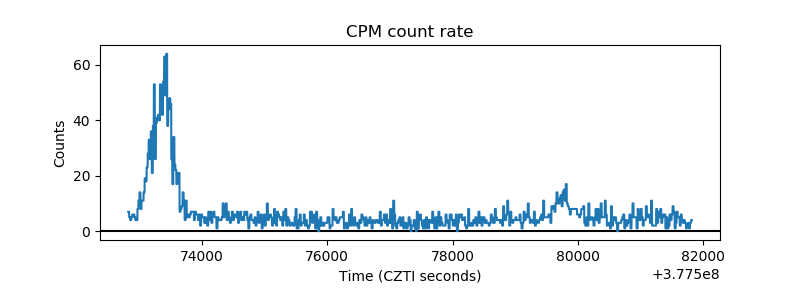 |
| CZT Counter | 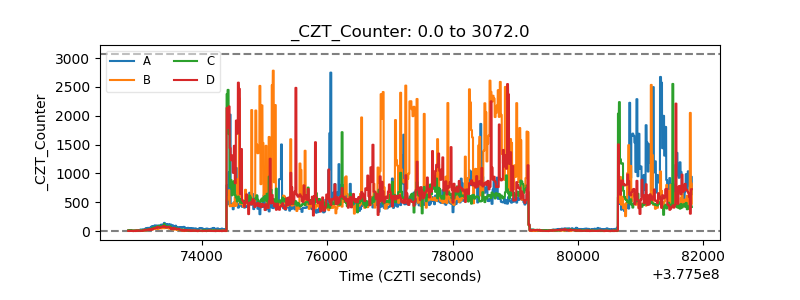 |
| +2.5 Volts monitor |  |
| +5 Volts monitor |  |
| _ROLL_ROT | 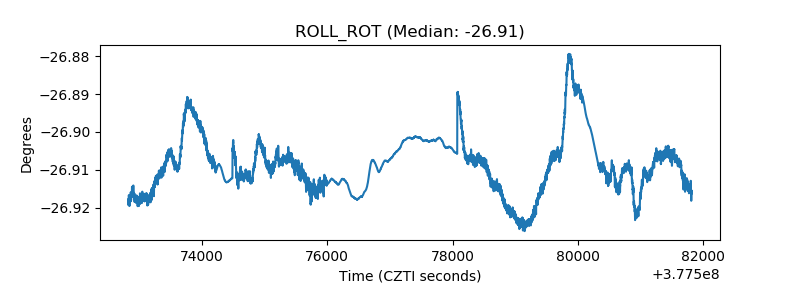 |
| _Roll_DEC | 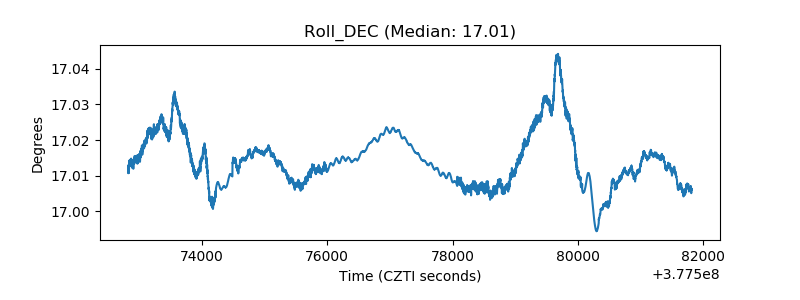 |
| _Roll_RA | 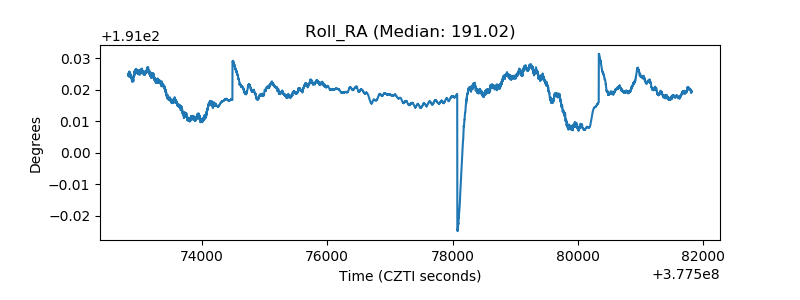 |
| Veto Counter |  |