| Param | Original file | Final file |
|---|---|---|
| Filename | modeM0/AS1T04_076T01_9000004810_33660cztM0_level2.evt | modeM0/AS1T04_076T01_9000004810_33660cztM0_level2_quad_clean.evt |
| Size (bytes) | 580,023,360 | 74,188,800 |
| Size | 553.2 MB | 70.8 MB |
| Events in quadrant A | 4,767,014 | 440,827 |
| Events in quadrant B | 4,082,392 | 465,243 |
| Events in quadrant C | 3,523,213 | 465,476 |
| Events in quadrant D | 4,773,225 | 441,347 |
| Mode SS | |||
|---|---|---|---|
| Quadrant | BADHDUFLAG | Total packets | Discarded packets |
| A | 0 | 126 | 0 |
| B | 0 | 126 | 0 |
| C | 0 | 126 | 0 |
| D | 0 | 126 | 0 |
| Mode M9 | |||
|---|---|---|---|
| Quadrant | BADHDUFLAG | Total packets | Discarded packets |
| A | 0 | 28 | 0 |
| B | 0 | 28 | 0 |
| C | 0 | 28 | 0 |
| D | 0 | 28 | 0 |
| Mode M0 | |||
|---|---|---|---|
| Quadrant | BADHDUFLAG | Total packets | Discarded packets |
| A | 0 | 18108 | 3 |
| B | 0 | 16197 | 2 |
| C | 0 | 14376 | 2 |
| D | 0 | 18545 | 2 |
| Quadrant | Total seconds | Saturated seconds | Saturation percentage |
|---|---|---|---|
| A | 6217 | 312 | 5.018498% |
| B | 6217 | 303 | 4.873733% |
| C | 6217 | 63 | 1.013350% |
| D | 6217 | 166 | 2.670098% |
Noise dominated data is calculated using 1-second bins in cleaned event files. If a bin has >2000 counts, and if more than 50% of those come from <1% of pixels, then it is considered to be noise-dominated and hence unusable.
| Quadrant | # 1 sec bins | Bins with >0 counts | Bins with >2000 counts | High rate bins dominated by noise | Noise dominated (total time) | Noise dominated (detector-on time) | Marked lightcurve |
|---|---|---|---|---|---|---|---|
| A | 8931 | 6219 | 302 | 302 | 3.38% | 4.86% | 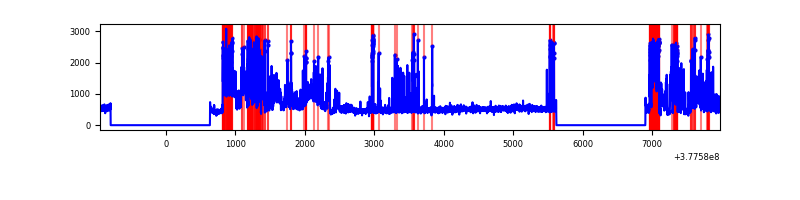 |
| B | 8931 | 6218 | 218 | 218 | 2.44% | 3.51% | 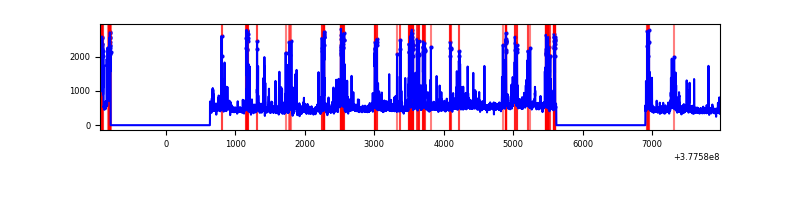 |
| C | 8931 | 6219 | 54 | 54 | 0.60% | 0.87% | 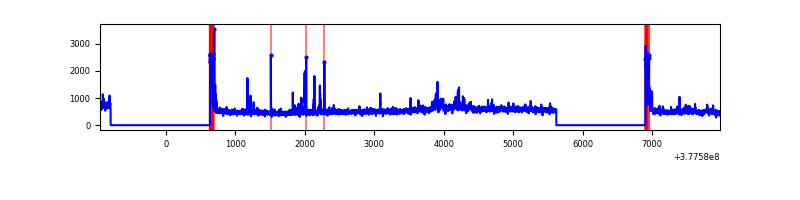 |
| D | 8931 | 6218 | 133 | 133 | 1.49% | 2.14% | 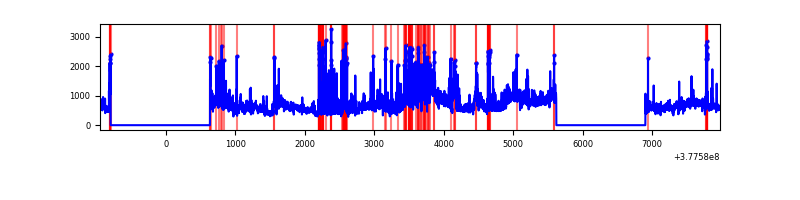 |
Top three noisy pixels from each quadrant. If the there are fewer than three noisy pixels in the level2.evt file, extra rows are filled as -1
| Pixel properties | Quadrant properties | ||||||
|---|---|---|---|---|---|---|---|
| Quadrant | DetID | PixID | Counts | Sigma | Mean | Median | Sigma |
| A | 15 | 169 | 1662432 | 11661.26 | 712 | 699 | 142.5 |
| A | 15 | 237 | 267750 | 1874.04 | 712 | 699 | 142.5 |
| A | 15 | 253 | 32214 | 221.16 | 712 | 699 | 142.5 |
| B | 5 | 172 | 1075415 | 7745.53 | 713 | 695 | 138.8 |
| B | 15 | 222 | 58205 | 414.48 | 713 | 695 | 138.8 |
| B | 5 | 255 | 37315 | 263.92 | 713 | 695 | 138.8 |
| C | 15 | 214 | 286954 | 1762.16 | 704 | 711 | 162.4 |
| C | 3 | 233 | 206044 | 1264.06 | 704 | 711 | 162.4 |
| C | 0 | 10 | 189178 | 1160.23 | 704 | 711 | 162.4 |
| D | 8 | 195 | 1275122 | 7382.74 | 702 | 684 | 172.6 |
| D | 2 | 250 | 191529 | 1105.55 | 702 | 684 | 172.6 |
| D | 13 | 249 | 143421 | 826.86 | 702 | 684 | 172.6 |
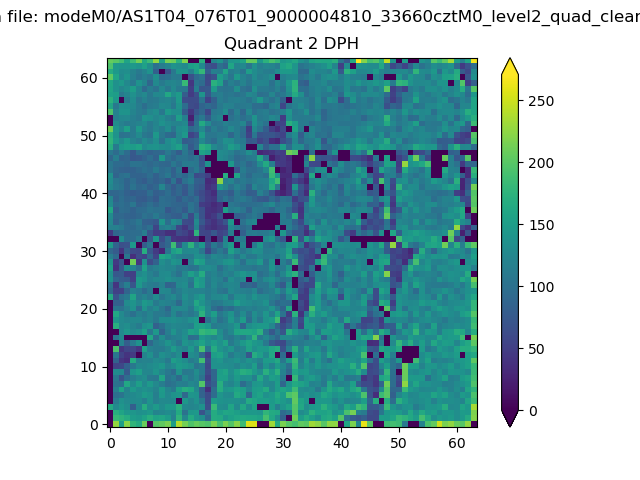
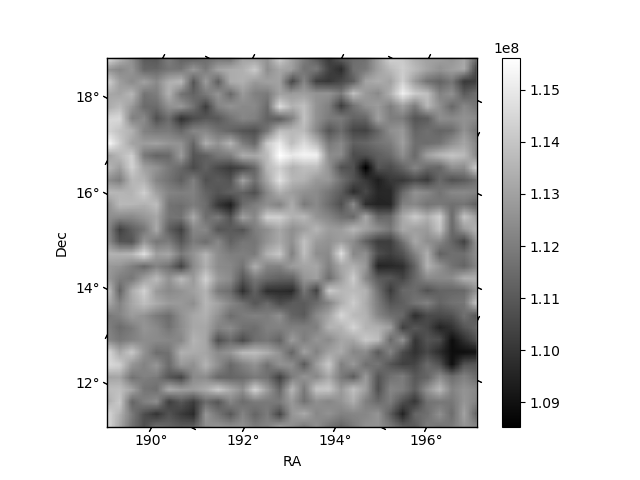
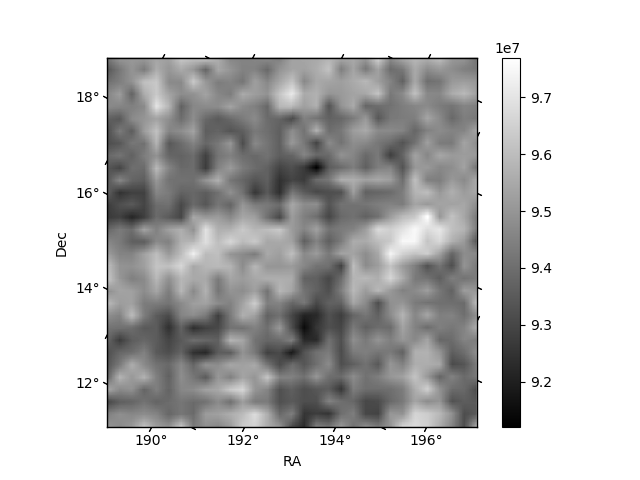
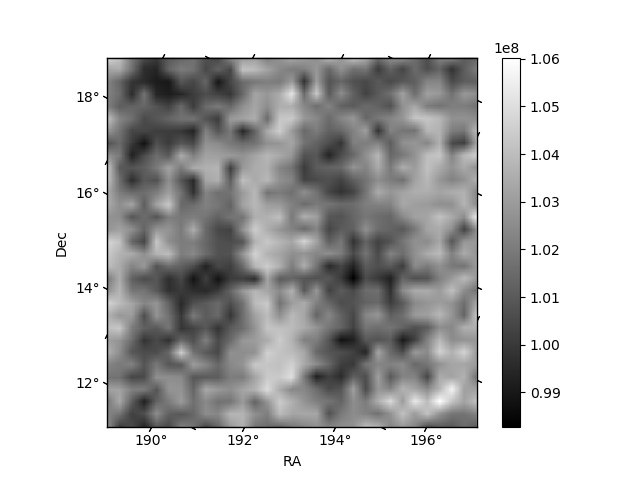
Histogram calculated using DETX and DETY for each event in the final _common_clean file
| Quadrant A | 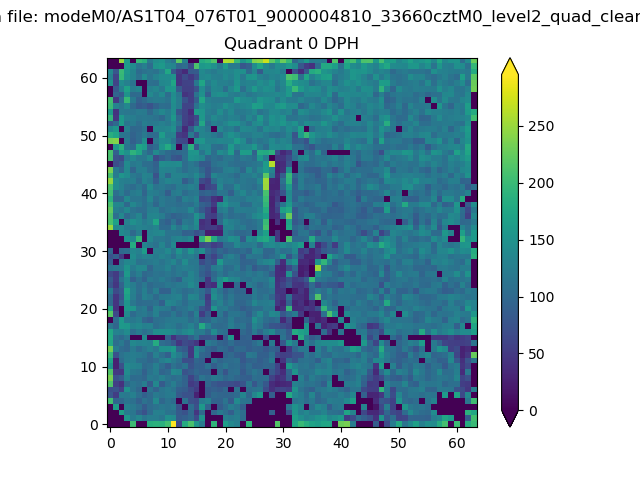 |
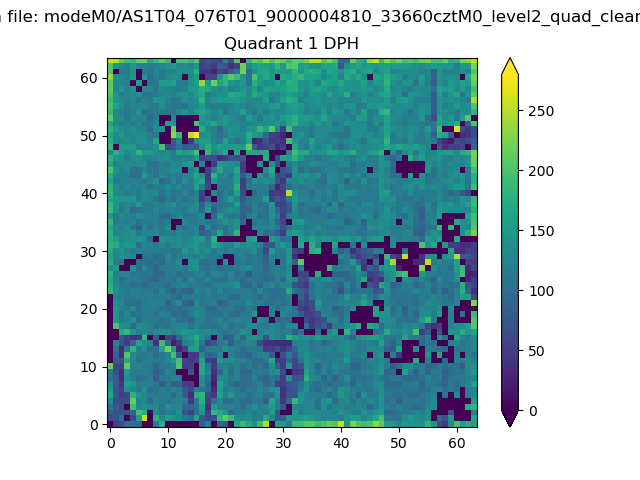 |
Quadrant B |
|---|---|---|---|
| Quadrant D | 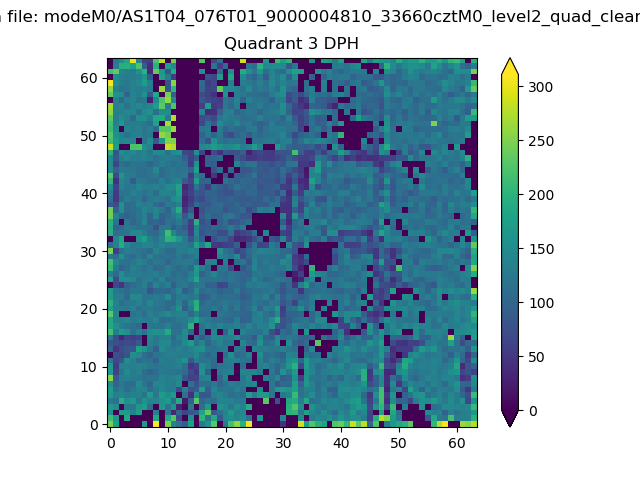 |
 |
Quadrant C |
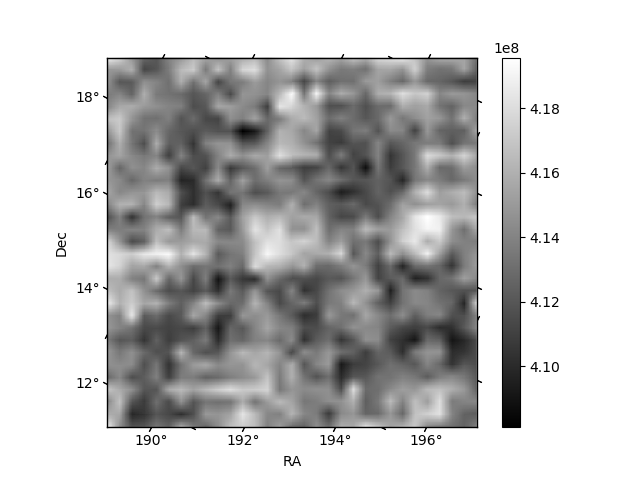
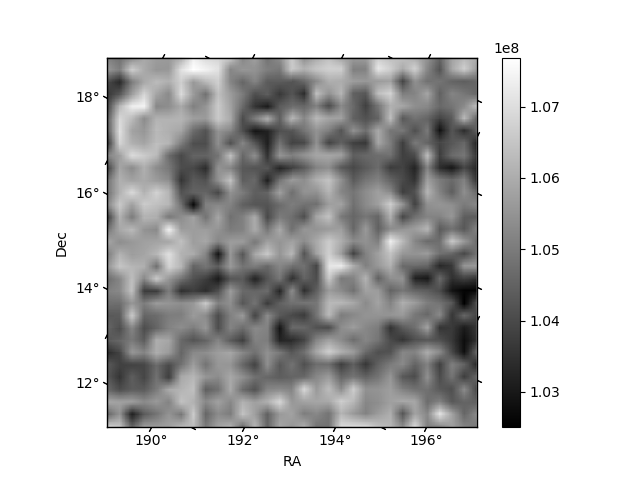
| Plot type | Count rate plots | Images |
|---|---|---|
| Comparison with Poisson distribution Blue bars denote a histogram of data divided into 1 sec bins. Red curve is a Poisson curve with rate = median count rate of data. |
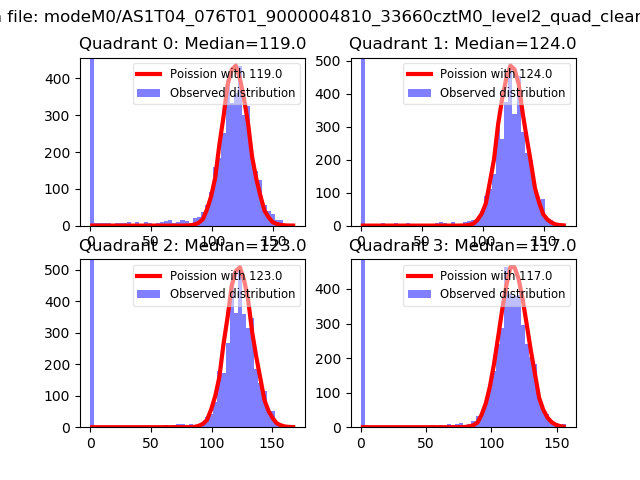 |
 |
| Quadrant-wise count rates Data is divided into 100 sec bins |
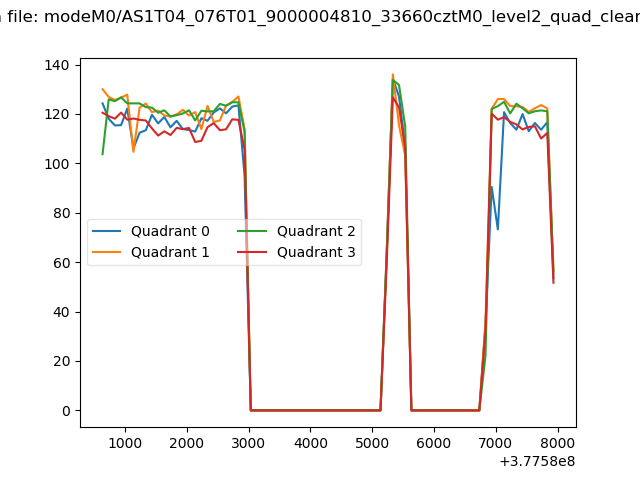 |
|
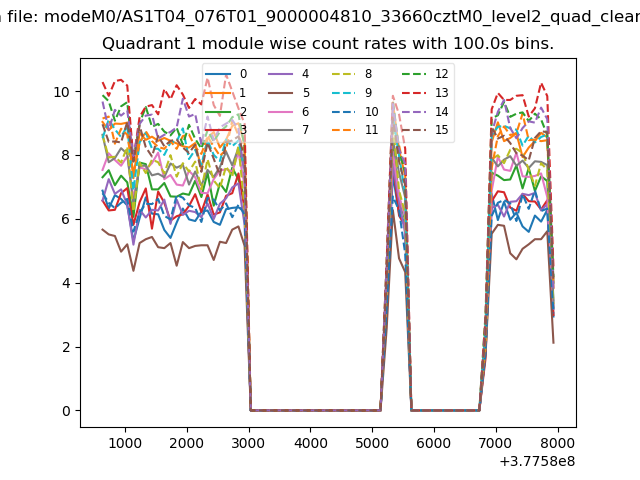
| Module-wise count rates for Quadrant A Data is divided into 100 sec bins |
 |
 |
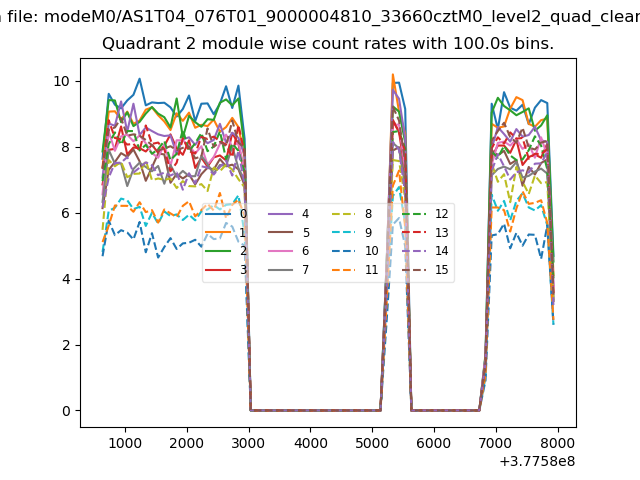
| Module-wise count rates for Quadrant B Data is divided into 100 sec bins |
 |
 |
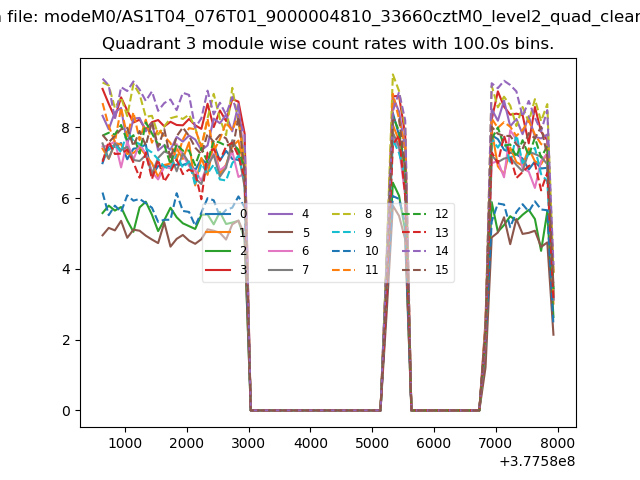
| Module-wise count rates for Quadrant C Data is divided into 100 sec bins |
 |
 |
| Module-wise count rates for Quadrant D Data is divided into 100 sec bins |
 |
 |
| Parameter | Plot |
|---|---|
| CZT HV Monitor | 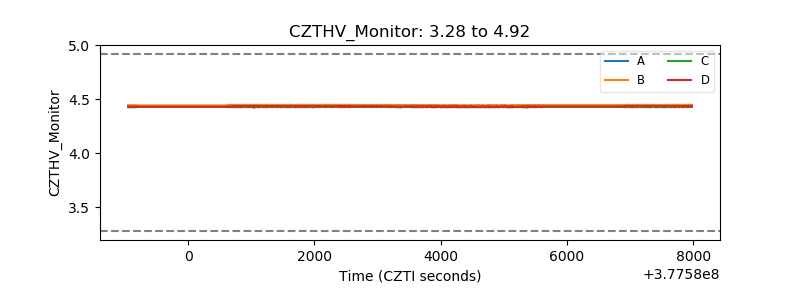 |
| D_VDD | 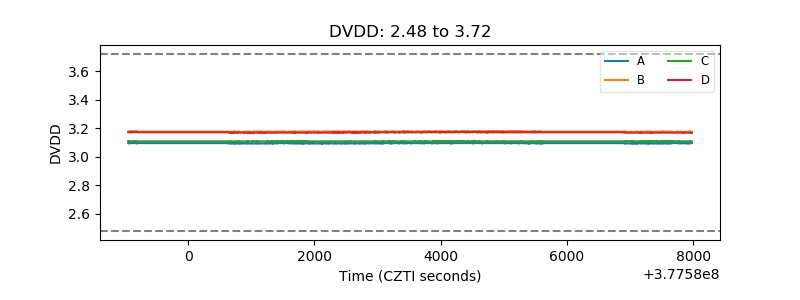 |
| Temperature 1 |  |
| Veto HV Monitor | 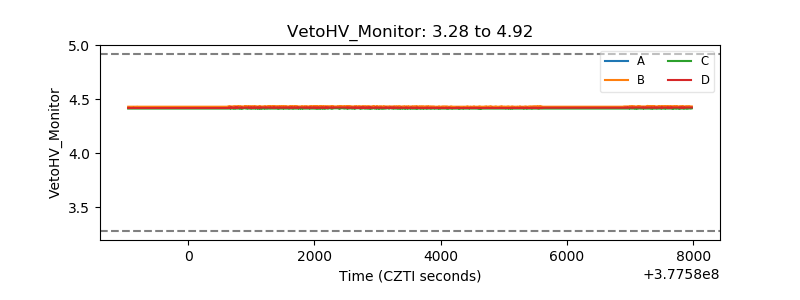 |
| Veto LLD | 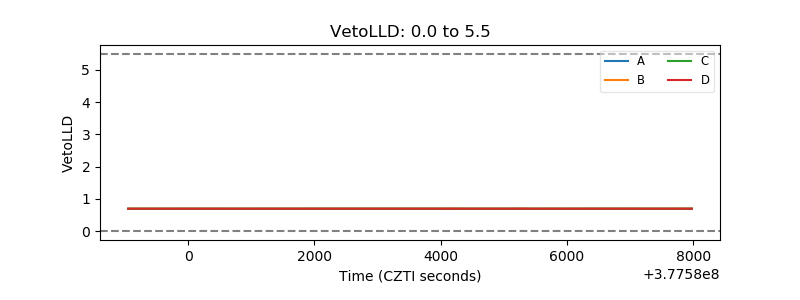 |
| Alpha Counter | 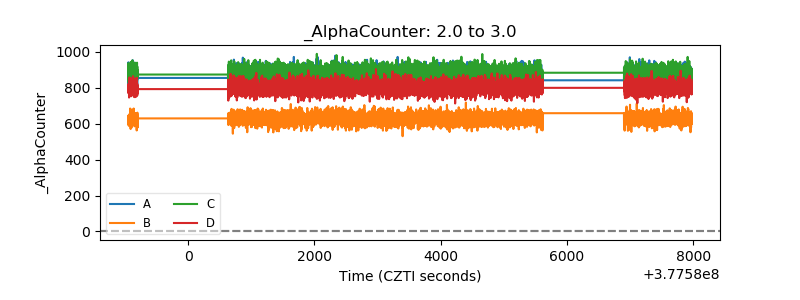 |
| _CPM_Rate | 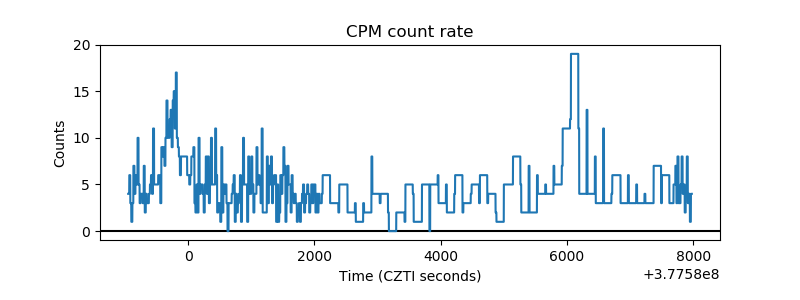 |
| CZT Counter | 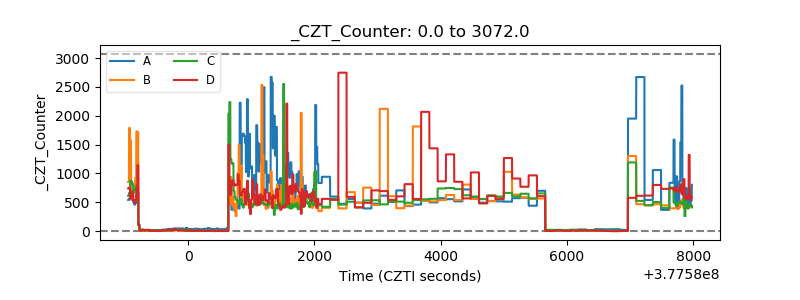 |
| +2.5 Volts monitor |  |
| +5 Volts monitor |  |
| _ROLL_ROT | 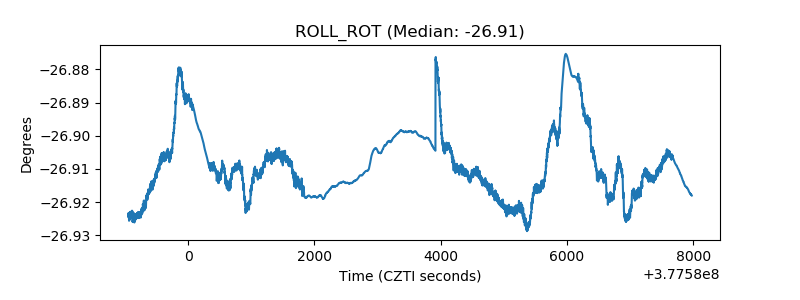 |
| _Roll_DEC |  |
| _Roll_RA | 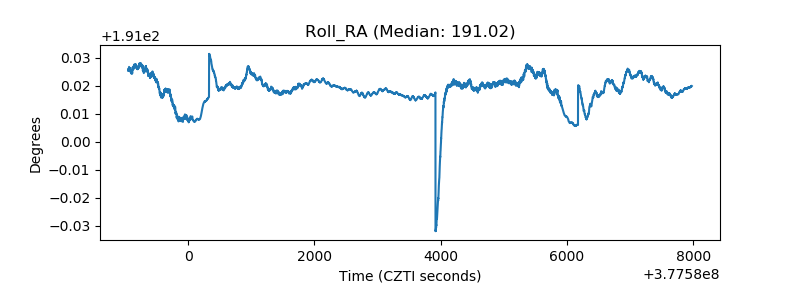 |
| Veto Counter | 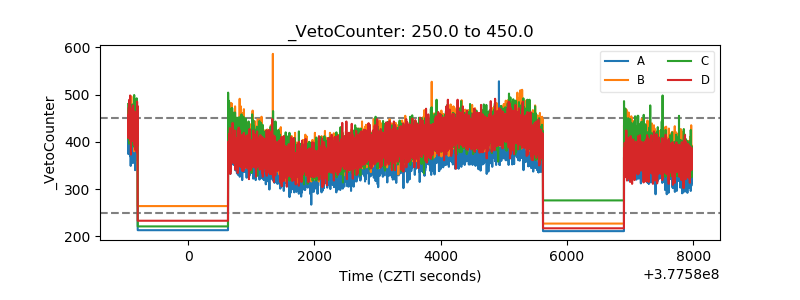 |