| Param | Original file | Final file |
|---|---|---|
| Filename | modeM0/AS1T04_076T01_9000004810_33663cztM0_level2.evt | modeM0/AS1T04_076T01_9000004810_33663cztM0_level2_quad_clean.evt |
| Size (bytes) | 1,604,151,360 | 173,609,280 |
| Size | 1.5 GB | 165.6 MB |
| Events in quadrant A | 16,893,823 | 936,658 |
| Events in quadrant B | 9,729,392 | 1,094,366 |
| Events in quadrant C | 9,018,653 | 1,105,978 |
| Events in quadrant D | 11,875,325 | 1,028,146 |
| Mode SS | |||
|---|---|---|---|
| Quadrant | BADHDUFLAG | Total packets | Discarded packets |
| A | 0 | 324 | 0 |
| B | 0 | 324 | 0 |
| C | 0 | 324 | 0 |
| D | 0 | 324 | 0 |
| Mode M9 | |||
|---|---|---|---|
| Quadrant | BADHDUFLAG | Total packets | Discarded packets |
| A | 0 | 54 | 0 |
| B | 0 | 54 | 0 |
| C | 0 | 54 | 0 |
| D | 0 | 54 | 0 |
| Mode M0 | |||
|---|---|---|---|
| Quadrant | BADHDUFLAG | Total packets | Discarded packets |
| A | 0 | 60684 | 5 |
| B | 0 | 38685 | 4 |
| C | 0 | 36175 | 4 |
| D | 0 | 46640 | 4 |
| Quadrant | Total seconds | Saturated seconds | Saturation percentage |
|---|---|---|---|
| A | 15820 | 3474 | 21.959545% |
| B | 15820 | 650 | 4.108723% |
| C | 15820 | 114 | 0.720607% |
| D | 15820 | 484 | 3.059418% |
Noise dominated data is calculated using 1-second bins in cleaned event files. If a bin has >2000 counts, and if more than 50% of those come from <1% of pixels, then it is considered to be noise-dominated and hence unusable.
| Quadrant | # 1 sec bins | Bins with >0 counts | Bins with >2000 counts | High rate bins dominated by noise | Noise dominated (total time) | Noise dominated (detector-on time) | Marked lightcurve |
|---|---|---|---|---|---|---|---|
| A | 21193 | 15823 | 3286 | 3286 | 15.51% | 20.77% | 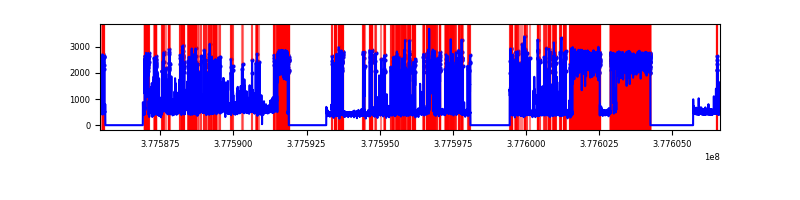 |
| B | 21193 | 15824 | 522 | 522 | 2.46% | 3.30% | 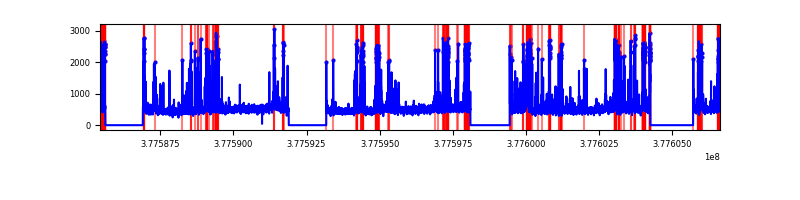 |
| C | 21193 | 15825 | 104 | 104 | 0.49% | 0.66% | 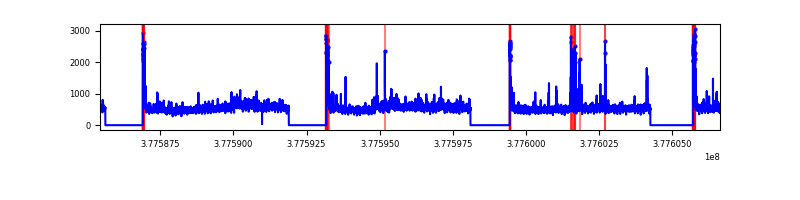 |
| D | 21193 | 15825 | 417 | 417 | 1.97% | 2.64% | 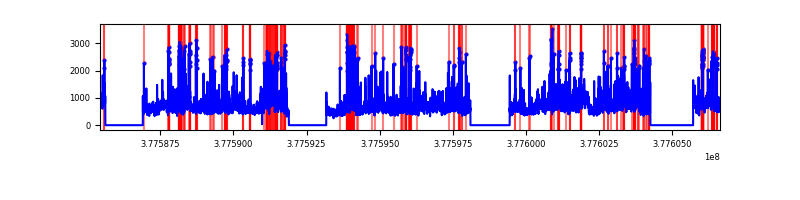 |
Top three noisy pixels from each quadrant. If the there are fewer than three noisy pixels in the level2.evt file, extra rows are filled as -1
| Pixel properties | Quadrant properties | ||||||
|---|---|---|---|---|---|---|---|
| Quadrant | DetID | PixID | Counts | Sigma | Mean | Median | Sigma |
| A | 15 | 169 | 9587006 | 28805.56 | 1665 | 1629 | 332.8 |
| A | 15 | 237 | 834668 | 2503.41 | 1665 | 1629 | 332.8 |
| A | 13 | 254 | 23677 | 66.26 | 1665 | 1629 | 332.8 |
| B | 5 | 172 | 2085110 | 5900.1 | 1837 | 1790 | 353.1 |
| B | 5 | 255 | 65095 | 179.28 | 1837 | 1790 | 353.1 |
| B | 15 | 85 | 62345 | 171.5 | 1837 | 1790 | 353.1 |
| C | 15 | 214 | 726534 | 1718.78 | 1828 | 1848 | 421.6 |
| C | 3 | 233 | 520998 | 1231.3 | 1828 | 1848 | 421.6 |
| C | 0 | 10 | 500854 | 1183.52 | 1828 | 1848 | 421.6 |
| D | 8 | 195 | 2524110 | 5687.24 | 1808 | 1758 | 443.5 |
| D | 2 | 250 | 601763 | 1352.85 | 1808 | 1758 | 443.5 |
| D | 12 | 6 | 388901 | 872.9 | 1808 | 1758 | 443.5 |
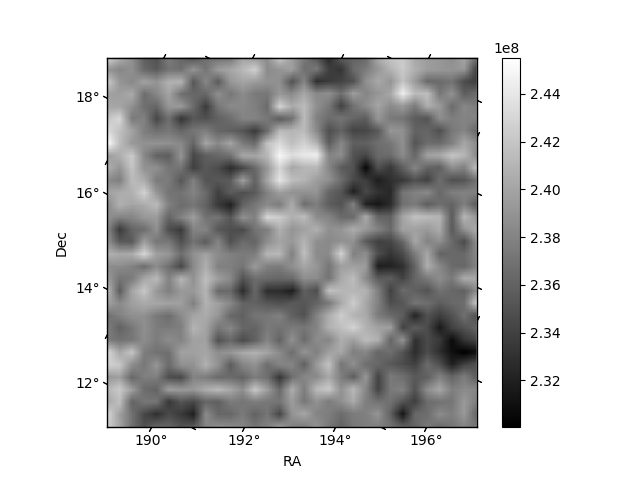
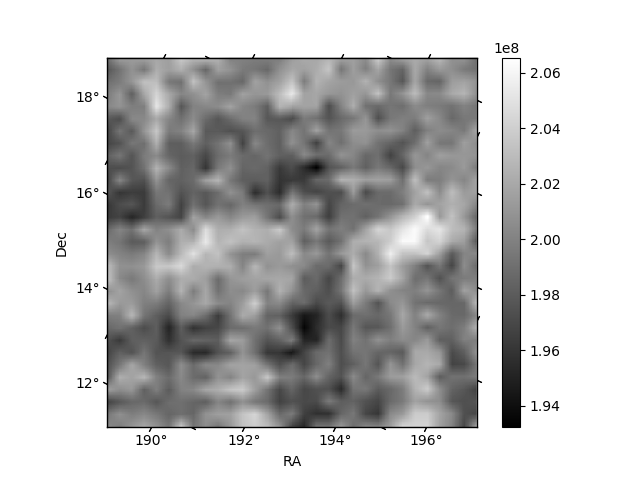
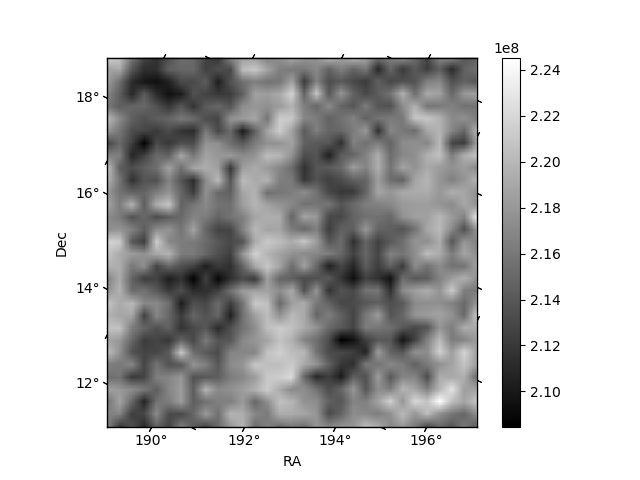
Histogram calculated using DETX and DETY for each event in the final _common_clean file
| Quadrant A | 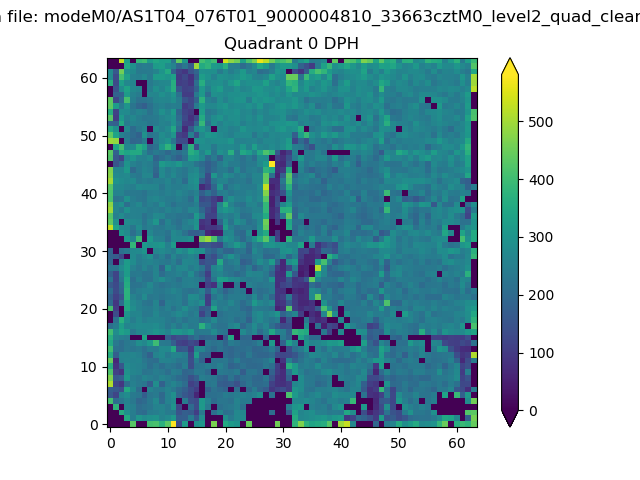 |
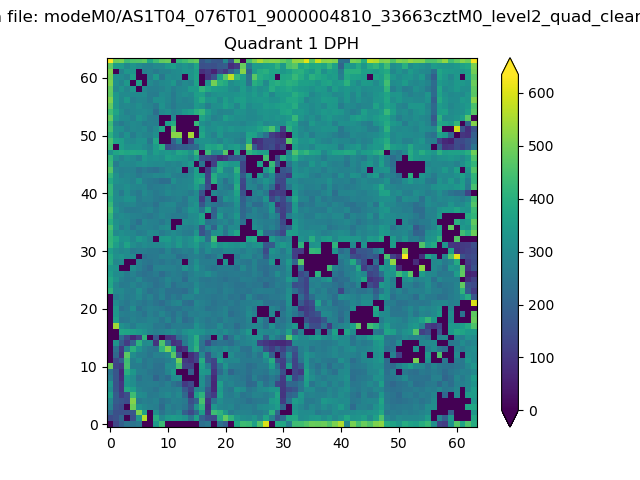 |
Quadrant B |
|---|---|---|---|
| Quadrant D | 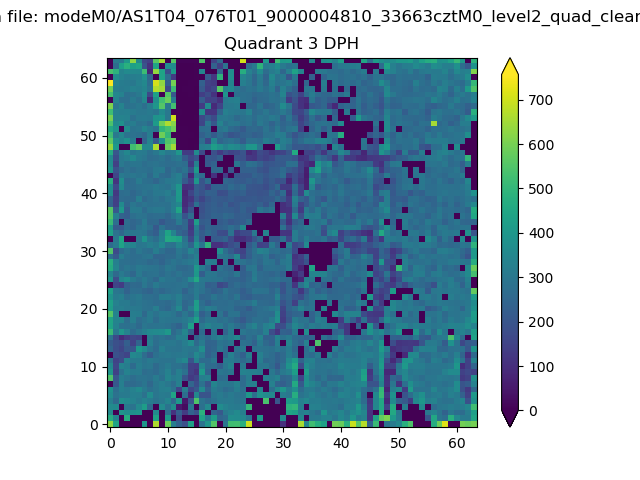 |
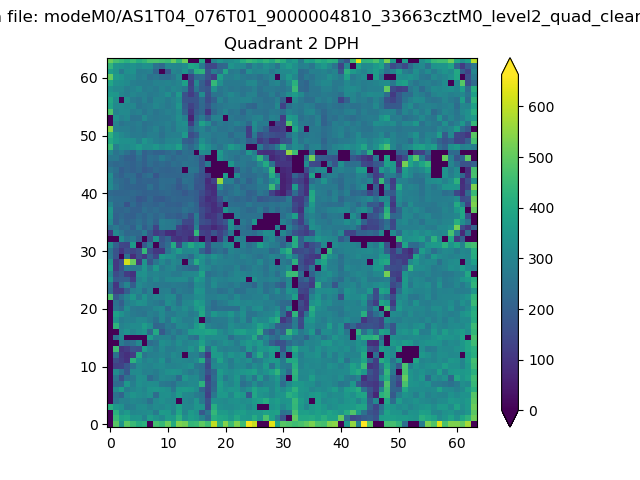 |
Quadrant C |
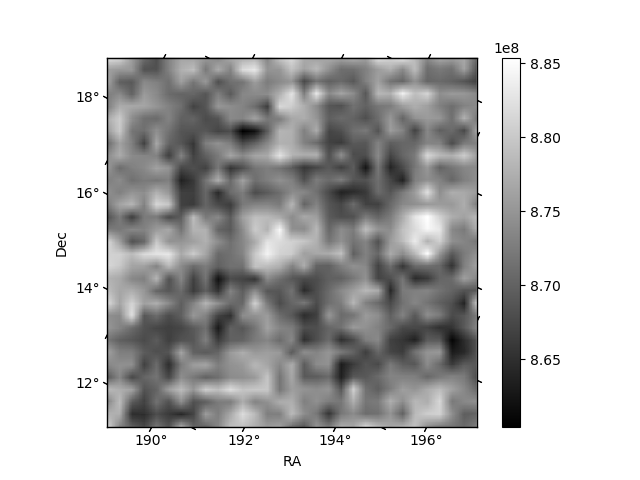
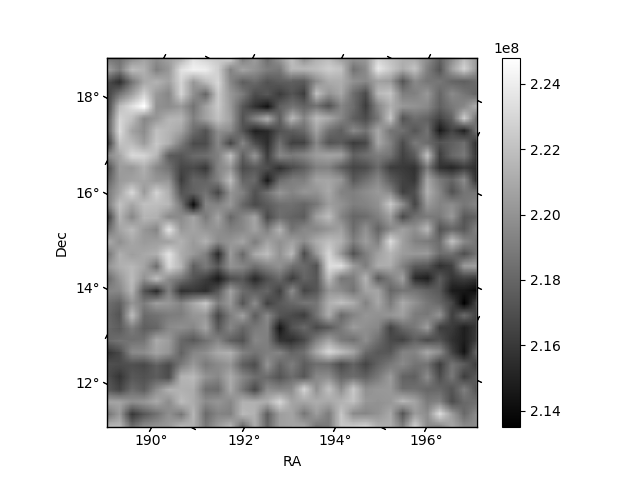
| Plot type | Count rate plots | Images |
|---|---|---|
| Comparison with Poisson distribution Blue bars denote a histogram of data divided into 1 sec bins. Red curve is a Poisson curve with rate = median count rate of data. |
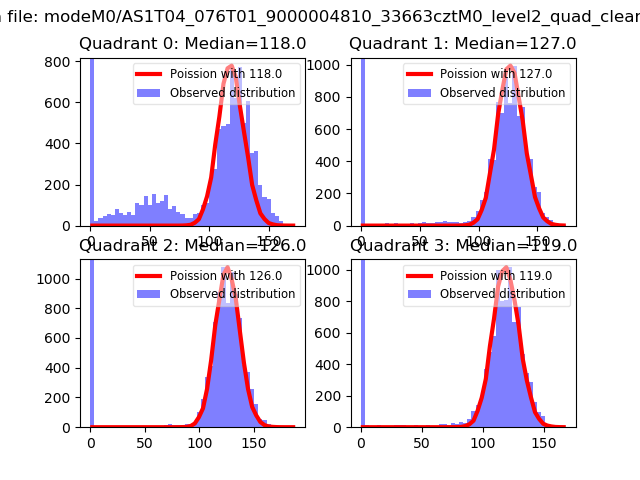 |
 |
| Quadrant-wise count rates Data is divided into 100 sec bins |
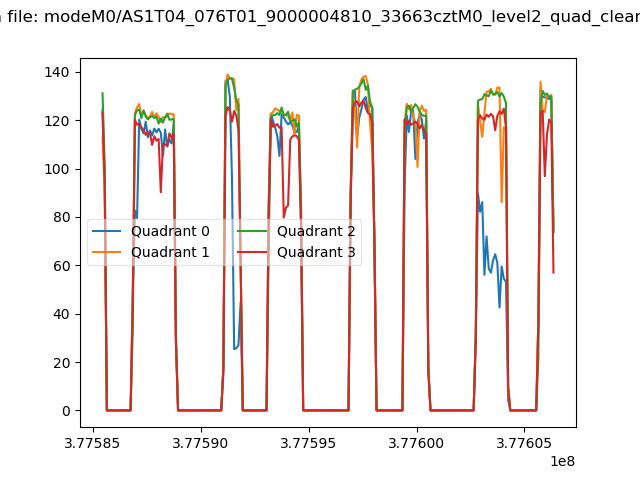 |
|
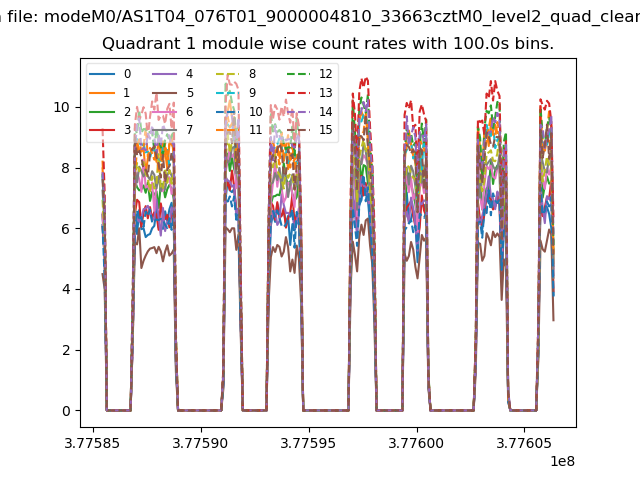
| Module-wise count rates for Quadrant A Data is divided into 100 sec bins |
 |
 |
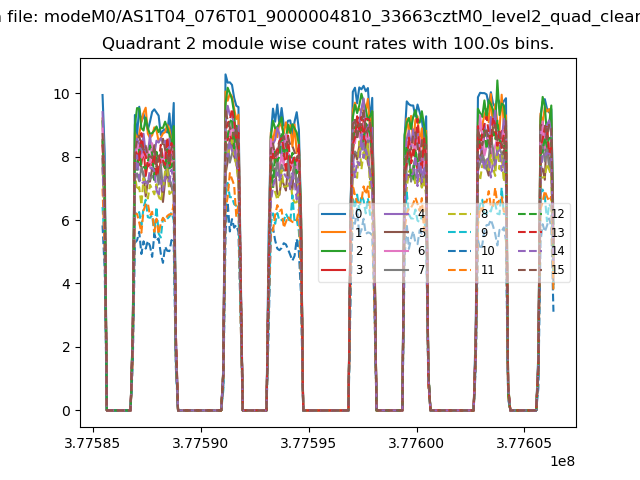
| Module-wise count rates for Quadrant B Data is divided into 100 sec bins |
 |
 |
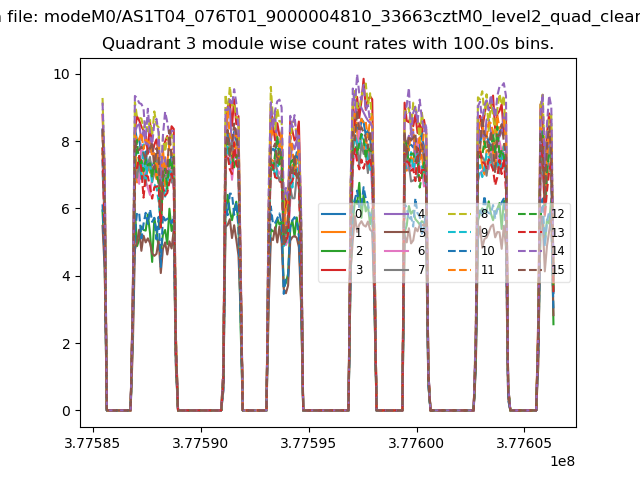
| Module-wise count rates for Quadrant C Data is divided into 100 sec bins |
 |
 |
| Module-wise count rates for Quadrant D Data is divided into 100 sec bins |
 |
 |
| Parameter | Plot |
|---|---|
| CZT HV Monitor |  |
| D_VDD | 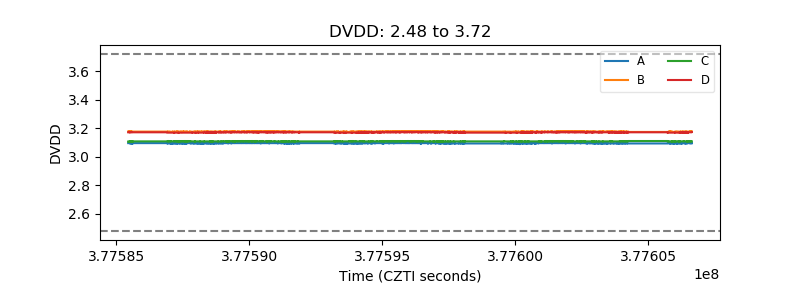 |
| Temperature 1 | 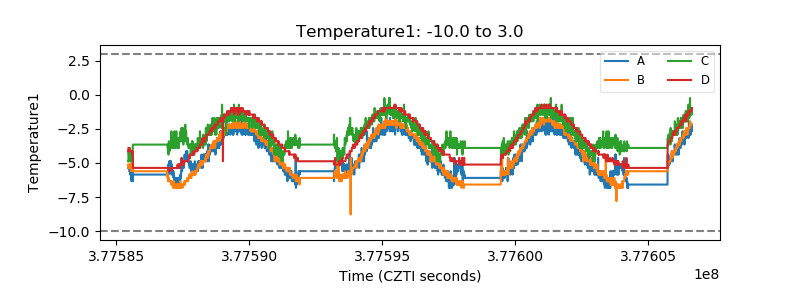 |
| Veto HV Monitor | 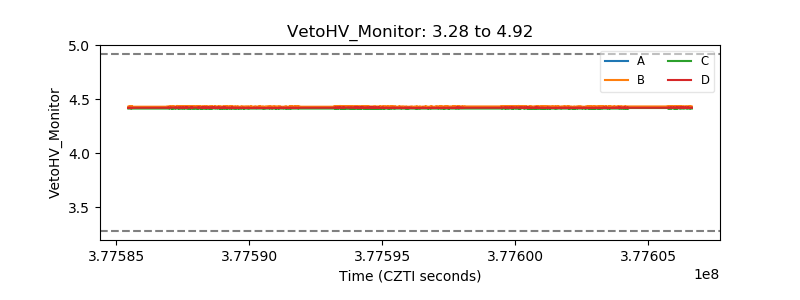 |
| Veto LLD |  |
| Alpha Counter | 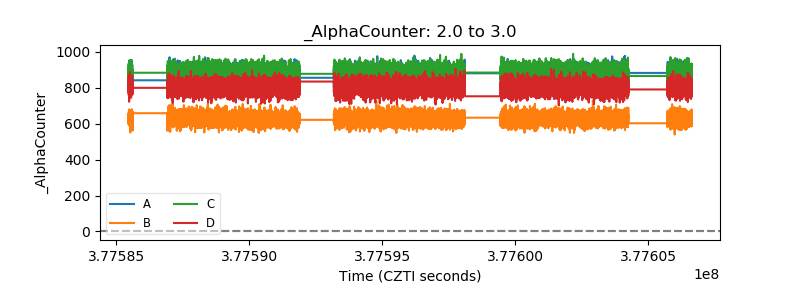 |
| _CPM_Rate | 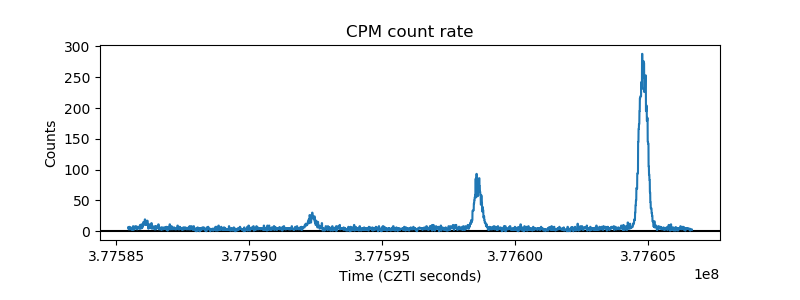 |
| CZT Counter | 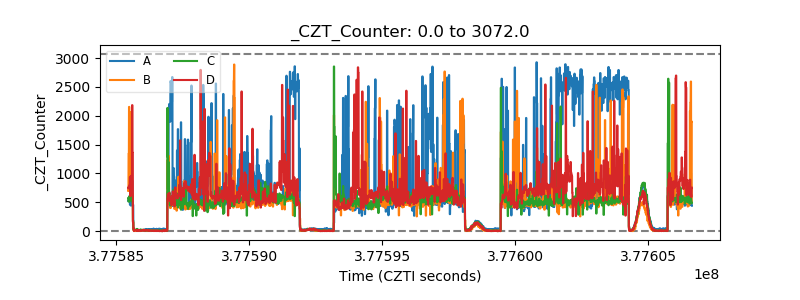 |
| +2.5 Volts monitor |  |
| +5 Volts monitor |  |
| _ROLL_ROT |  |
| _Roll_DEC | 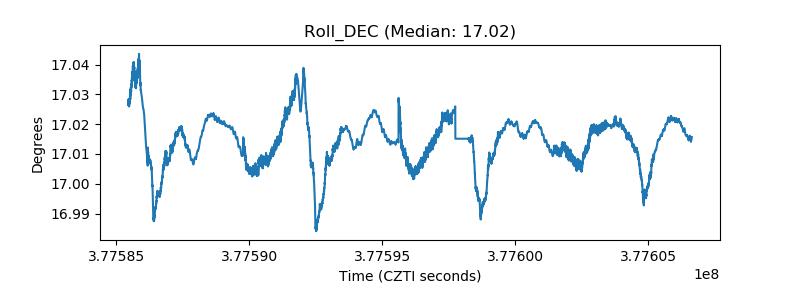 |
| _Roll_RA | 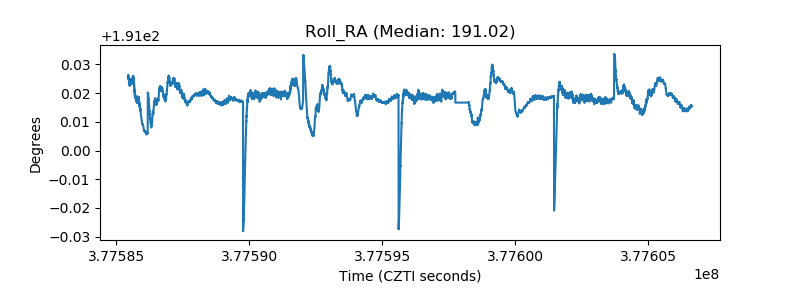 |
| Veto Counter |  |