| Param | Original file | Final file |
|---|---|---|
| Filename | modeM0/AS1T04_076T01_9000004810_33664cztM0_level2.evt | modeM0/AS1T04_076T01_9000004810_33664cztM0_level2_quad_clean.evt |
| Size (bytes) | 513,120,960 | 57,504,960 |
| Size | 489.4 MB | 54.8 MB |
| Events in quadrant A | 3,989,072 | 319,566 |
| Events in quadrant B | 3,401,338 | 349,793 |
| Events in quadrant C | 3,237,386 | 347,635 |
| Events in quadrant D | 4,527,743 | 327,240 |
| Mode SS | |||
|---|---|---|---|
| Quadrant | BADHDUFLAG | Total packets | Discarded packets |
| A | 0 | 116 | 0 |
| B | 0 | 116 | 0 |
| C | 0 | 116 | 0 |
| D | 0 | 116 | 0 |
| Mode M9 | |||
|---|---|---|---|
| Quadrant | BADHDUFLAG | Total packets | Discarded packets |
| A | 0 | 23 | 0 |
| B | 0 | 23 | 0 |
| C | 0 | 23 | 0 |
| D | 0 | 24 | 0 |
| Mode M0 | |||
|---|---|---|---|
| Quadrant | BADHDUFLAG | Total packets | Discarded packets |
| A | 0 | 15353 | 3 |
| B | 0 | 13550 | 2 |
| C | 0 | 12648 | 2 |
| D | 0 | 17560 | 2 |
| Quadrant | Total seconds | Saturated seconds | Saturation percentage |
|---|---|---|---|
| A | 5667 | 413 | 7.287807% |
| B | 5667 | 191 | 3.370390% |
| C | 5667 | 72 | 1.270513% |
| D | 5667 | 276 | 4.870302% |
Noise dominated data is calculated using 1-second bins in cleaned event files. If a bin has >2000 counts, and if more than 50% of those come from <1% of pixels, then it is considered to be noise-dominated and hence unusable.
| Quadrant | # 1 sec bins | Bins with >0 counts | Bins with >2000 counts | High rate bins dominated by noise | Noise dominated (total time) | Noise dominated (detector-on time) | Marked lightcurve |
|---|---|---|---|---|---|---|---|
| A | 7251 | 5668 | 351 | 351 | 4.84% | 6.19% | 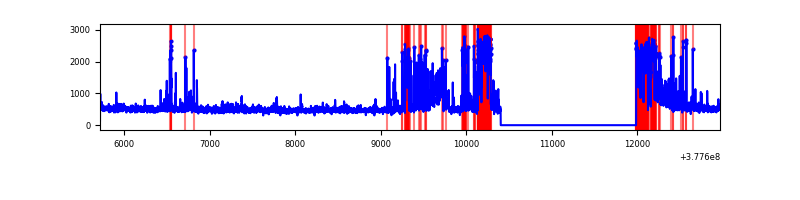 |
| B | 7251 | 5668 | 151 | 151 | 2.08% | 2.66% | 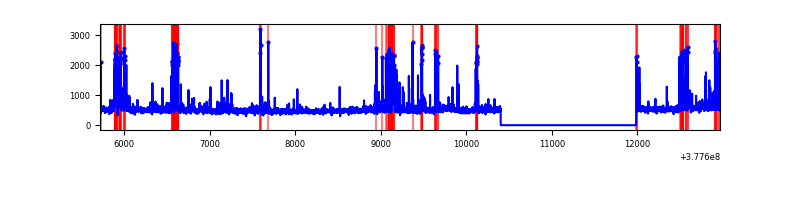 |
| C | 7251 | 5668 | 60 | 60 | 0.83% | 1.06% | 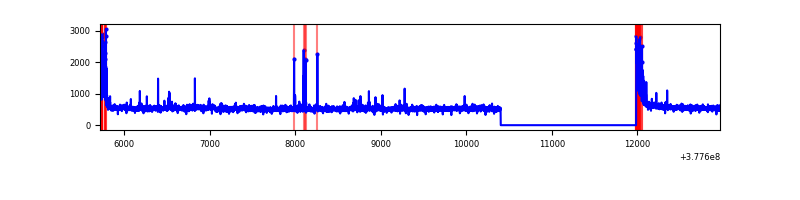 |
| D | 7251 | 5668 | 244 | 244 | 3.37% | 4.30% | 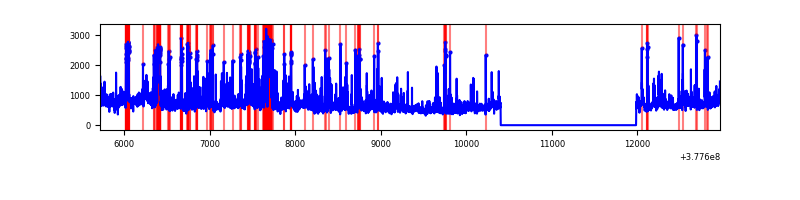 |
Top three noisy pixels from each quadrant. If the there are fewer than three noisy pixels in the level2.evt file, extra rows are filled as -1
| Pixel properties | Quadrant properties | ||||||
|---|---|---|---|---|---|---|---|
| Quadrant | DetID | PixID | Counts | Sigma | Mean | Median | Sigma |
| A | 15 | 169 | 1169986 | 8827.93 | 660 | 647 | 132.5 |
| A | 15 | 237 | 244080 | 1837.8 | 660 | 647 | 132.5 |
| A | 9 | 143 | 10717 | 76.02 | 660 | 647 | 132.5 |
| B | 5 | 172 | 580269 | 4489.46 | 672 | 655 | 129.1 |
| B | 0 | 219 | 44465 | 339.33 | 672 | 655 | 129.1 |
| B | 5 | 255 | 33394 | 253.58 | 672 | 655 | 129.1 |
| C | 15 | 214 | 264416 | 1694.23 | 665 | 671 | 155.7 |
| C | 0 | 10 | 222792 | 1426.85 | 665 | 671 | 155.7 |
| C | 3 | 233 | 85704 | 546.23 | 665 | 671 | 155.7 |
| D | 8 | 195 | 732548 | 4463.53 | 653 | 633 | 164.0 |
| D | 2 | 249 | 383665 | 2335.89 | 653 | 633 | 164.0 |
| D | 7 | 80 | 227481 | 1383.42 | 653 | 633 | 164.0 |
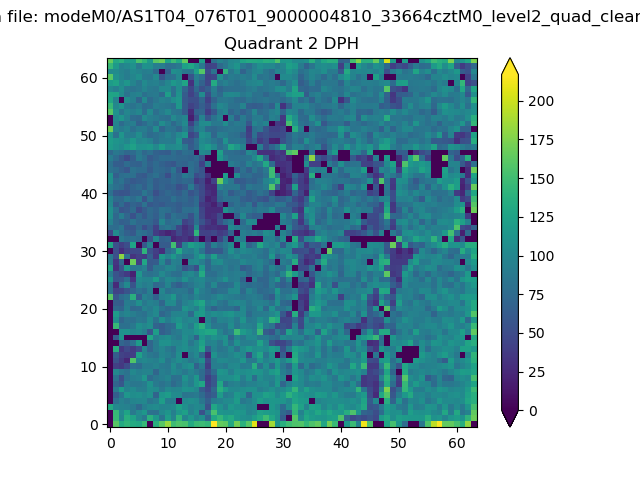
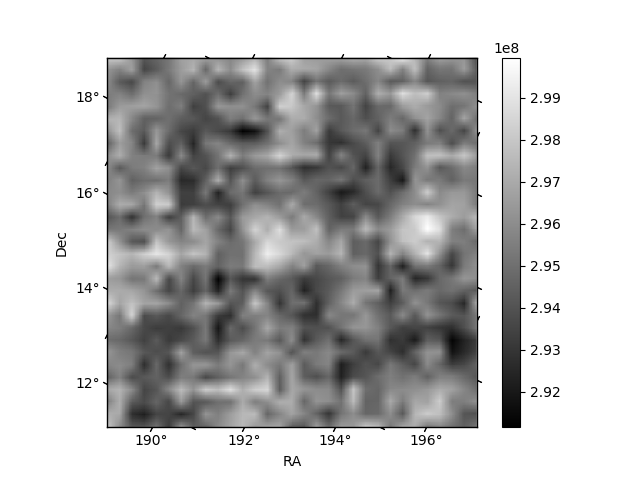
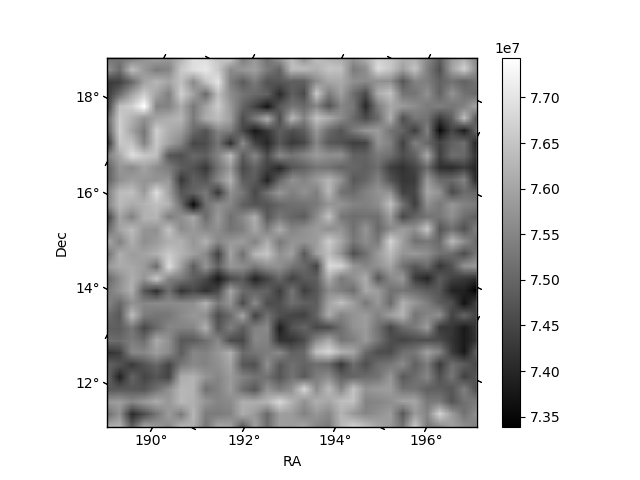
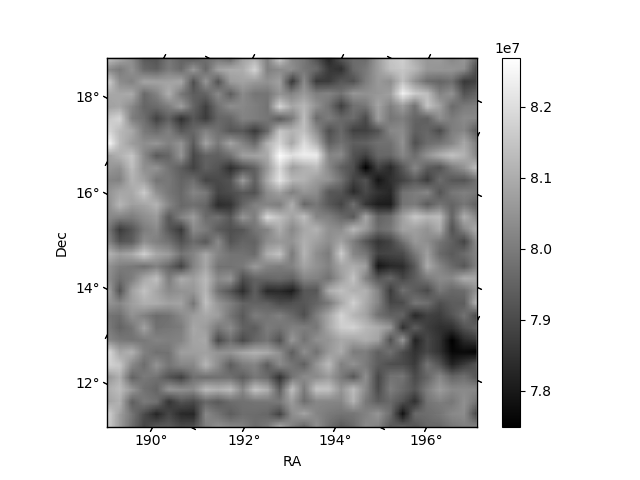
Histogram calculated using DETX and DETY for each event in the final _common_clean file
| Quadrant A | 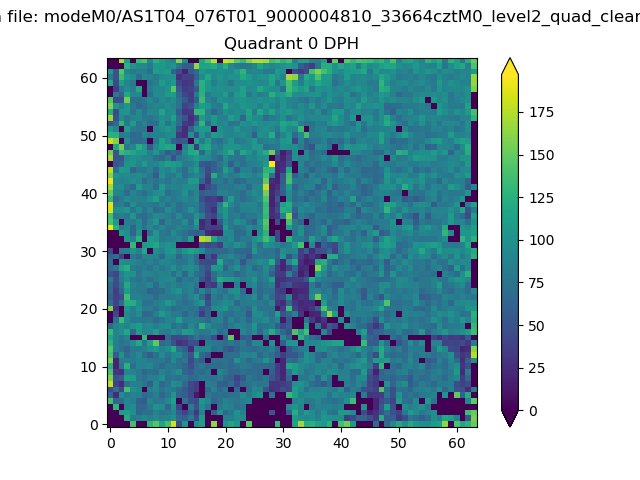 |
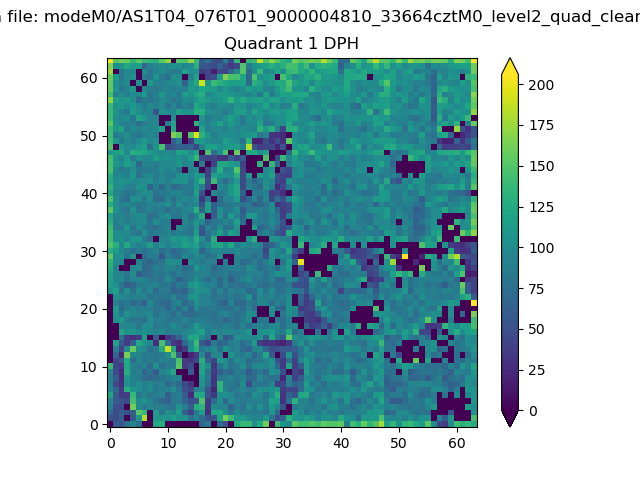 |
Quadrant B |
|---|---|---|---|
| Quadrant D | 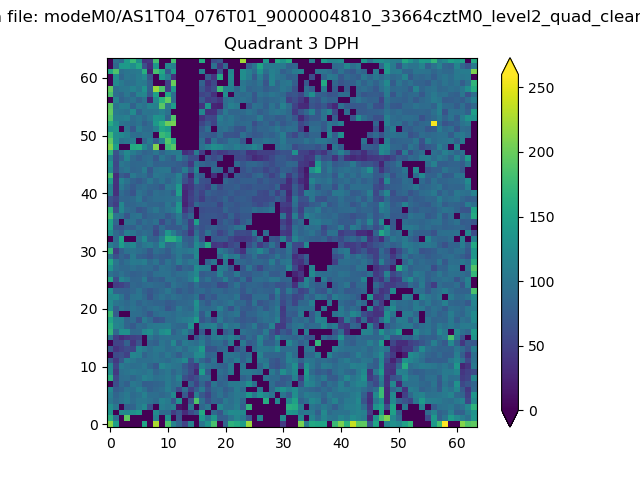 |
 |
Quadrant C |
| Plot type | Count rate plots | Images |
|---|---|---|
| Comparison with Poisson distribution Blue bars denote a histogram of data divided into 1 sec bins. Red curve is a Poisson curve with rate = median count rate of data. |
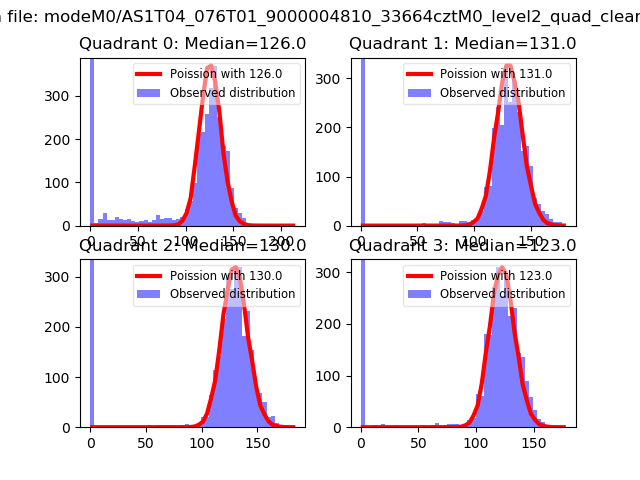 |
 |
| Quadrant-wise count rates Data is divided into 100 sec bins |
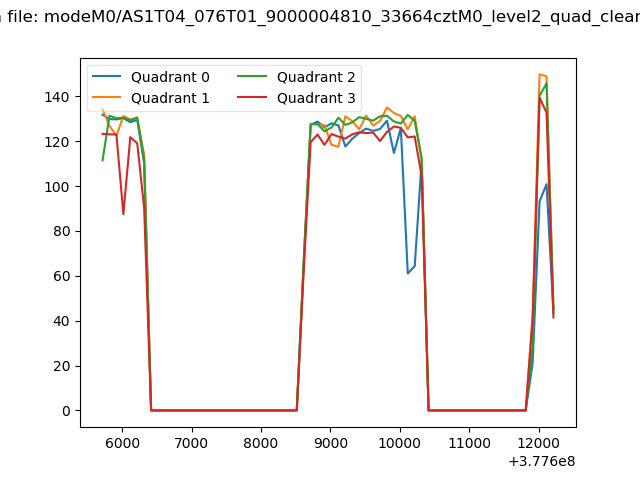 |
|
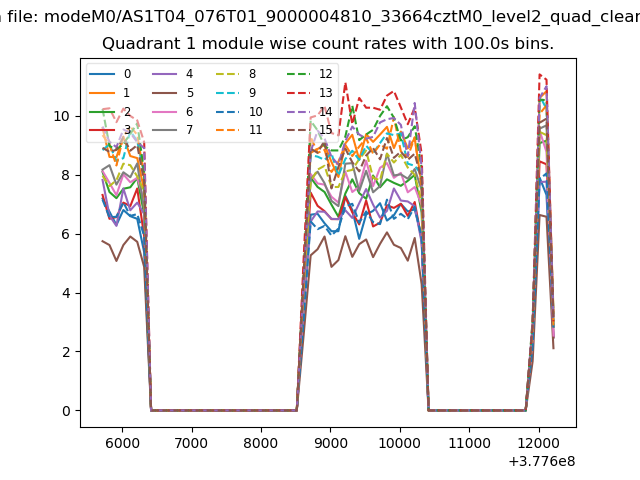
| Module-wise count rates for Quadrant A Data is divided into 100 sec bins |
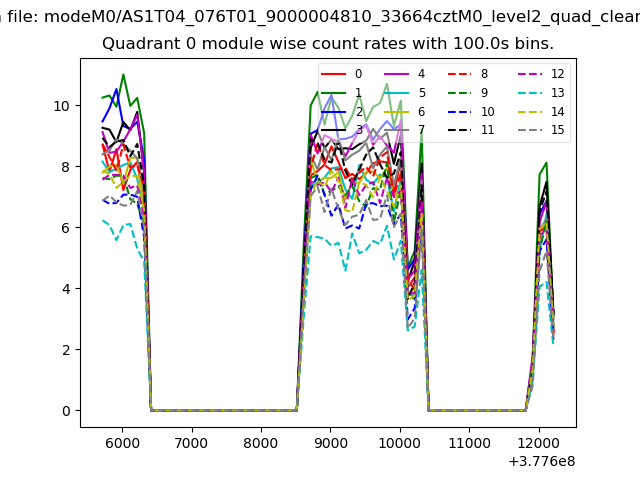 |
 |
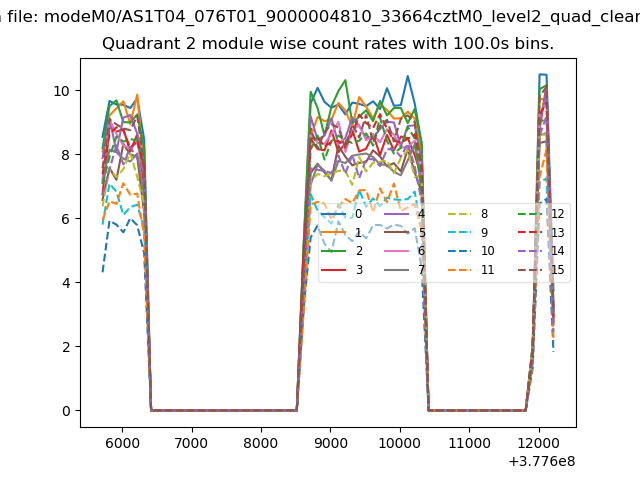
| Module-wise count rates for Quadrant B Data is divided into 100 sec bins |
 |
 |
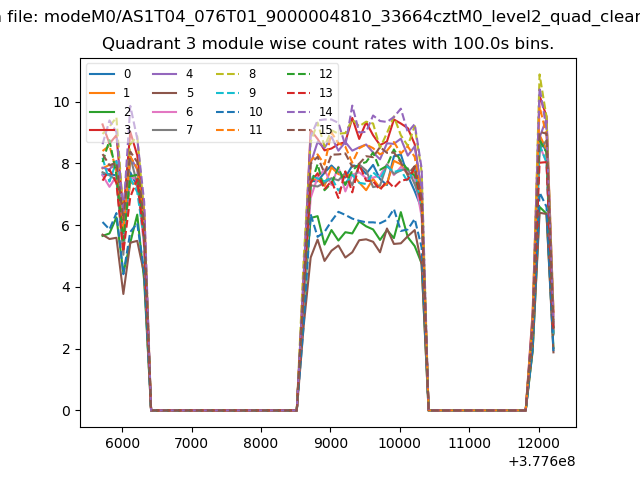
| Module-wise count rates for Quadrant C Data is divided into 100 sec bins |
 |
 |
| Module-wise count rates for Quadrant D Data is divided into 100 sec bins |
 |
 |
| Parameter | Plot |
|---|---|
| CZT HV Monitor | 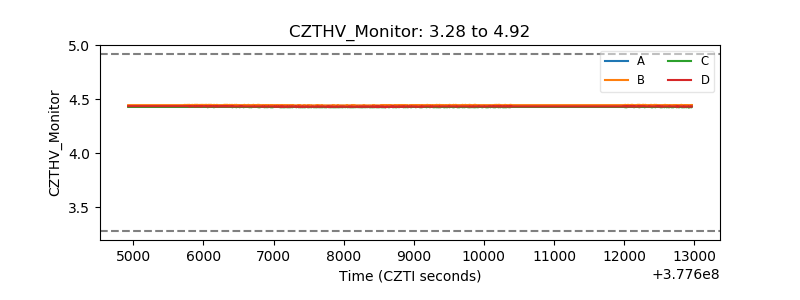 |
| D_VDD | 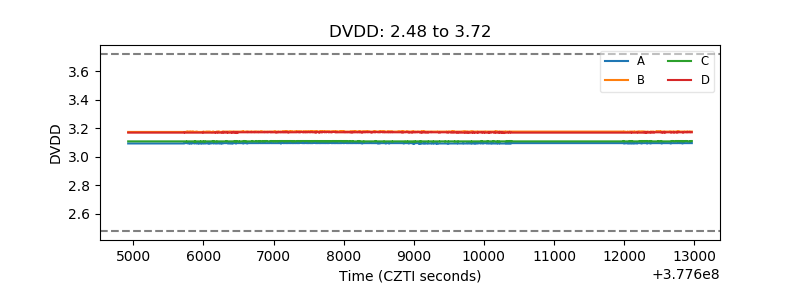 |
| Temperature 1 | 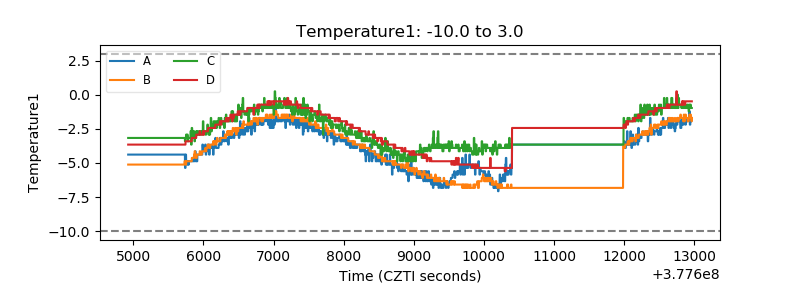 |
| Veto HV Monitor | 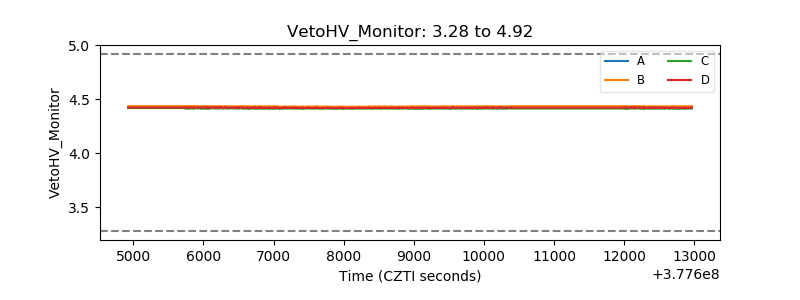 |
| Veto LLD | 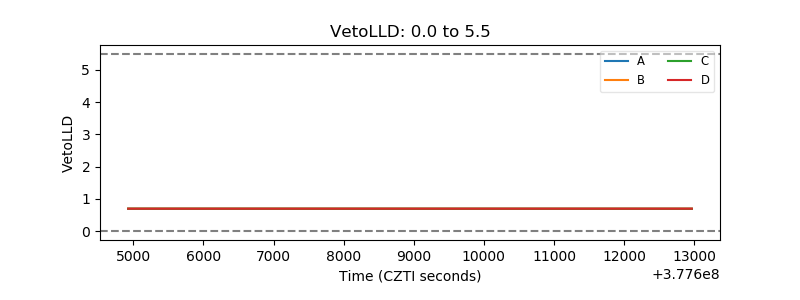 |
| Alpha Counter | 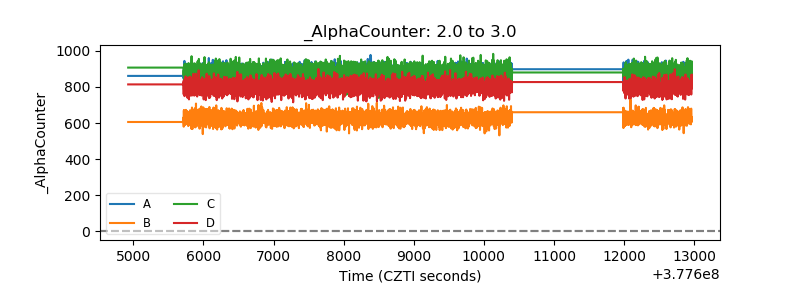 |
| _CPM_Rate | 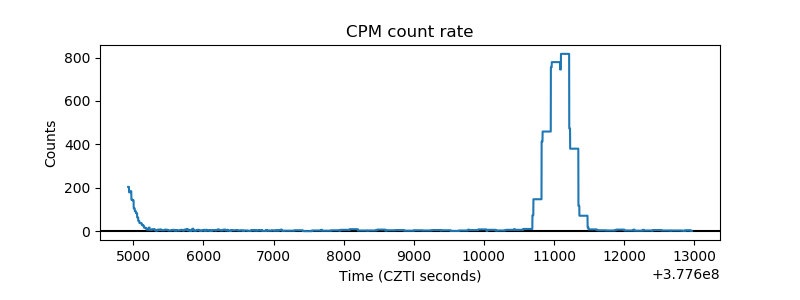 |
| CZT Counter | 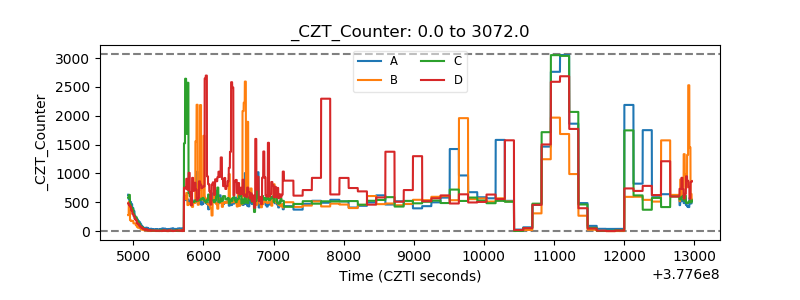 |
| +2.5 Volts monitor |  |
| +5 Volts monitor |  |
| _ROLL_ROT | 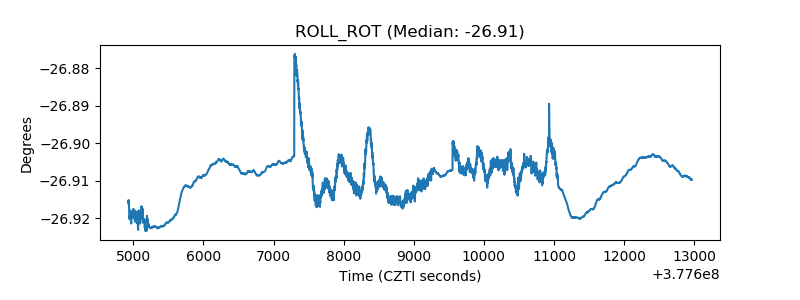 |
| _Roll_DEC |  |
| _Roll_RA | 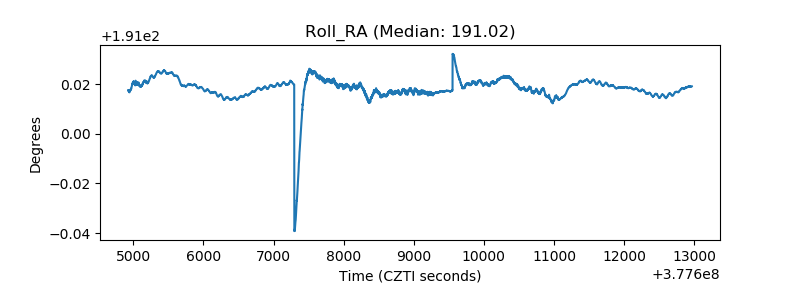 |
| Veto Counter | 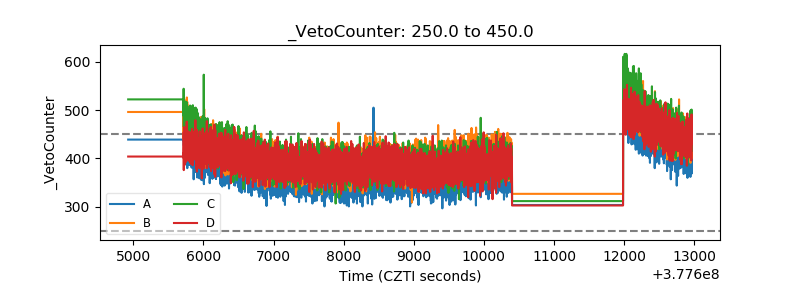 |