| Param | Original file | Final file |
|---|---|---|
| Filename | modeM0/AS1T04_076T01_9000004810_33666cztM0_level2.evt | modeM0/AS1T04_076T01_9000004810_33666cztM0_level2_quad_clean.evt |
| Size (bytes) | 678,470,400 | 47,721,600 |
| Size | 647.0 MB | 45.5 MB |
| Events in quadrant A | 9,598,820 | 183,199 |
| Events in quadrant B | 3,432,054 | 296,542 |
| Events in quadrant C | 3,242,756 | 298,965 |
| Events in quadrant D | 3,906,560 | 284,690 |
| Mode SS | |||
|---|---|---|---|
| Quadrant | BADHDUFLAG | Total packets | Discarded packets |
| A | 0 | 110 | 0 |
| B | 0 | 110 | 0 |
| C | 0 | 110 | 0 |
| D | 0 | 110 | 0 |
| Mode M9 | |||
|---|---|---|---|
| Quadrant | BADHDUFLAG | Total packets | Discarded packets |
| A | 0 | 23 | 0 |
| B | 0 | 23 | 0 |
| C | 0 | 23 | 0 |
| D | 0 | 24 | 0 |
| Mode M0 | |||
|---|---|---|---|
| Quadrant | BADHDUFLAG | Total packets | Discarded packets |
| A | 0 | 32168 | 3 |
| B | 0 | 13581 | 2 |
| C | 0 | 12819 | 2 |
| D | 0 | 15438 | 2 |
| Quadrant | Total seconds | Saturated seconds | Saturation percentage |
|---|---|---|---|
| A | 5433 | 3085 | 56.782625% |
| B | 5433 | 266 | 4.896006% |
| C | 5433 | 80 | 1.472483% |
| D | 5433 | 110 | 2.024664% |
Noise dominated data is calculated using 1-second bins in cleaned event files. If a bin has >2000 counts, and if more than 50% of those come from <1% of pixels, then it is considered to be noise-dominated and hence unusable.
| Quadrant | # 1 sec bins | Bins with >0 counts | Bins with >2000 counts | High rate bins dominated by noise | Noise dominated (total time) | Noise dominated (detector-on time) | Marked lightcurve |
|---|---|---|---|---|---|---|---|
| A | 7166 | 5433 | 2890 | 2890 | 40.33% | 53.19% | 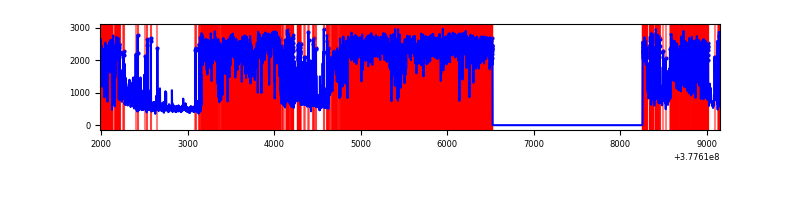 |
| B | 7166 | 5434 | 212 | 212 | 2.96% | 3.90% | 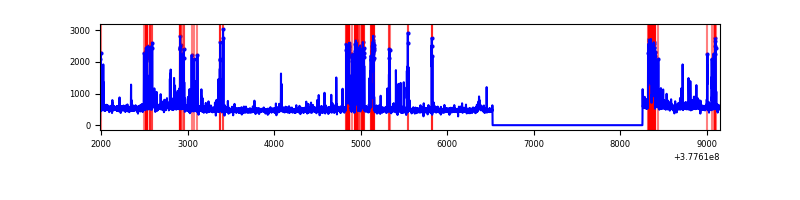 |
| C | 7166 | 5434 | 60 | 60 | 0.84% | 1.10% | 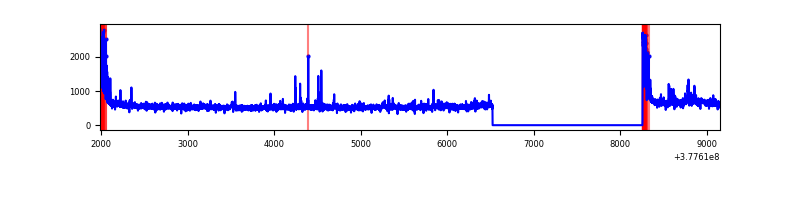 |
| D | 7166 | 5434 | 79 | 79 | 1.10% | 1.45% | 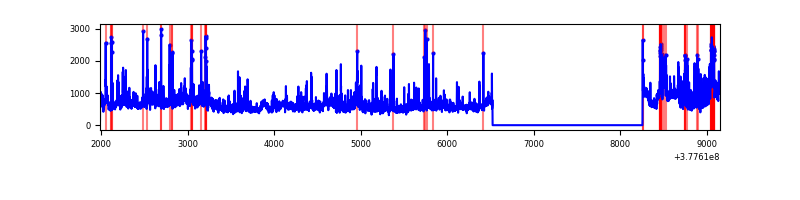 |
Top three noisy pixels from each quadrant. If the there are fewer than three noisy pixels in the level2.evt file, extra rows are filled as -1
| Pixel properties | Quadrant properties | ||||||
|---|---|---|---|---|---|---|---|
| Quadrant | DetID | PixID | Counts | Sigma | Mean | Median | Sigma |
| A | 15 | 169 | 7431339 | 71517.07 | 512 | 501 | 103.9 |
| A | 15 | 237 | 169168 | 1623.31 | 512 | 501 | 103.9 |
| A | 13 | 6 | 9254 | 84.24 | 512 | 501 | 103.9 |
| B | 5 | 172 | 674258 | 5343.98 | 659 | 644 | 126.1 |
| B | 5 | 255 | 35745 | 278.47 | 659 | 644 | 126.1 |
| B | 5 | 200 | 29168 | 226.29 | 659 | 644 | 126.1 |
| C | 15 | 214 | 252521 | 1643.48 | 658 | 665 | 153.2 |
| C | 0 | 10 | 234996 | 1529.13 | 658 | 665 | 153.2 |
| C | 3 | 233 | 152235 | 989.07 | 658 | 665 | 153.2 |
| D | 8 | 195 | 610230 | 3411.86 | 652 | 639 | 178.7 |
| D | 2 | 250 | 177257 | 988.52 | 652 | 639 | 178.7 |
| D | 10 | 118 | 129749 | 722.62 | 652 | 639 | 178.7 |
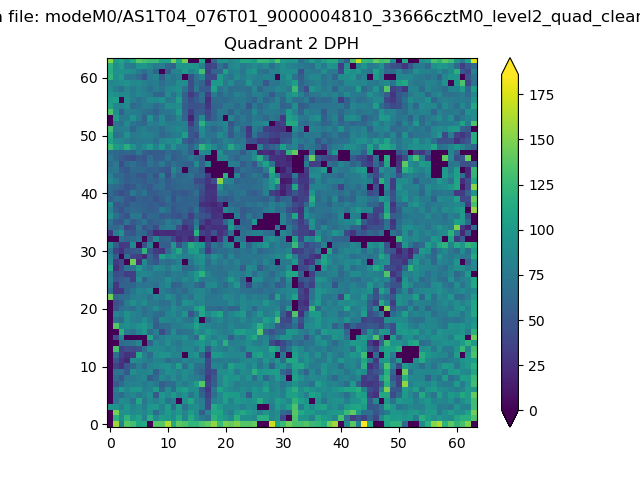
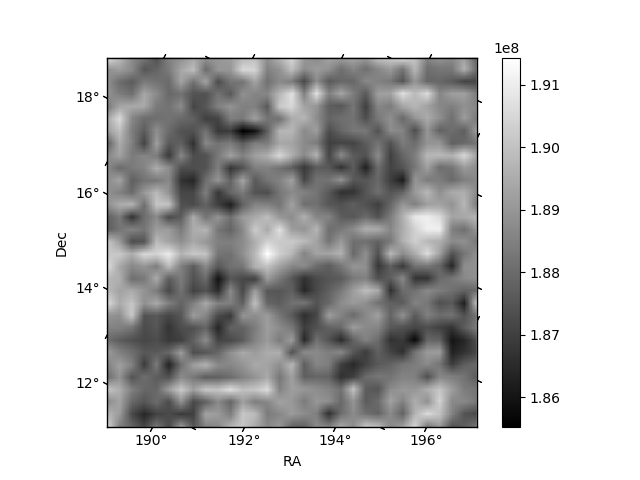
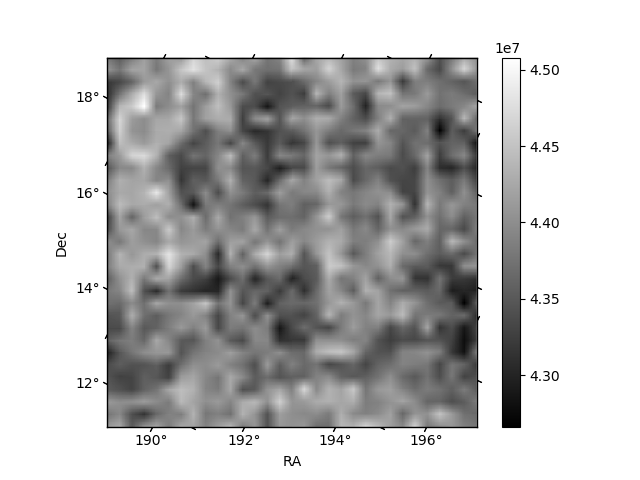
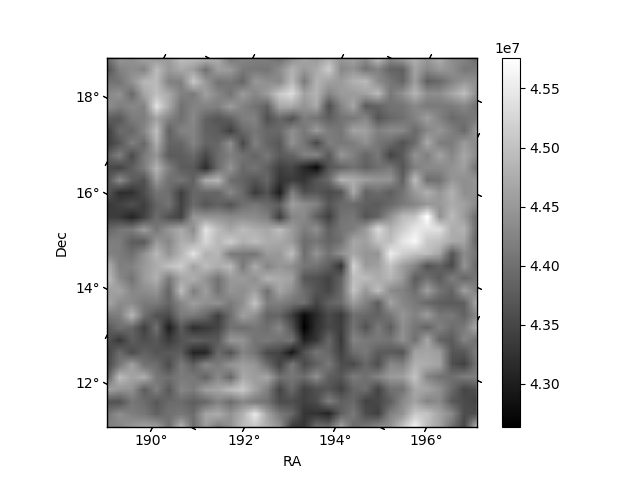
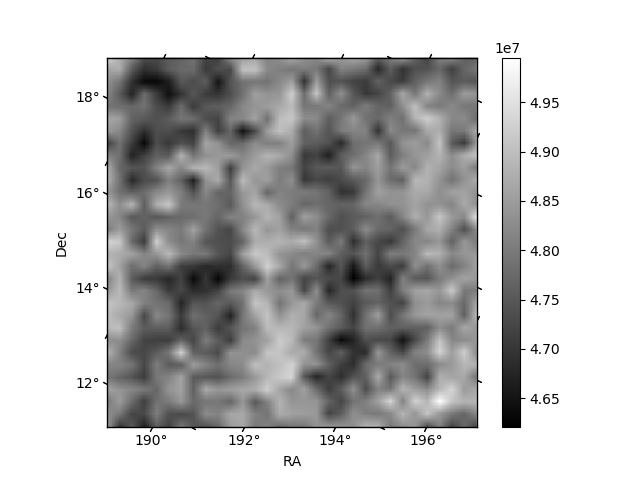
Histogram calculated using DETX and DETY for each event in the final _common_clean file
| Quadrant A | 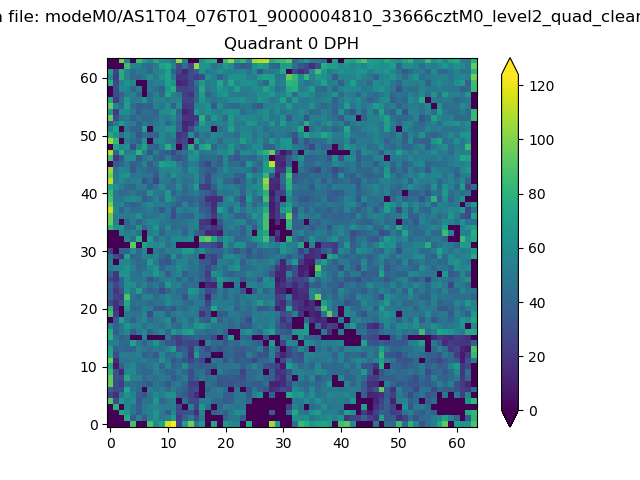 |
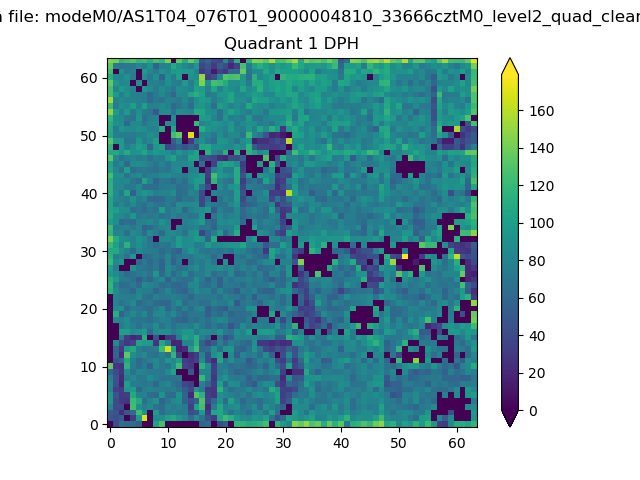 |
Quadrant B |
|---|---|---|---|
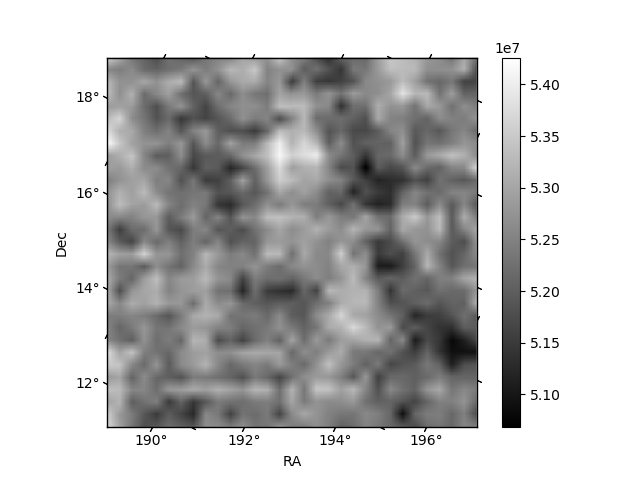
| Quadrant D | 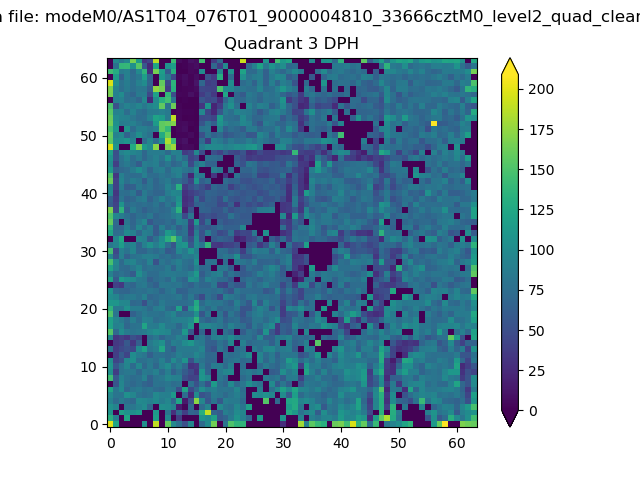 |
 |
Quadrant C |
| Plot type | Count rate plots | Images |
|---|---|---|
| Comparison with Poisson distribution Blue bars denote a histogram of data divided into 1 sec bins. Red curve is a Poisson curve with rate = median count rate of data. |
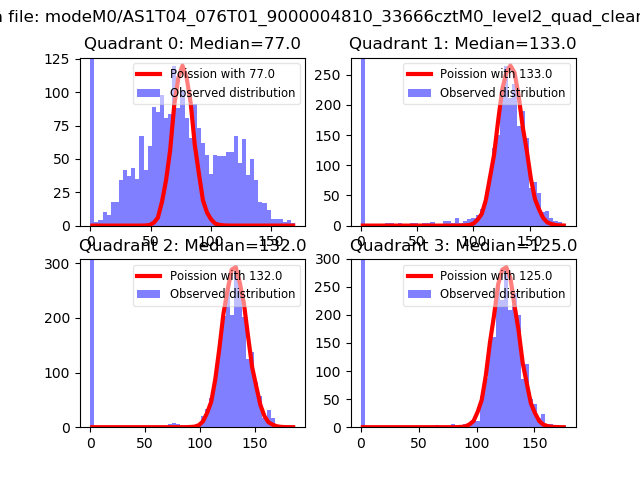 |
 |
| Quadrant-wise count rates Data is divided into 100 sec bins |
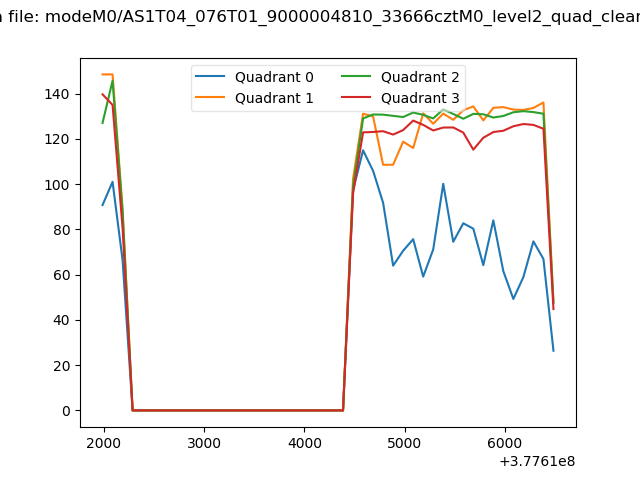 |
|
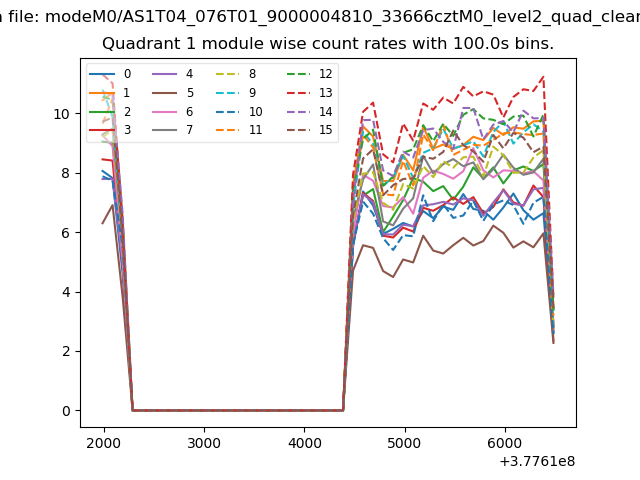
| Module-wise count rates for Quadrant A Data is divided into 100 sec bins |
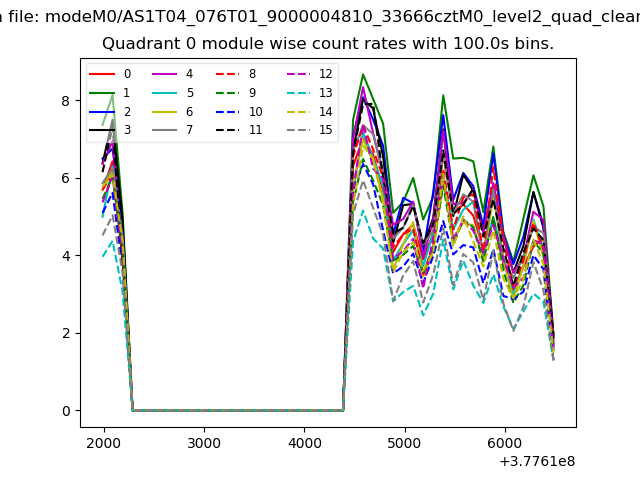 |
 |
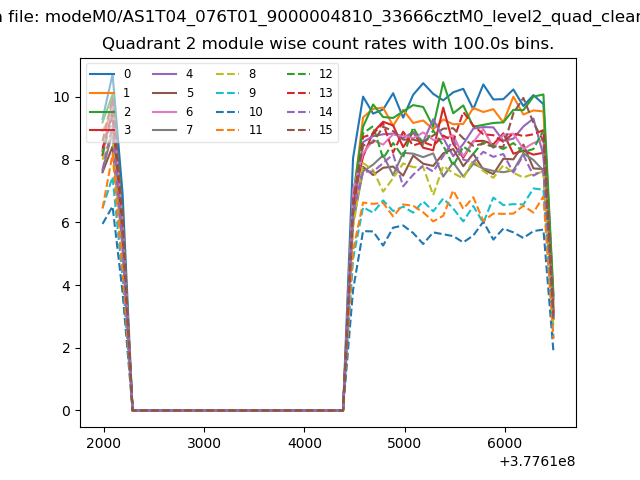
| Module-wise count rates for Quadrant B Data is divided into 100 sec bins |
 |
 |
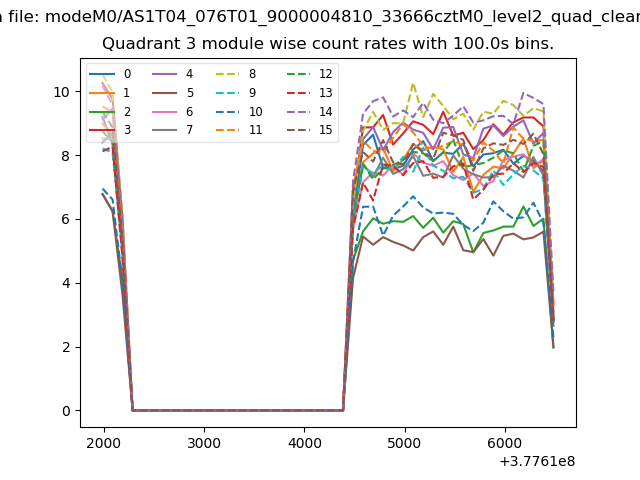
| Module-wise count rates for Quadrant C Data is divided into 100 sec bins |
 |
 |
| Module-wise count rates for Quadrant D Data is divided into 100 sec bins |
 |
 |
| Parameter | Plot |
|---|---|
| CZT HV Monitor | 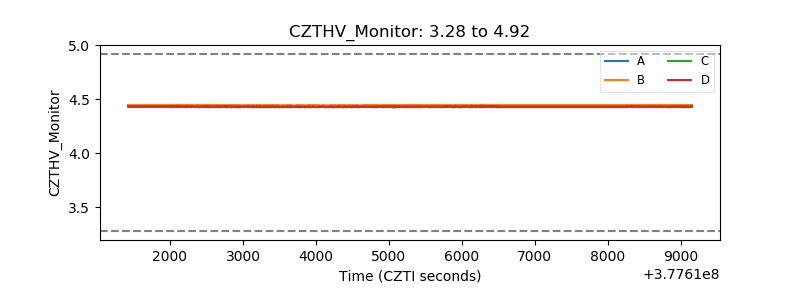 |
| D_VDD | 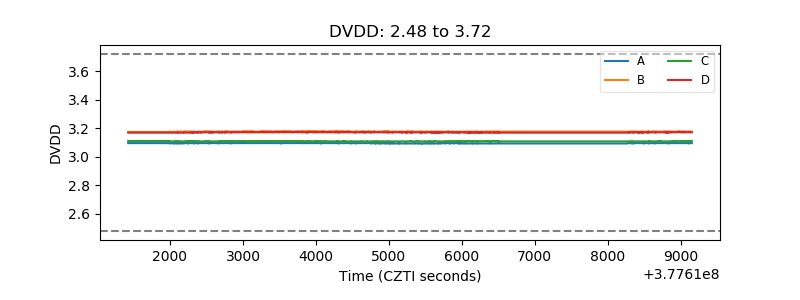 |
| Temperature 1 | 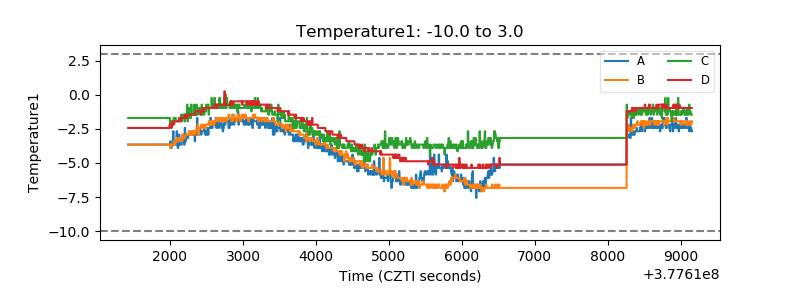 |
| Veto HV Monitor | 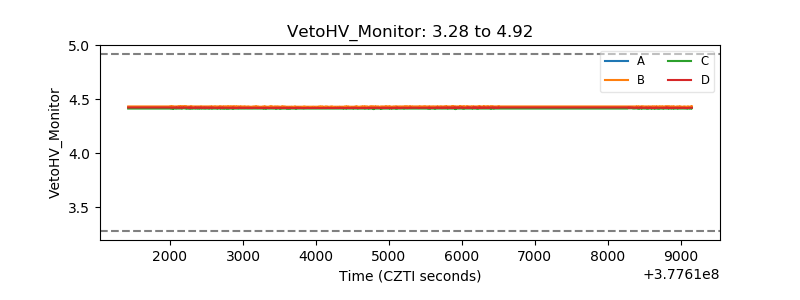 |
| Veto LLD | 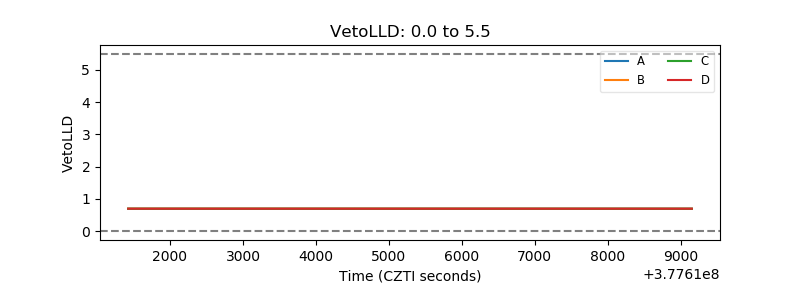 |
| Alpha Counter | 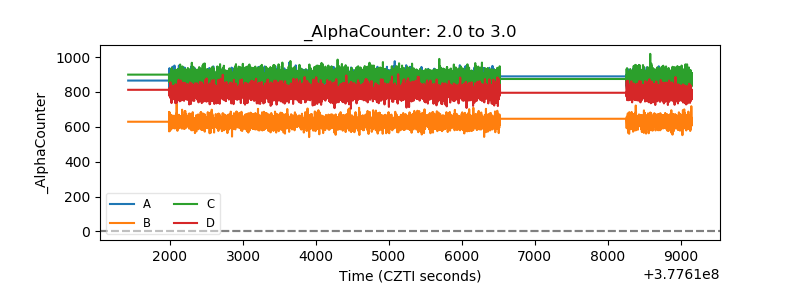 |
| _CPM_Rate | 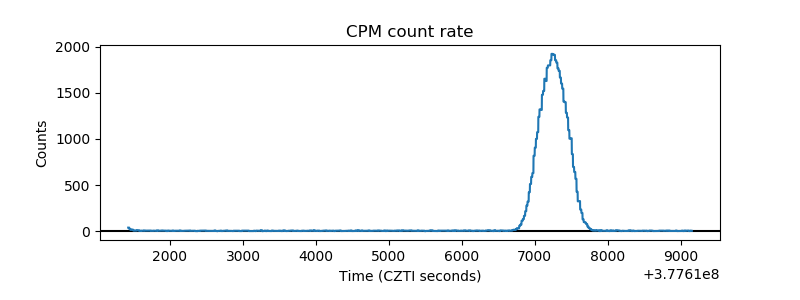 |
| CZT Counter | 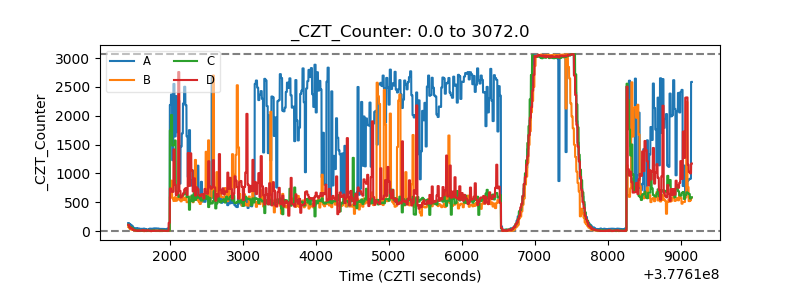 |
| +2.5 Volts monitor | 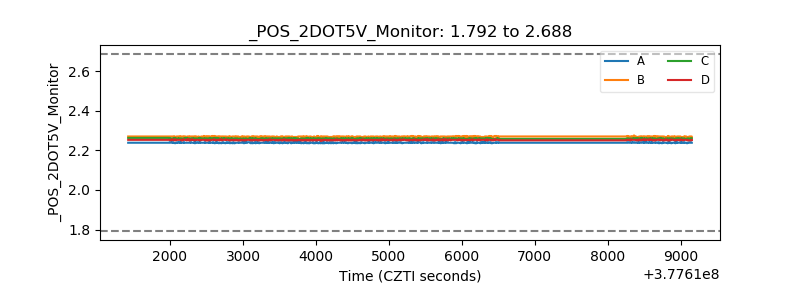 |
| +5 Volts monitor | 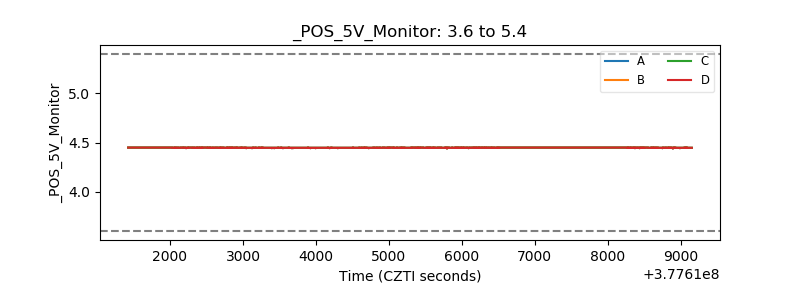 |
| _ROLL_ROT | 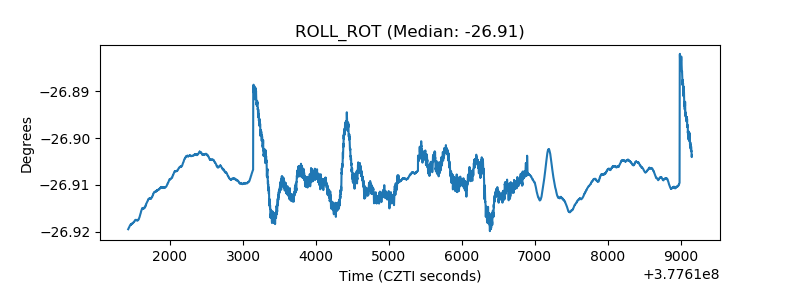 |
| _Roll_DEC | 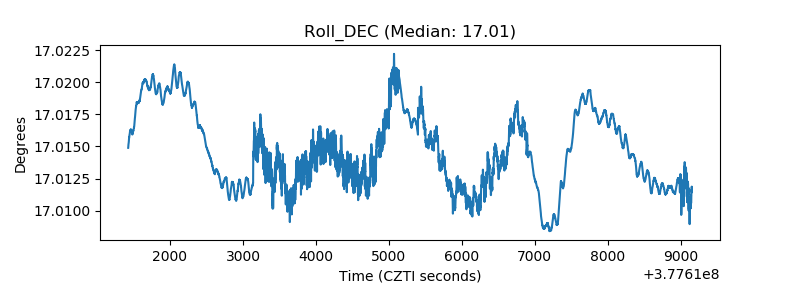 |
| _Roll_RA | 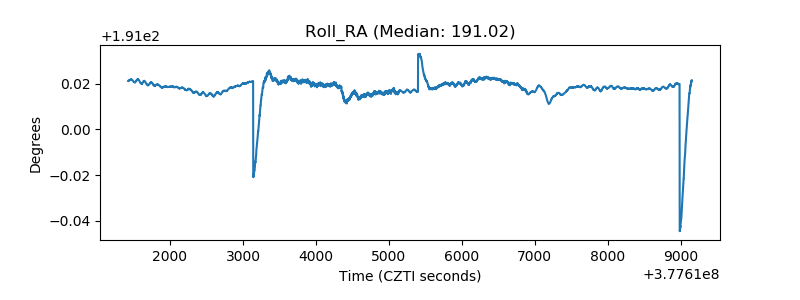 |
| Veto Counter | 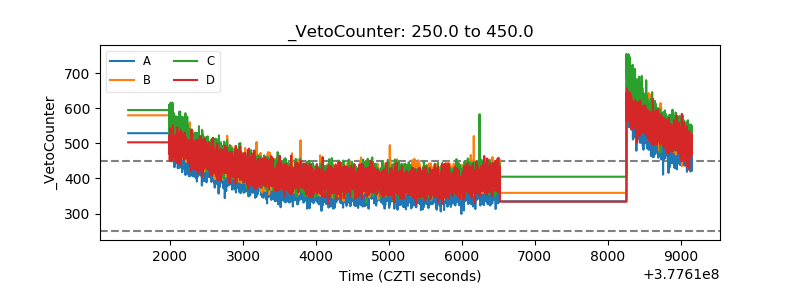 |