| Param | Original file | Final file |
|---|---|---|
| Filename | modeM0/AS1T04_076T01_9000004810_33667cztM0_level2.evt | modeM0/AS1T04_076T01_9000004810_33667cztM0_level2_quad_clean.evt |
| Size (bytes) | 618,373,440 | 53,343,360 |
| Size | 589.7 MB | 50.9 MB |
| Events in quadrant A | 6,124,928 | 301,098 |
| Events in quadrant B | 3,607,679 | 308,338 |
| Events in quadrant C | 3,563,776 | 318,532 |
| Events in quadrant D | 5,056,013 | 297,903 |
| Mode SS | |||
|---|---|---|---|
| Quadrant | BADHDUFLAG | Total packets | Discarded packets |
| A | 0 | 112 | 0 |
| B | 0 | 112 | 0 |
| C | 0 | 112 | 0 |
| D | 0 | 112 | 0 |
| Mode M9 | |||
|---|---|---|---|
| Quadrant | BADHDUFLAG | Total packets | Discarded packets |
| A | 0 | 28 | 0 |
| B | 0 | 28 | 0 |
| C | 0 | 28 | 0 |
| D | 0 | 29 | 0 |
| Mode M0 | |||
|---|---|---|---|
| Quadrant | BADHDUFLAG | Total packets | Discarded packets |
| A | 0 | 21996 | 2 |
| B | 0 | 14204 | 1 |
| C | 0 | 14367 | 1 |
| D | 0 | 19037 | 1 |
| Quadrant | Total seconds | Saturated seconds | Saturation percentage |
|---|---|---|---|
| A | 5560 | 980 | 17.625899% |
| B | 5560 | 260 | 4.676259% |
| C | 5560 | 93 | 1.672662% |
| D | 5560 | 193 | 3.471223% |
Noise dominated data is calculated using 1-second bins in cleaned event files. If a bin has >2000 counts, and if more than 50% of those come from <1% of pixels, then it is considered to be noise-dominated and hence unusable.
| Quadrant | # 1 sec bins | Bins with >0 counts | Bins with >2000 counts | High rate bins dominated by noise | Noise dominated (total time) | Noise dominated (detector-on time) | Marked lightcurve |
|---|---|---|---|---|---|---|---|
| A | 7413 | 5561 | 832 | 832 | 11.22% | 14.96% | 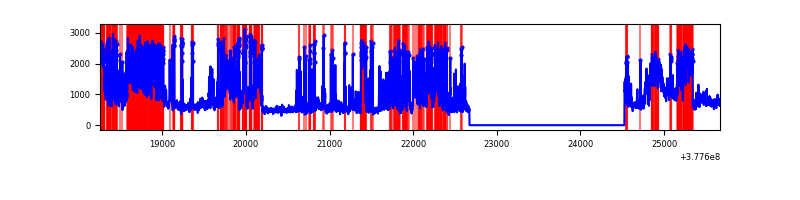 |
| B | 7413 | 5561 | 200 | 200 | 2.70% | 3.60% | 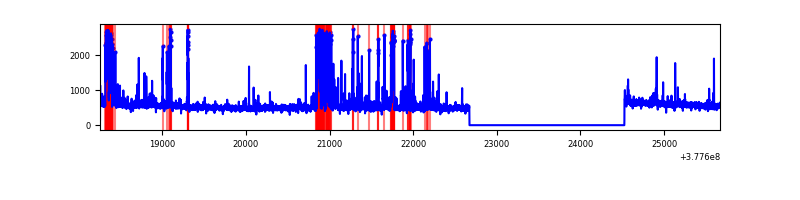 |
| C | 7413 | 5561 | 80 | 80 | 1.08% | 1.44% | 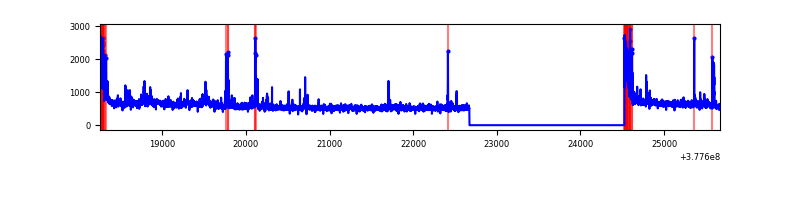 |
| D | 7413 | 5561 | 174 | 174 | 2.35% | 3.13% | 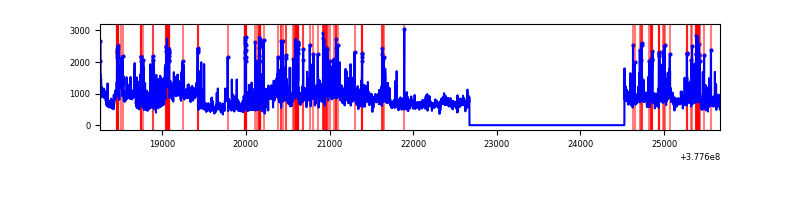 |
Top three noisy pixels from each quadrant. If the there are fewer than three noisy pixels in the level2.evt file, extra rows are filled as -1
| Pixel properties | Quadrant properties | ||||||
|---|---|---|---|---|---|---|---|
| Quadrant | DetID | PixID | Counts | Sigma | Mean | Median | Sigma |
| A | 15 | 169 | 3245108 | 24300.84 | 667 | 655 | 133.5 |
| A | 15 | 237 | 278940 | 2084.34 | 667 | 655 | 133.5 |
| A | 13 | 6 | 11383 | 80.35 | 667 | 655 | 133.5 |
| B | 5 | 172 | 619215 | 4659.68 | 708 | 690 | 132.7 |
| B | 5 | 255 | 65749 | 490.12 | 708 | 690 | 132.7 |
| B | 15 | 85 | 39911 | 295.47 | 708 | 690 | 132.7 |
| C | 0 | 10 | 272899 | 1675.45 | 707 | 714 | 162.5 |
| C | 3 | 233 | 263172 | 1615.57 | 707 | 714 | 162.5 |
| C | 15 | 214 | 256740 | 1575.98 | 707 | 714 | 162.5 |
| D | 8 | 195 | 1377782 | 7236.35 | 697 | 685 | 190.3 |
| D | 2 | 250 | 224559 | 1176.41 | 697 | 685 | 190.3 |
| D | 2 | 249 | 191786 | 1004.2 | 697 | 685 | 190.3 |
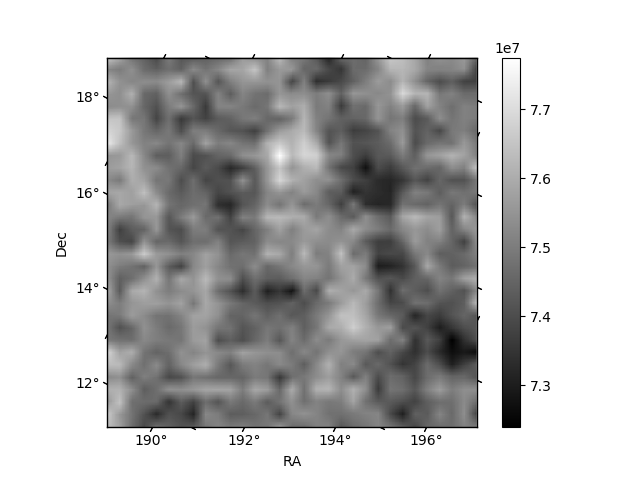
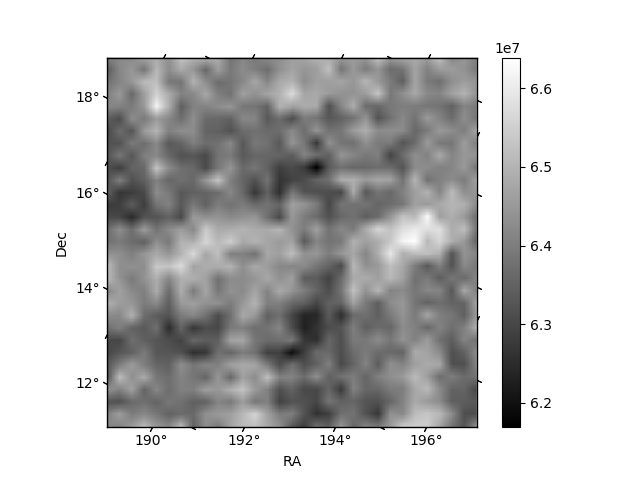
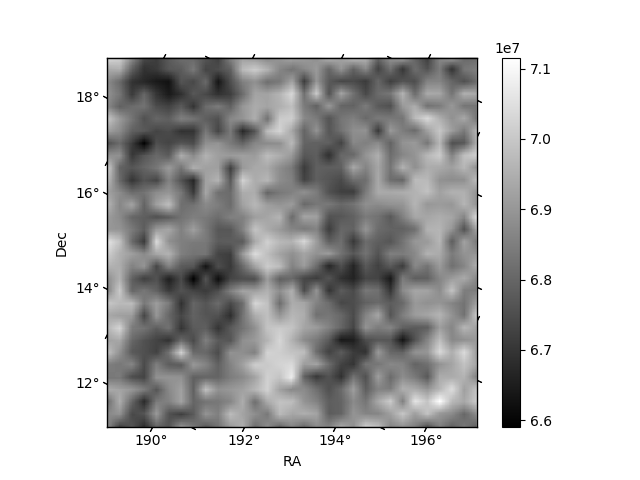
Histogram calculated using DETX and DETY for each event in the final _common_clean file
| Quadrant A |  |
 |
Quadrant B |
|---|---|---|---|
| Quadrant D | 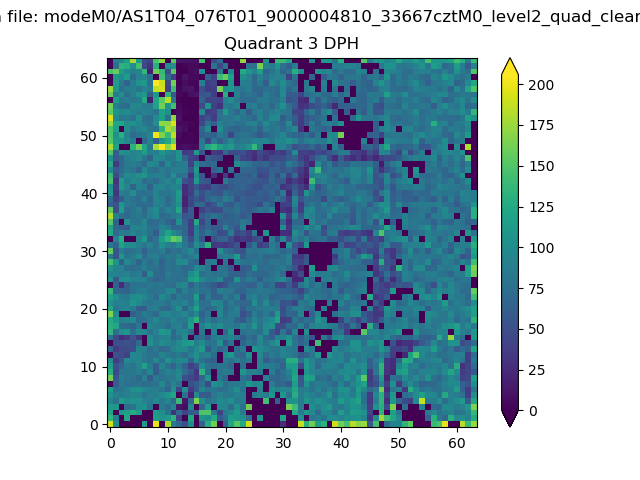 |
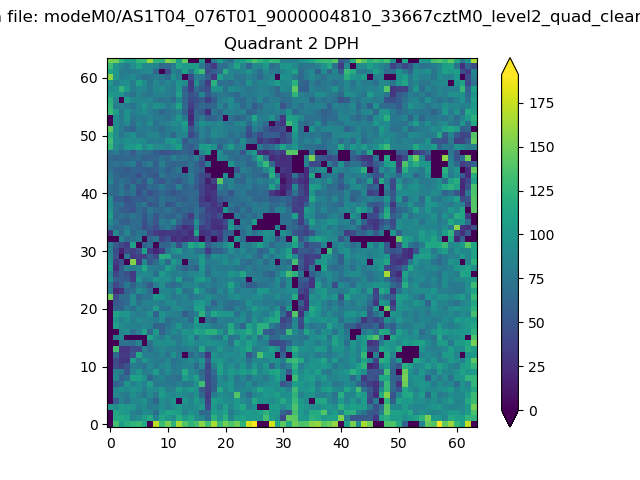 |
Quadrant C |
| Plot type | Count rate plots | Images |
|---|---|---|
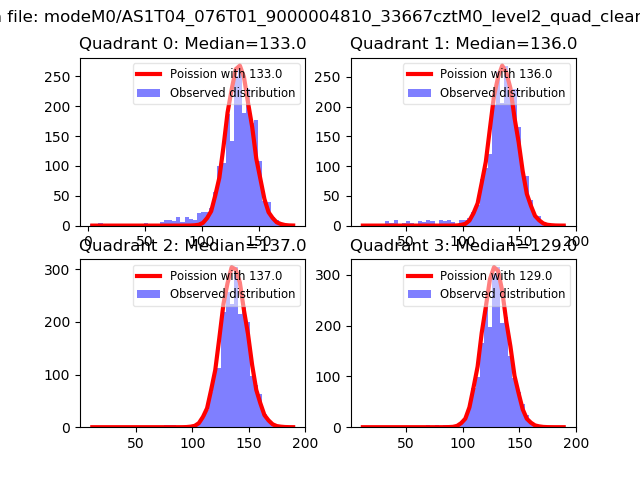
| Comparison with Poisson distribution Blue bars denote a histogram of data divided into 1 sec bins. Red curve is a Poisson curve with rate = median count rate of data. |
 |
 |
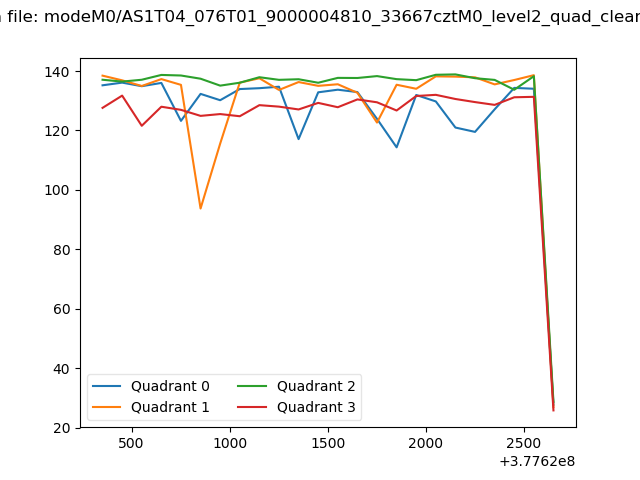
| Quadrant-wise count rates Data is divided into 100 sec bins |
 |
|
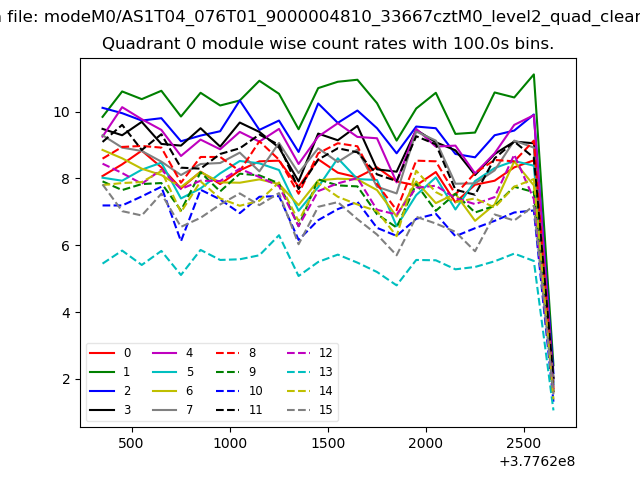
| Module-wise count rates for Quadrant A Data is divided into 100 sec bins |
 |
 |
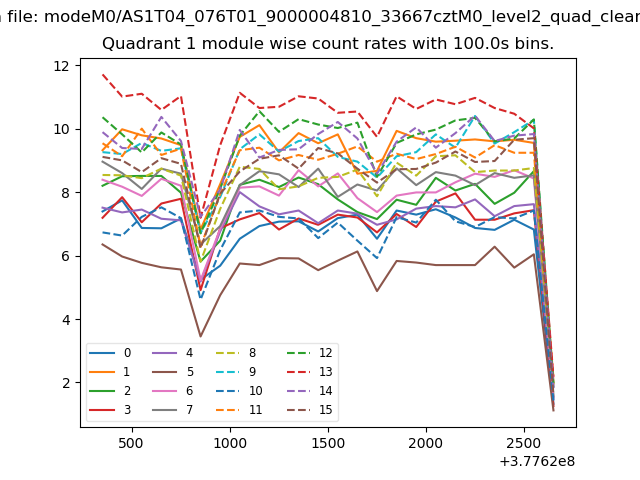
| Module-wise count rates for Quadrant B Data is divided into 100 sec bins |
 |
 |
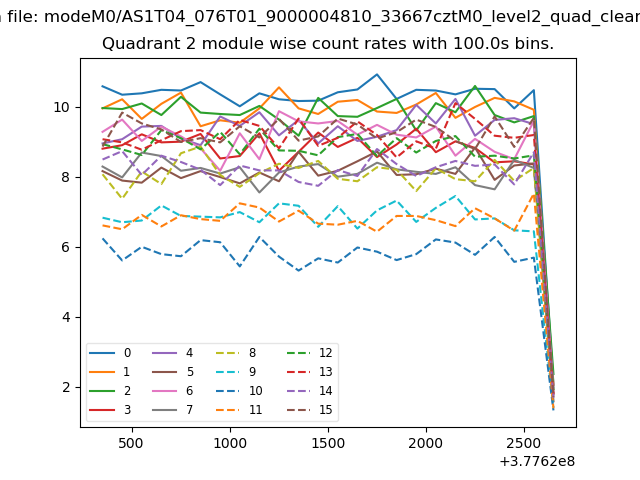
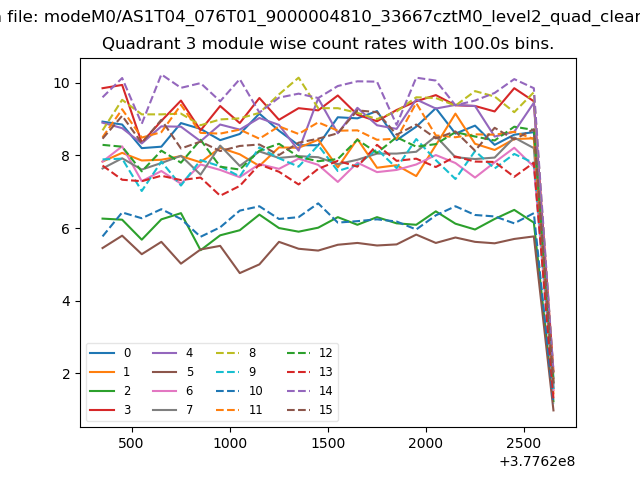
| Module-wise count rates for Quadrant C Data is divided into 100 sec bins |
 |
 |
| Module-wise count rates for Quadrant D Data is divided into 100 sec bins |
 |
 |
| Parameter | Plot |
|---|---|
| CZT HV Monitor | 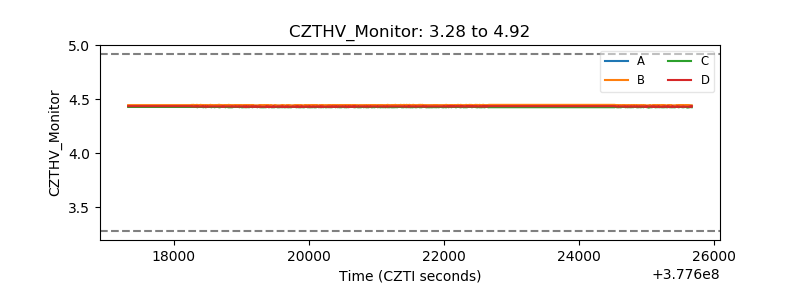 |
| D_VDD |  |
| Temperature 1 |  |
| Veto HV Monitor | 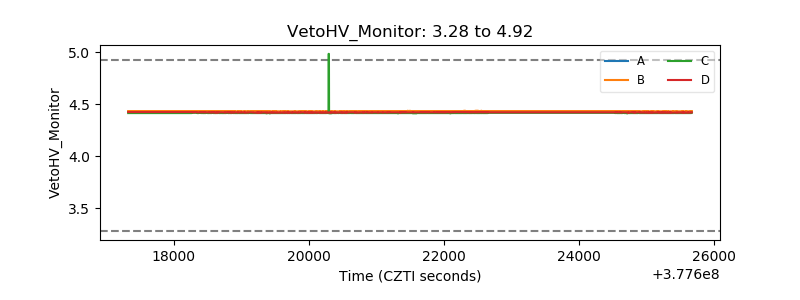 |
| Veto LLD | 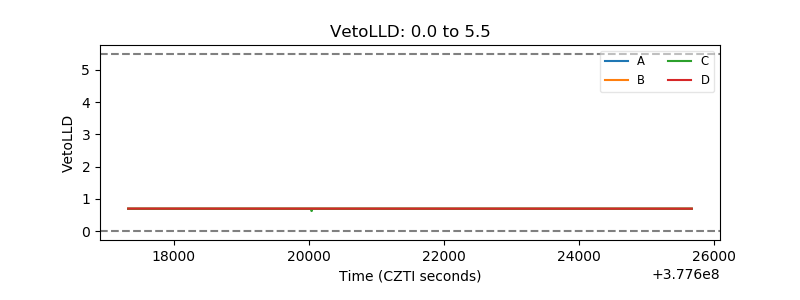 |
| Alpha Counter | 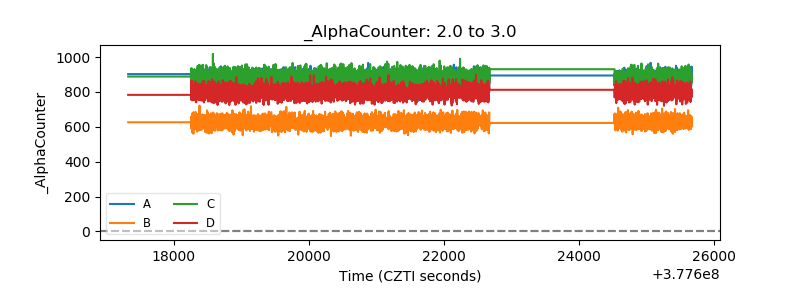 |
| _CPM_Rate | 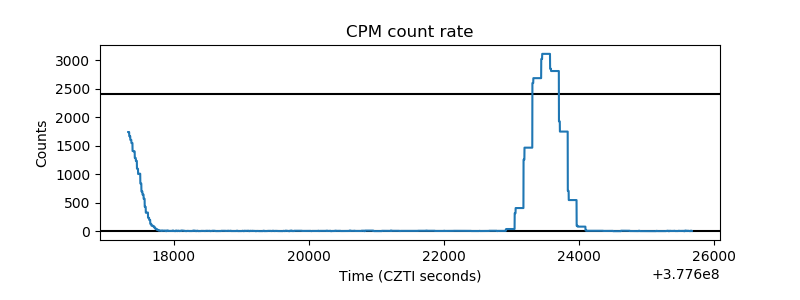 |
| CZT Counter | 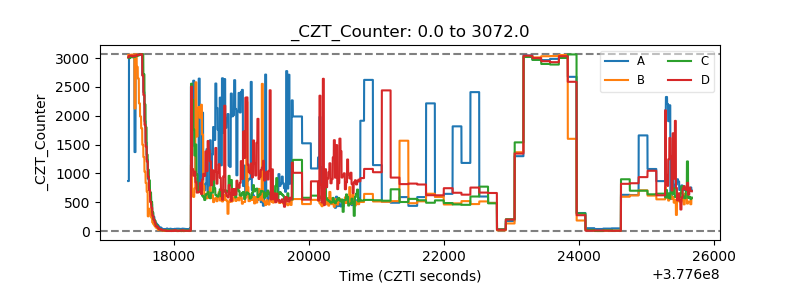 |
| +2.5 Volts monitor |  |
| +5 Volts monitor | 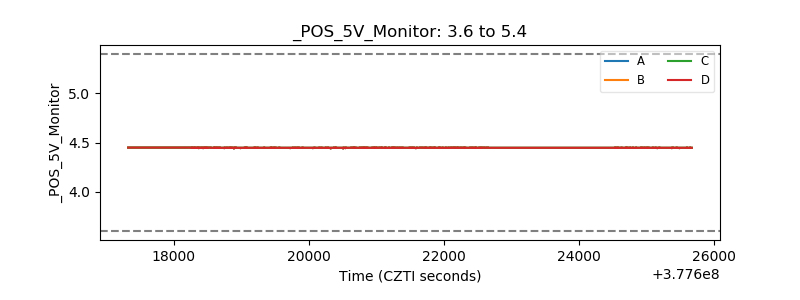 |
| _ROLL_ROT | 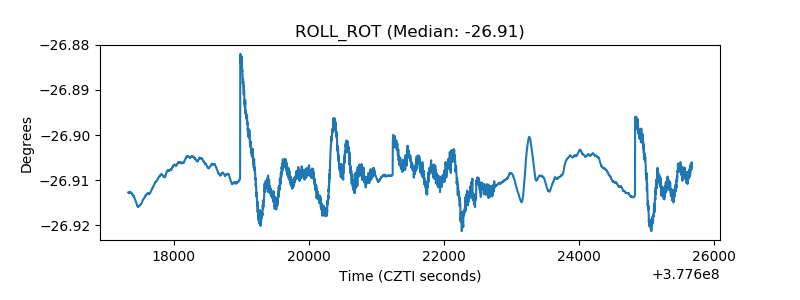 |
| _Roll_DEC | 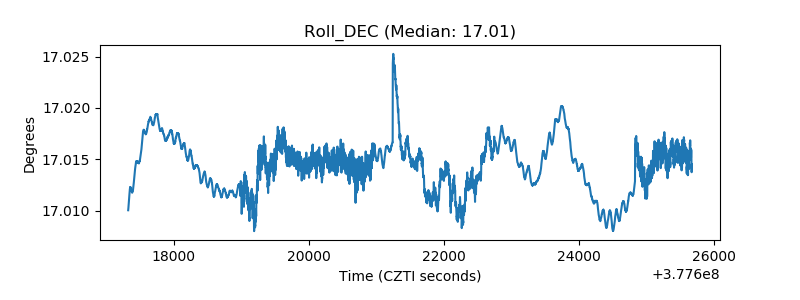 |
| _Roll_RA | 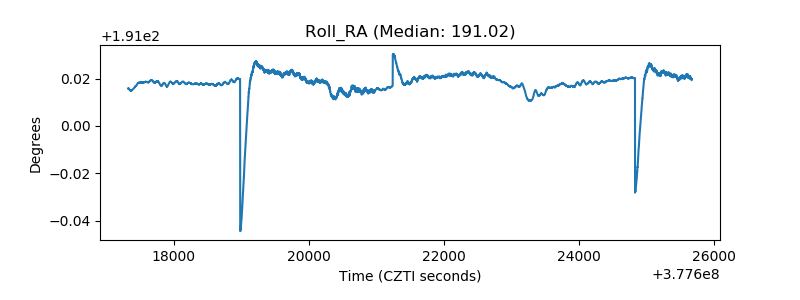 |
| Veto Counter | 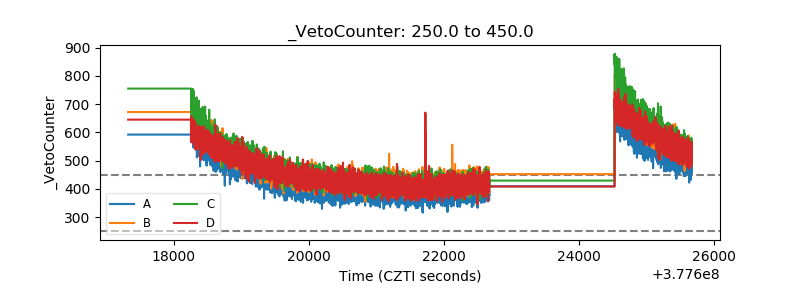 |