| Param | Original file | Final file |
|---|---|---|
| Filename | modeM0/AS1T04_076T01_9000004810_33668cztM0_level2.evt | modeM0/AS1T04_076T01_9000004810_33668cztM0_level2_quad_clean.evt |
| Size (bytes) | 499,878,720 | 60,793,920 |
| Size | 476.7 MB | 58.0 MB |
| Events in quadrant A | 5,105,619 | 372,079 |
| Events in quadrant B | 2,939,001 | 379,629 |
| Events in quadrant C | 3,009,642 | 383,440 |
| Events in quadrant D | 3,752,611 | 361,874 |
| Mode SS | |||
|---|---|---|---|
| Quadrant | BADHDUFLAG | Total packets | Discarded packets |
| A | 0 | 100 | 0 |
| B | 0 | 100 | 0 |
| C | 0 | 100 | 0 |
| D | 0 | 100 | 0 |
| Mode M9 | |||
|---|---|---|---|
| Quadrant | BADHDUFLAG | Total packets | Discarded packets |
| A | 0 | 20 | 0 |
| B | 0 | 20 | 0 |
| C | 0 | 20 | 0 |
| D | 0 | 20 | 0 |
| Mode M0 | |||
|---|---|---|---|
| Quadrant | BADHDUFLAG | Total packets | Discarded packets |
| A | 0 | 18360 | 2 |
| B | 0 | 11831 | 1 |
| C | 0 | 12040 | 1 |
| D | 0 | 14789 | 1 |
| Quadrant | Total seconds | Saturated seconds | Saturation percentage |
|---|---|---|---|
| A | 4898 | 1131 | 23.091058% |
| B | 4898 | 74 | 1.510821% |
| C | 4898 | 61 | 1.245406% |
| D | 4898 | 90 | 1.837485% |
Noise dominated data is calculated using 1-second bins in cleaned event files. If a bin has >2000 counts, and if more than 50% of those come from <1% of pixels, then it is considered to be noise-dominated and hence unusable.
| Quadrant | # 1 sec bins | Bins with >0 counts | Bins with >2000 counts | High rate bins dominated by noise | Noise dominated (total time) | Noise dominated (detector-on time) | Marked lightcurve |
|---|---|---|---|---|---|---|---|
| A | 6870 | 4899 | 974 | 974 | 14.18% | 19.88% | 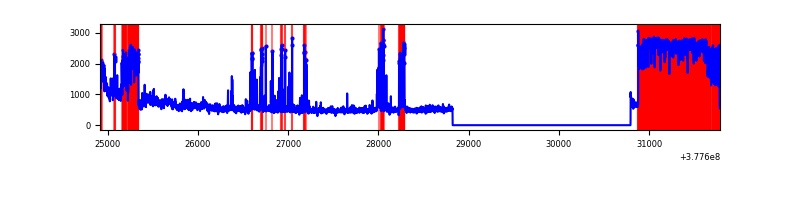 |
| B | 6870 | 4899 | 57 | 57 | 0.83% | 1.16% | 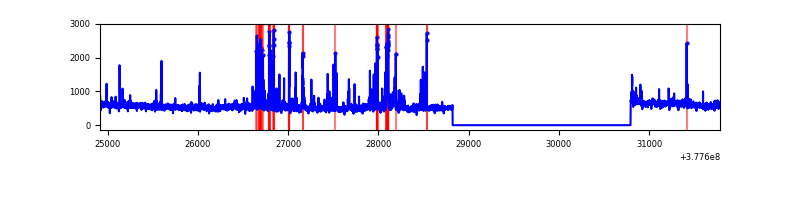 |
| C | 6870 | 4899 | 46 | 46 | 0.67% | 0.94% | 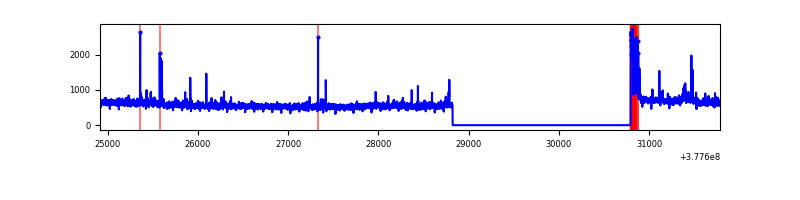 |
| D | 6870 | 4899 | 82 | 82 | 1.19% | 1.67% | 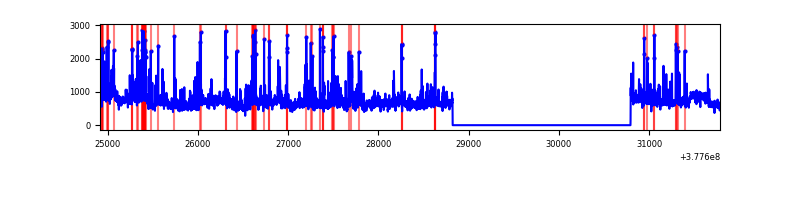 |
Top three noisy pixels from each quadrant. If the there are fewer than three noisy pixels in the level2.evt file, extra rows are filled as -1
| Pixel properties | Quadrant properties | ||||||
|---|---|---|---|---|---|---|---|
| Quadrant | DetID | PixID | Counts | Sigma | Mean | Median | Sigma |
| A | 15 | 169 | 2759317 | 26162.58 | 525 | 517 | 105.4 |
| A | 9 | 143 | 165526 | 1564.83 | 525 | 517 | 105.4 |
| A | 15 | 237 | 140764 | 1330.01 | 525 | 517 | 105.4 |
| B | 5 | 172 | 187876 | 1541.26 | 650 | 635 | 121.5 |
| B | 0 | 244 | 65836 | 536.7 | 650 | 635 | 121.5 |
| B | 5 | 255 | 37226 | 301.2 | 650 | 635 | 121.5 |
| C | 15 | 214 | 220375 | 1491.47 | 643 | 651 | 147.3 |
| C | 0 | 10 | 148157 | 1001.26 | 643 | 651 | 147.3 |
| C | 3 | 233 | 109185 | 736.72 | 643 | 651 | 147.3 |
| D | 8 | 195 | 682511 | 4102.06 | 634 | 620 | 166.2 |
| D | 13 | 249 | 153952 | 922.4 | 634 | 620 | 166.2 |
| D | 2 | 249 | 90377 | 539.95 | 634 | 620 | 166.2 |
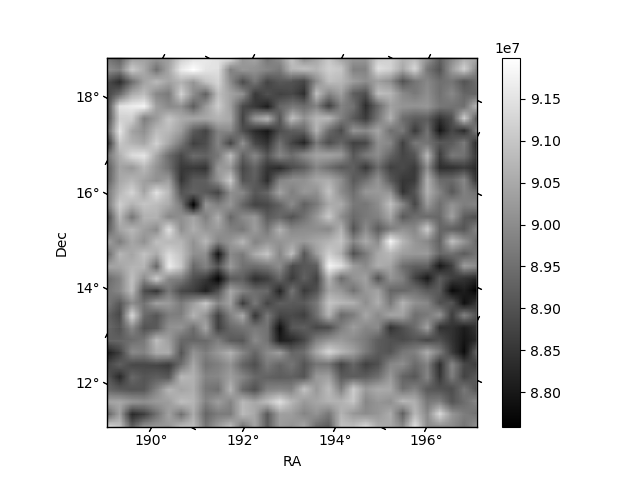
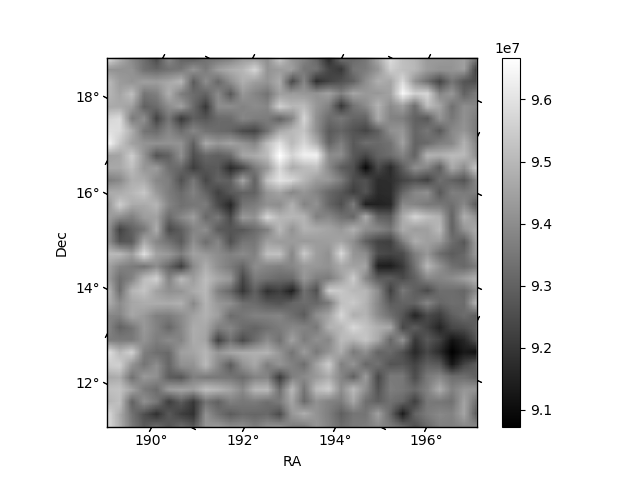
Histogram calculated using DETX and DETY for each event in the final _common_clean file
| Quadrant A | 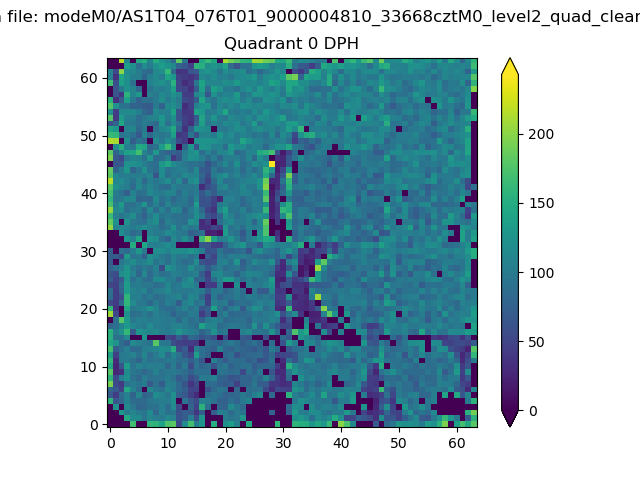 |
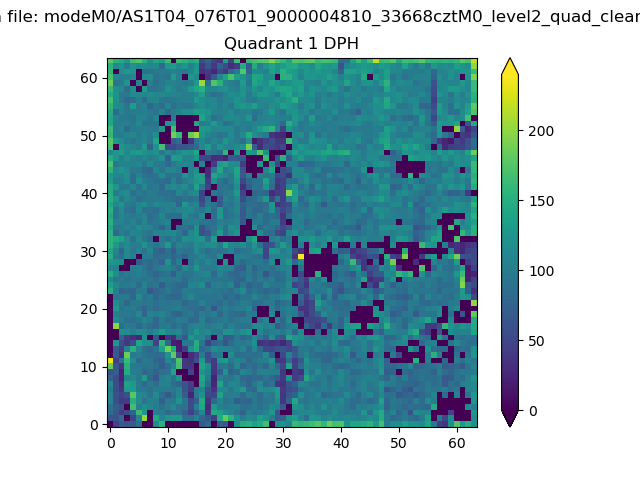 |
Quadrant B |
|---|---|---|---|
| Quadrant D |  |
 |
Quadrant C |
| Plot type | Count rate plots | Images |
|---|---|---|
| Comparison with Poisson distribution Blue bars denote a histogram of data divided into 1 sec bins. Red curve is a Poisson curve with rate = median count rate of data. |
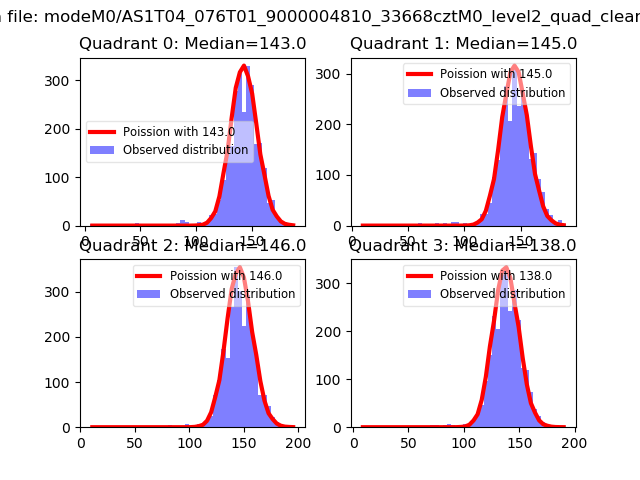 |
 |
| Quadrant-wise count rates Data is divided into 100 sec bins |
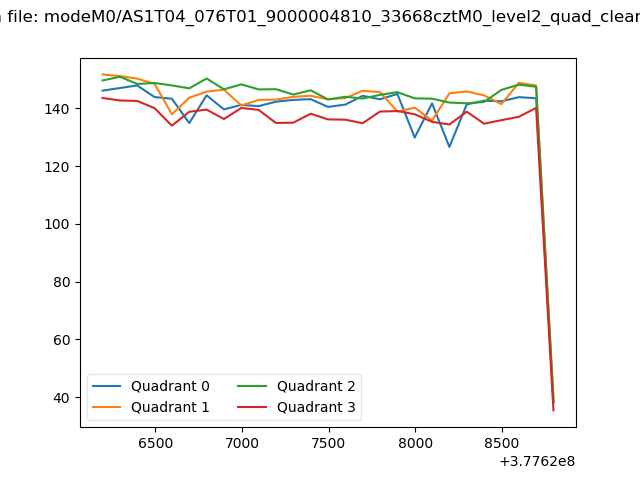 |
|
| Module-wise count rates for Quadrant A Data is divided into 100 sec bins |
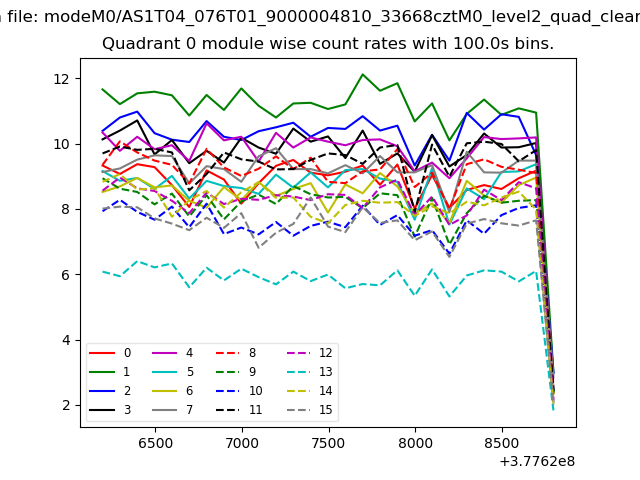 |
 |
| Module-wise count rates for Quadrant B Data is divided into 100 sec bins |
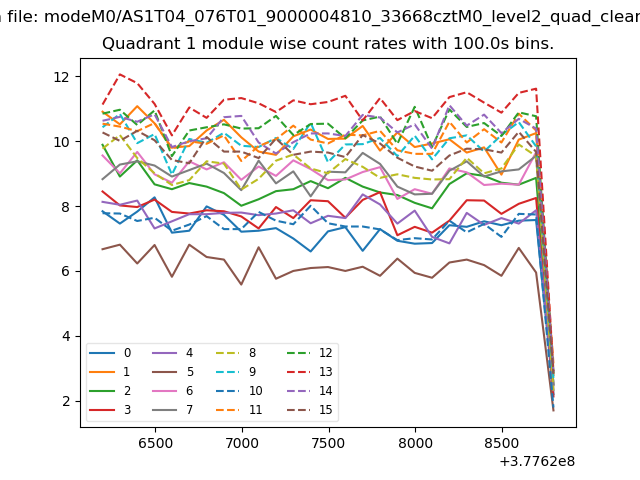 |
 |
| Module-wise count rates for Quadrant C Data is divided into 100 sec bins |
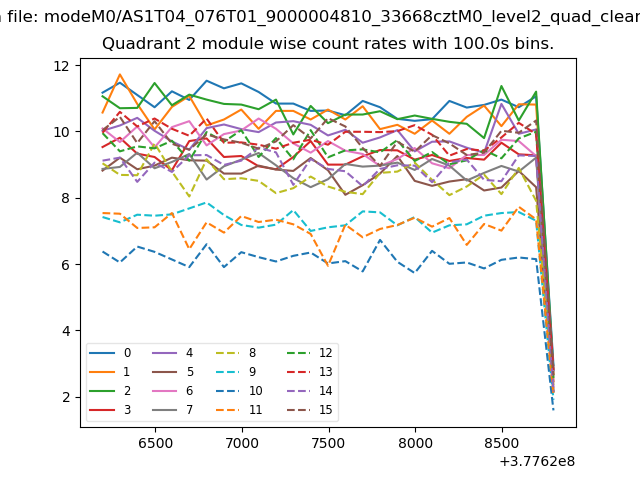 |
 |
| Module-wise count rates for Quadrant D Data is divided into 100 sec bins |
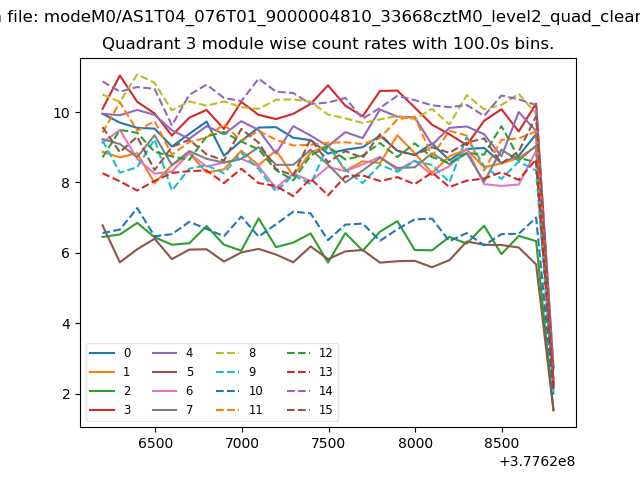 |
 |
| Parameter | Plot |
|---|---|
| CZT HV Monitor |  |
| D_VDD | 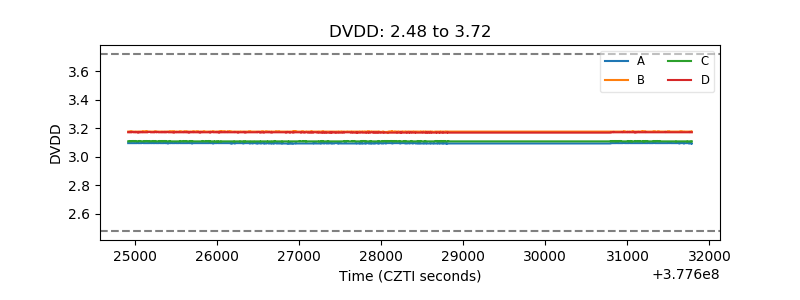 |
| Temperature 1 | 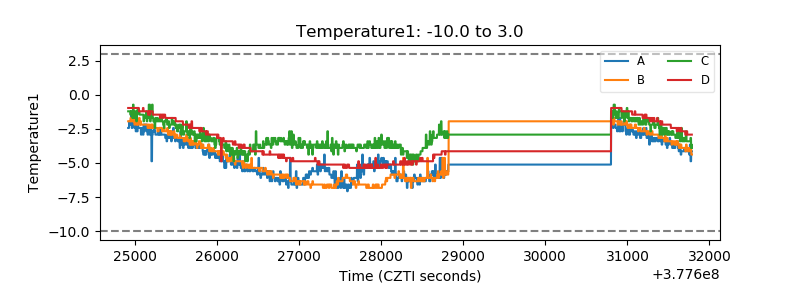 |
| Veto HV Monitor | 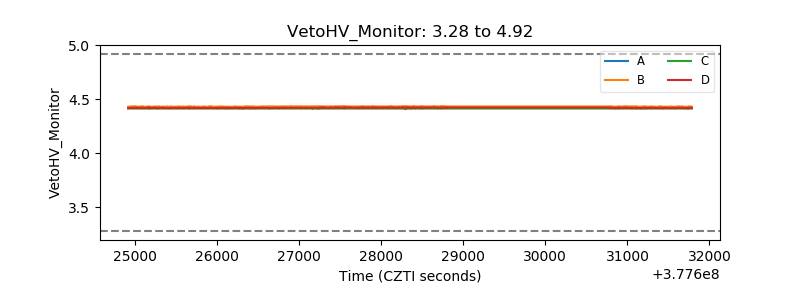 |
| Veto LLD | 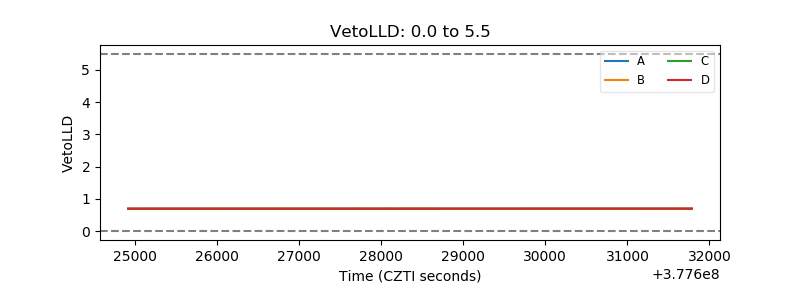 |
| Alpha Counter | 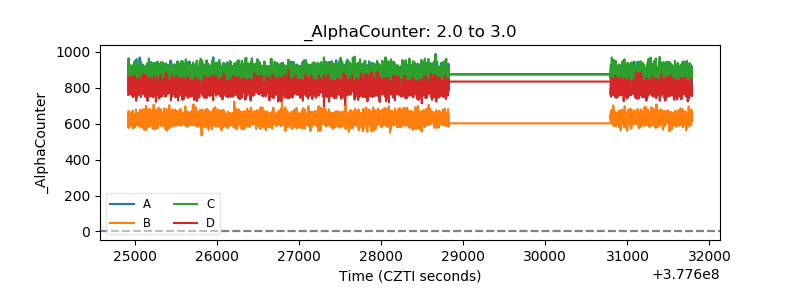 |
| _CPM_Rate | 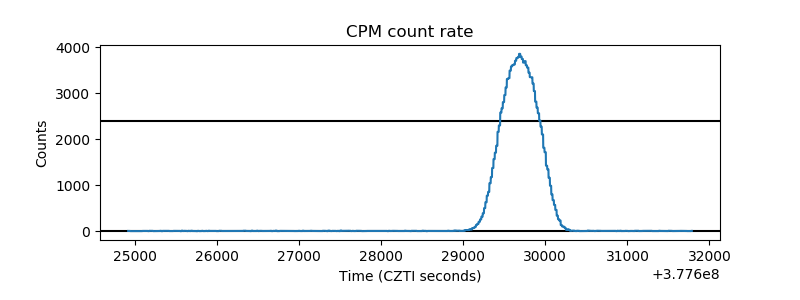 |
| CZT Counter |  |
| +2.5 Volts monitor |  |
| +5 Volts monitor | 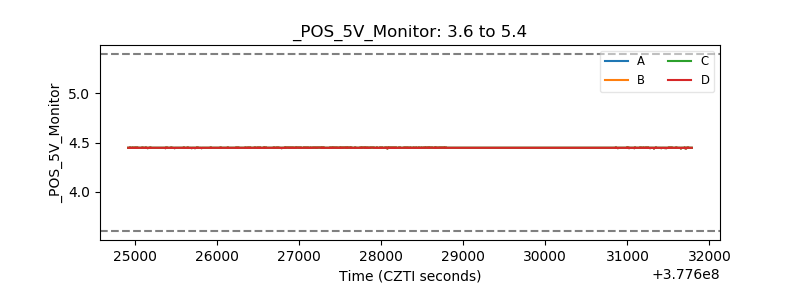 |
| _ROLL_ROT | 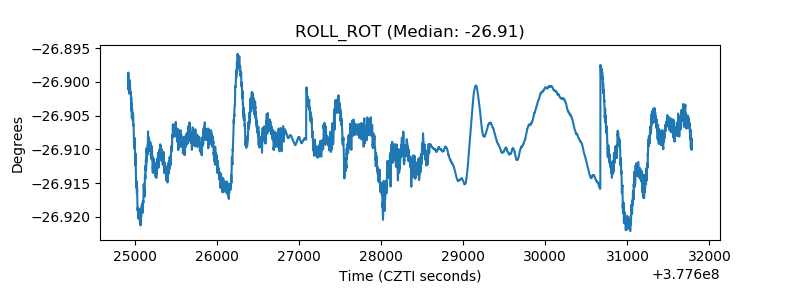 |
| _Roll_DEC | 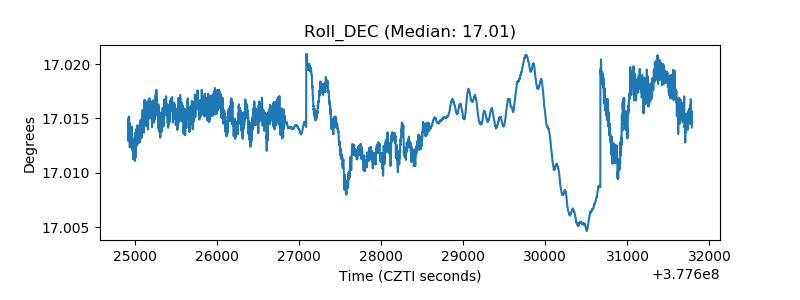 |
| _Roll_RA |  |
| Veto Counter | 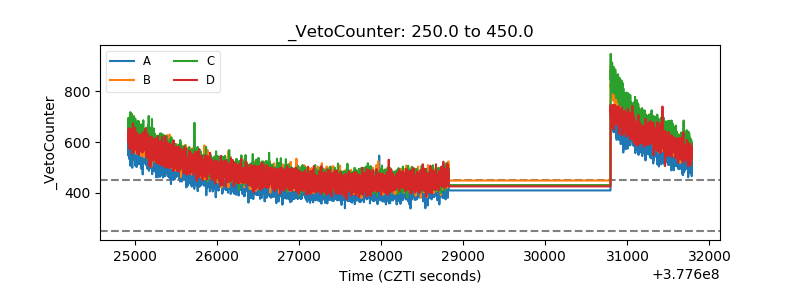 |