| Param | Original file | Final file |
|---|---|---|
| Filename | modeM0/AS1T04_076T01_9000004810_33669cztM0_level2.evt | modeM0/AS1T04_076T01_9000004810_33669cztM0_level2_quad_clean.evt |
| Size (bytes) | 712,209,600 | 58,818,240 |
| Size | 679.2 MB | 56.1 MB |
| Events in quadrant A | 10,686,994 | 118,109 |
| Events in quadrant B | 3,313,803 | 438,601 |
| Events in quadrant C | 3,554,518 | 448,603 |
| Events in quadrant D | 3,679,202 | 426,951 |
| Mode SS | |||
|---|---|---|---|
| Quadrant | BADHDUFLAG | Total packets | Discarded packets |
| A | 0 | 100 | 0 |
| B | 0 | 100 | 0 |
| C | 0 | 100 | 0 |
| D | 0 | 100 | 0 |
| Mode M9 | |||
|---|---|---|---|
| Quadrant | BADHDUFLAG | Total packets | Discarded packets |
| A | 0 | 21 | 0 |
| B | 0 | 21 | 0 |
| C | 0 | 21 | 0 |
| D | 0 | 22 | 0 |
| Mode M0 | |||
|---|---|---|---|
| Quadrant | BADHDUFLAG | Total packets | Discarded packets |
| A | 0 | 35174 | 3 |
| B | 0 | 13197 | 2 |
| C | 0 | 14345 | 2 |
| D | 0 | 14655 | 2 |
| Quadrant | Total seconds | Saturated seconds | Saturation percentage |
|---|---|---|---|
| A | 4954 | 4188 | 84.537747% |
| B | 4954 | 184 | 3.714170% |
| C | 4954 | 157 | 3.169156% |
| D | 4954 | 49 | 0.989100% |
Noise dominated data is calculated using 1-second bins in cleaned event files. If a bin has >2000 counts, and if more than 50% of those come from <1% of pixels, then it is considered to be noise-dominated and hence unusable.
| Quadrant | # 1 sec bins | Bins with >0 counts | Bins with >2000 counts | High rate bins dominated by noise | Noise dominated (total time) | Noise dominated (detector-on time) | Marked lightcurve |
|---|---|---|---|---|---|---|---|
| A | 7017 | 4953 | 3745 | 3745 | 53.37% | 75.61% | 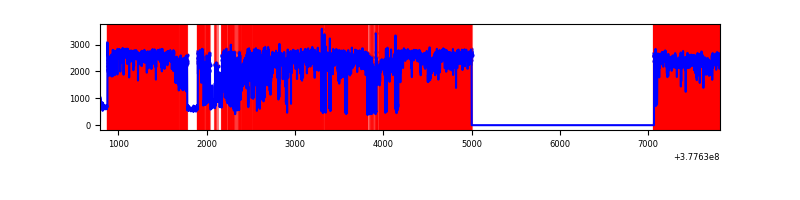 |
| B | 7018 | 4955 | 155 | 155 | 2.21% | 3.13% | 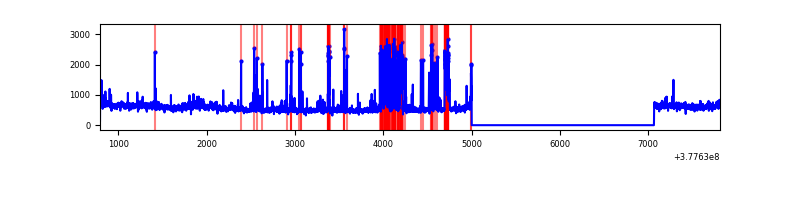 |
| C | 7018 | 4955 | 126 | 126 | 1.80% | 2.54% | 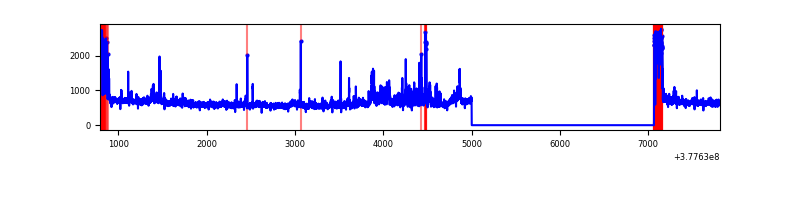 |
| D | 7018 | 4955 | 42 | 42 | 0.60% | 0.85% | 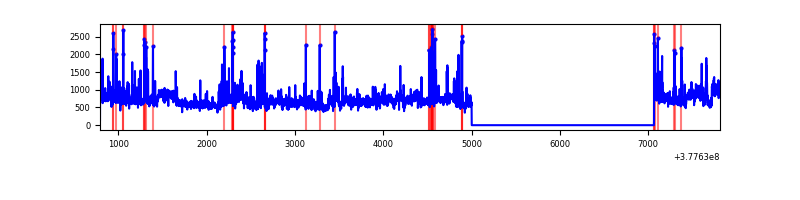 |
Top three noisy pixels from each quadrant. If the there are fewer than three noisy pixels in the level2.evt file, extra rows are filled as -1
| Pixel properties | Quadrant properties | ||||||
|---|---|---|---|---|---|---|---|
| Quadrant | DetID | PixID | Counts | Sigma | Mean | Median | Sigma |
| A | 15 | 169 | 9730249 | 234627.38 | 201 | 198 | 41.5 |
| A | 15 | 237 | 155341 | 3741.07 | 201 | 198 | 41.5 |
| A | 9 | 143 | 12743 | 302.51 | 201 | 198 | 41.5 |
| B | 5 | 172 | 539360 | 4300.35 | 668 | 653 | 125.3 |
| B | 8 | 128 | 37013 | 290.25 | 668 | 653 | 125.3 |
| B | 0 | 244 | 24256 | 188.42 | 668 | 653 | 125.3 |
| C | 3 | 233 | 383837 | 2573.62 | 657 | 666 | 148.9 |
| C | 0 | 10 | 348552 | 2336.62 | 657 | 666 | 148.9 |
| C | 15 | 214 | 226017 | 1513.6 | 657 | 666 | 148.9 |
| D | 8 | 195 | 654635 | 3862.29 | 658 | 644 | 169.3 |
| D | 13 | 249 | 126675 | 744.3 | 658 | 644 | 169.3 |
| D | 7 | 223 | 84798 | 496.99 | 658 | 644 | 169.3 |
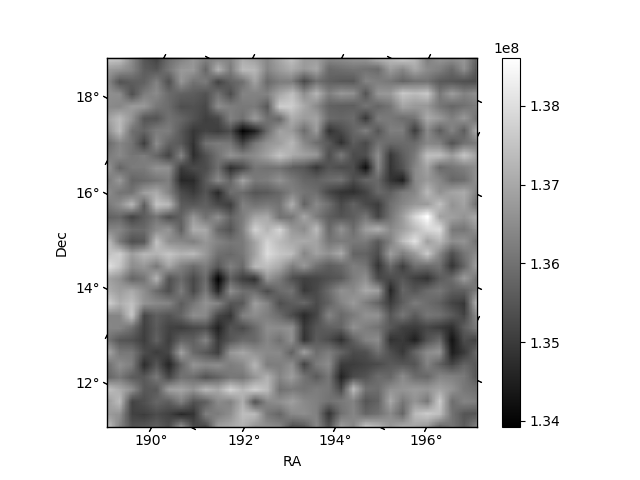
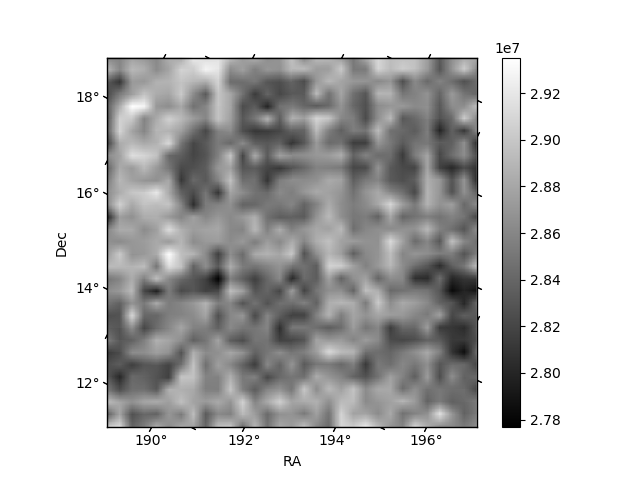
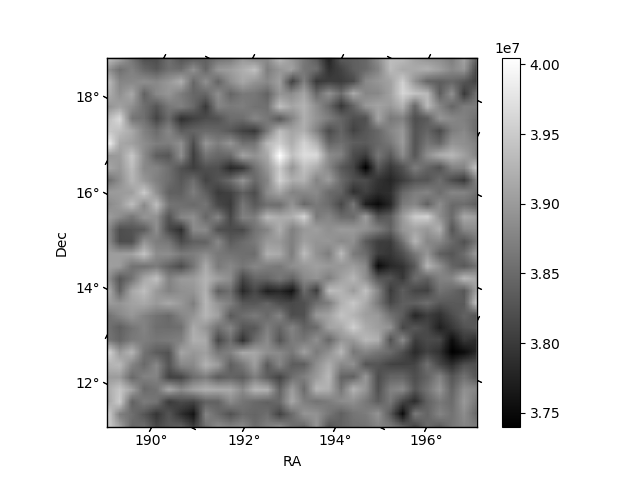
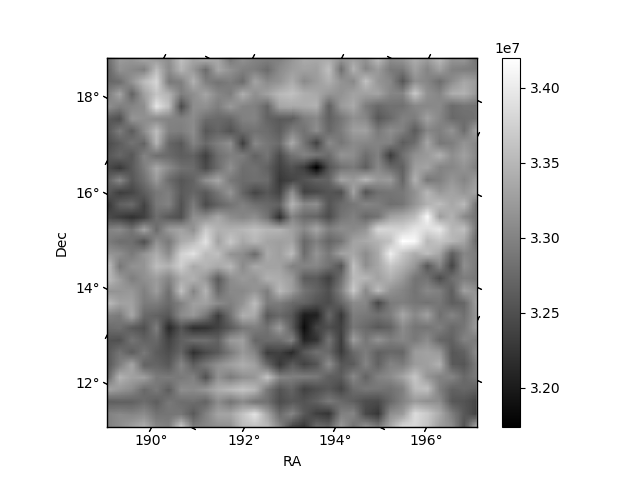
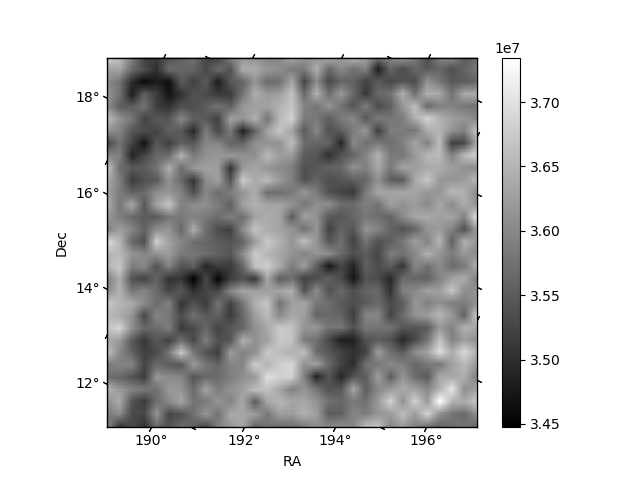
Histogram calculated using DETX and DETY for each event in the final _common_clean file
| Quadrant A | 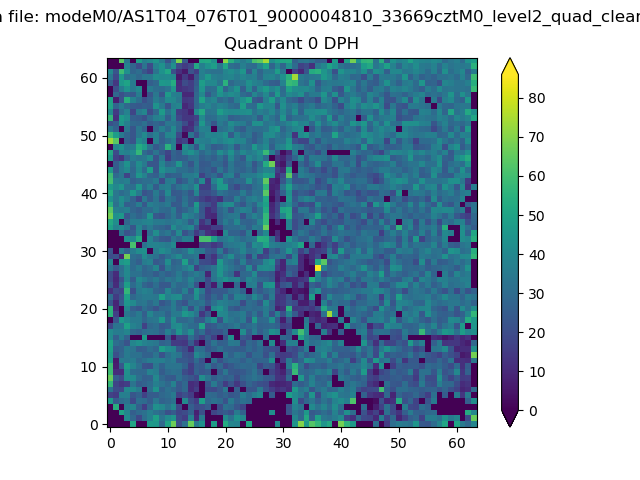 |
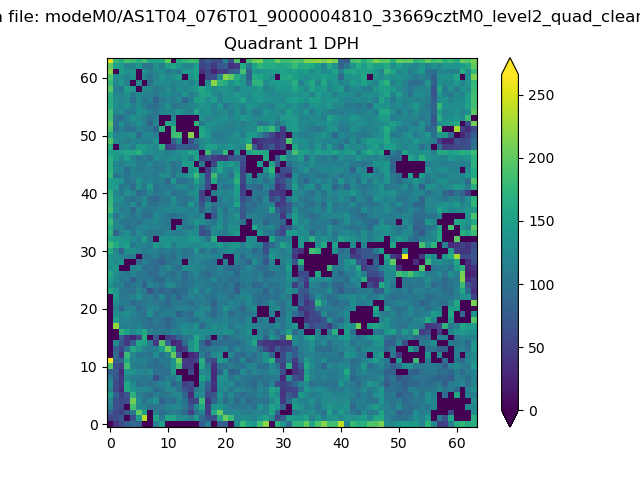 |
Quadrant B |
|---|---|---|---|
| Quadrant D | 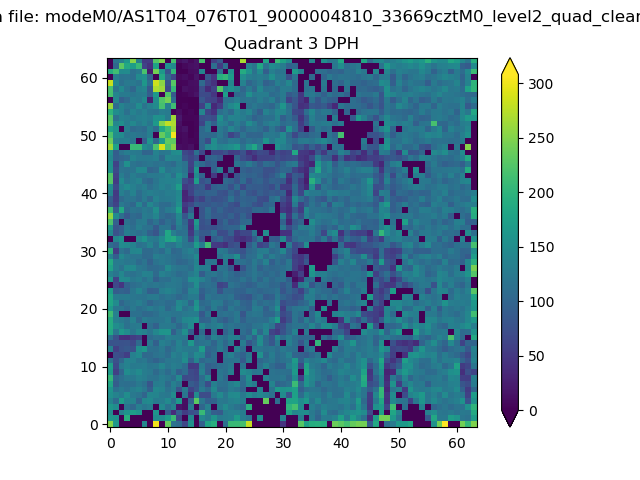 |
 |
Quadrant C |
| Plot type | Count rate plots | Images |
|---|---|---|
| Comparison with Poisson distribution Blue bars denote a histogram of data divided into 1 sec bins. Red curve is a Poisson curve with rate = median count rate of data. |
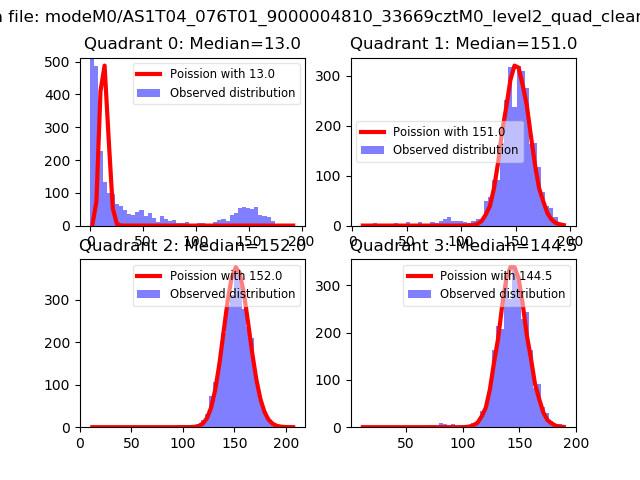 |
 |
| Quadrant-wise count rates Data is divided into 100 sec bins |
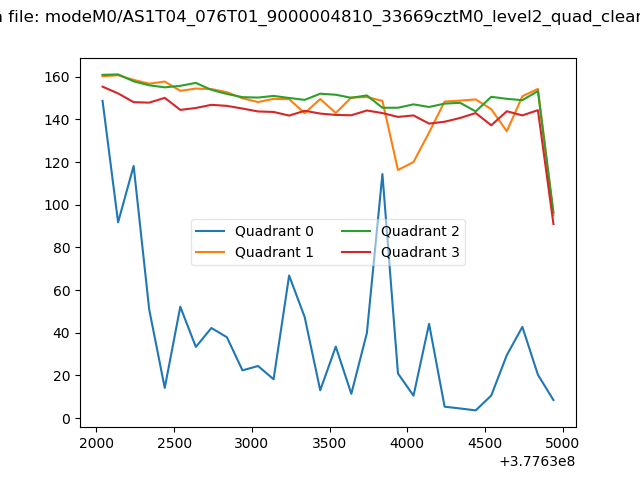 |
|
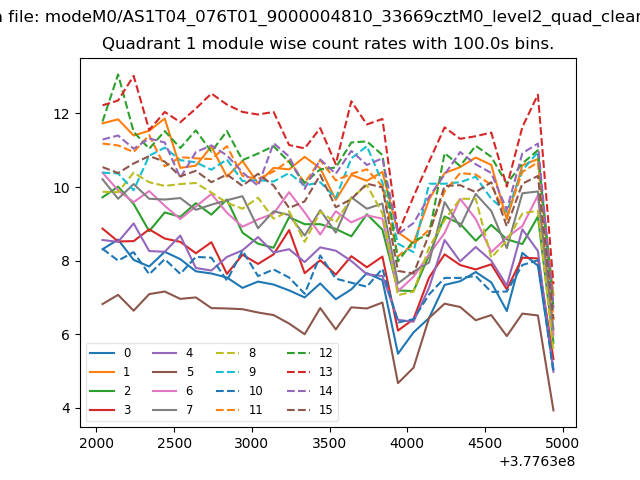
| Module-wise count rates for Quadrant A Data is divided into 100 sec bins |
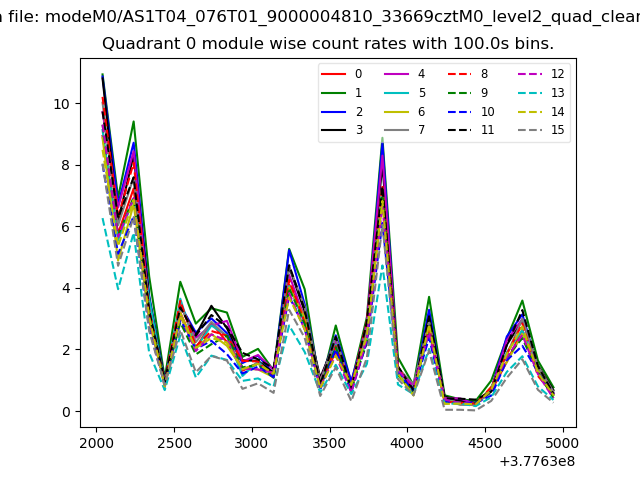 |
 |
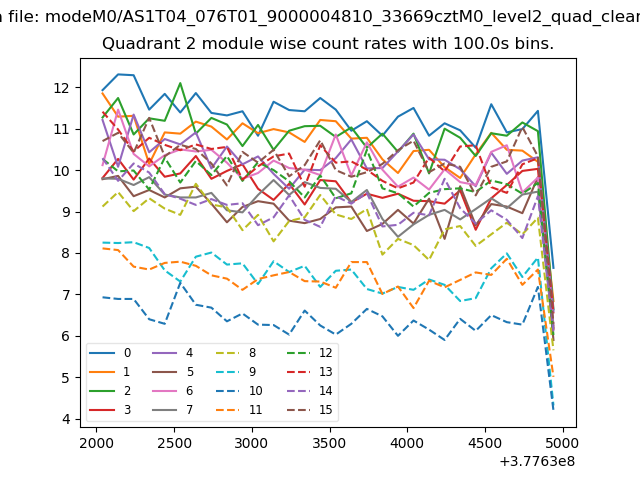
| Module-wise count rates for Quadrant B Data is divided into 100 sec bins |
 |
 |
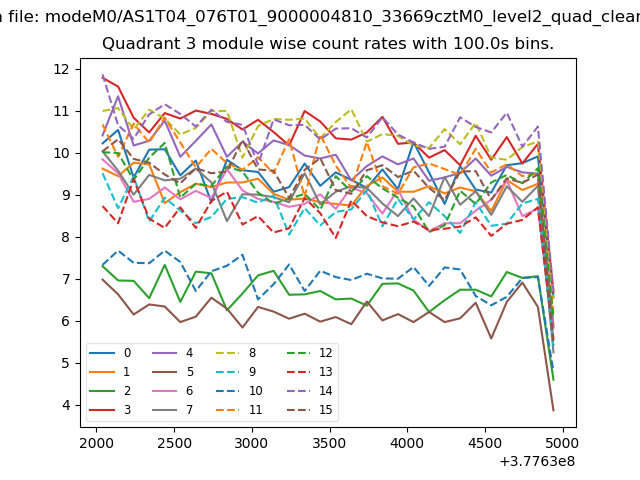
| Module-wise count rates for Quadrant C Data is divided into 100 sec bins |
 |
 |
| Module-wise count rates for Quadrant D Data is divided into 100 sec bins |
 |
 |
| Parameter | Plot |
|---|---|
| CZT HV Monitor | 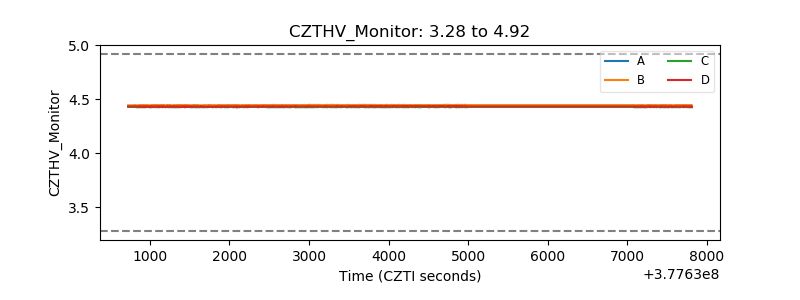 |
| D_VDD | 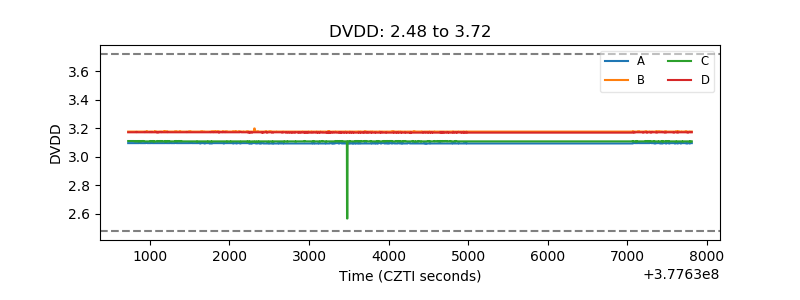 |
| Temperature 1 | 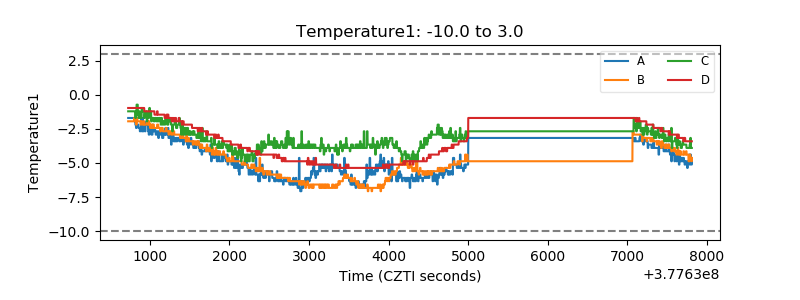 |
| Veto HV Monitor |  |
| Veto LLD | 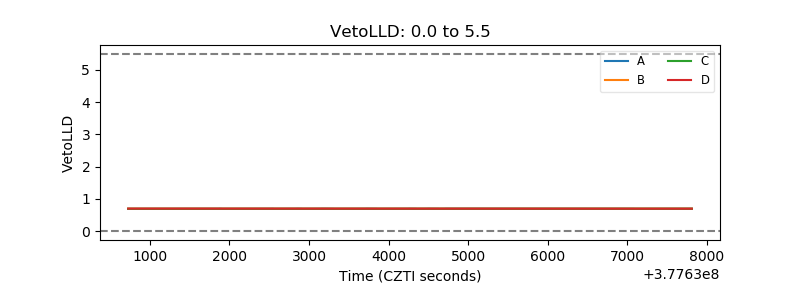 |
| Alpha Counter | 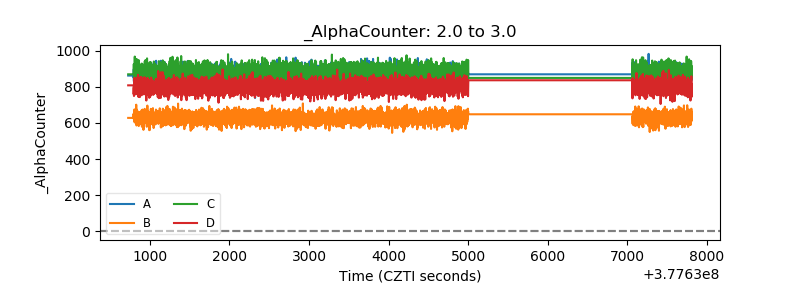 |
| _CPM_Rate | 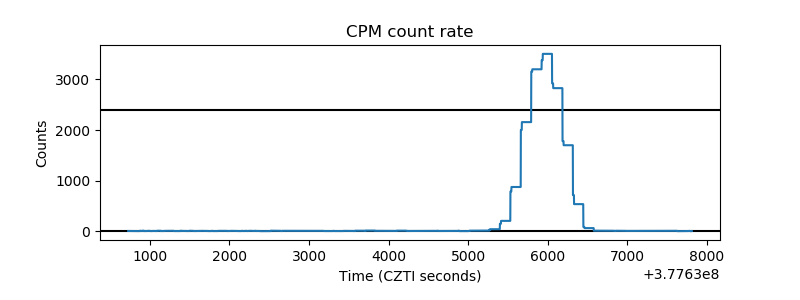 |
| CZT Counter |  |
| +2.5 Volts monitor |  |
| +5 Volts monitor | 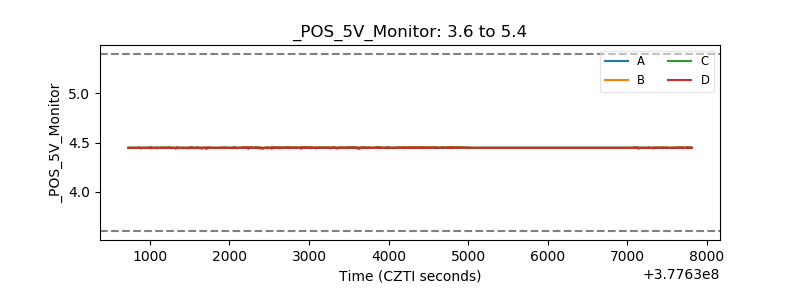 |
| _ROLL_ROT | 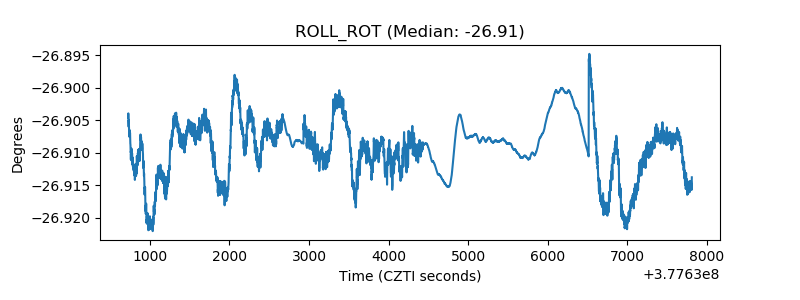 |
| _Roll_DEC | 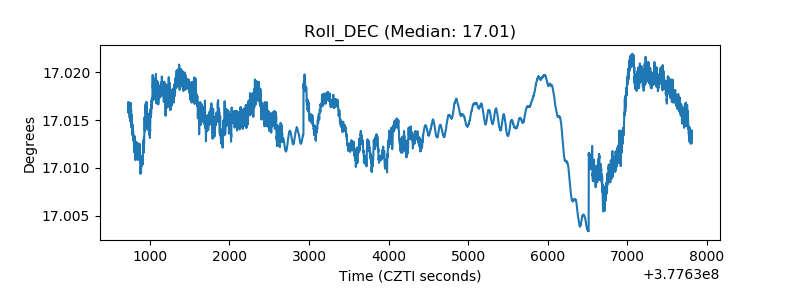 |
| _Roll_RA |  |
| Veto Counter | 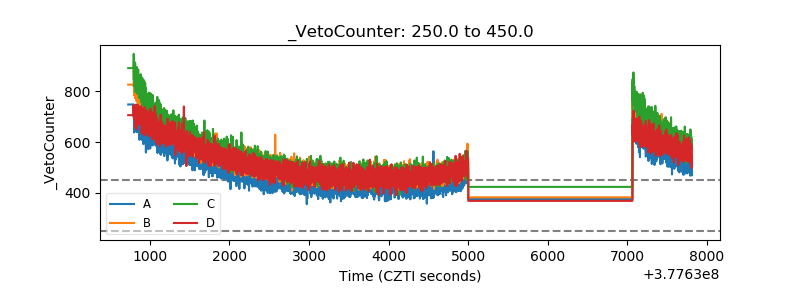 |