| Param | Original file | Final file |
|---|---|---|
| Filename | modeM0/AS1T04_076T01_9000004810_33670cztM0_level2.evt | modeM0/AS1T04_076T01_9000004810_33670cztM0_level2_quad_clean.evt |
| Size (bytes) | 670,011,840 | 74,016,000 |
| Size | 639.0 MB | 70.6 MB |
| Events in quadrant A | 10,290,627 | 246,961 |
| Events in quadrant B | 2,973,993 | 559,468 |
| Events in quadrant C | 3,257,358 | 559,160 |
| Events in quadrant D | 3,436,863 | 530,244 |
| Mode SS | |||
|---|---|---|---|
| Quadrant | BADHDUFLAG | Total packets | Discarded packets |
| A | 0 | 98 | 0 |
| B | 0 | 98 | 0 |
| C | 0 | 98 | 0 |
| D | 0 | 98 | 0 |
| Mode M9 | |||
|---|---|---|---|
| Quadrant | BADHDUFLAG | Total packets | Discarded packets |
| A | 0 | 27 | 0 |
| B | 0 | 27 | 0 |
| C | 0 | 27 | 0 |
| D | 0 | 28 | 0 |
| Mode M0 | |||
|---|---|---|---|
| Quadrant | BADHDUFLAG | Total packets | Discarded packets |
| A | 0 | 33918 | 3 |
| B | 0 | 11974 | 2 |
| C | 0 | 12941 | 2 |
| D | 0 | 13537 | 2 |
| Quadrant | Total seconds | Saturated seconds | Saturation percentage |
|---|---|---|---|
| A | 4909 | 4552 | 92.727643% |
| B | 4909 | 70 | 1.425952% |
| C | 4909 | 159 | 3.238949% |
| D | 4909 | 19 | 0.387044% |
Noise dominated data is calculated using 1-second bins in cleaned event files. If a bin has >2000 counts, and if more than 50% of those come from <1% of pixels, then it is considered to be noise-dominated and hence unusable.
| Quadrant | # 1 sec bins | Bins with >0 counts | Bins with >2000 counts | High rate bins dominated by noise | Noise dominated (total time) | Noise dominated (detector-on time) | Marked lightcurve |
|---|---|---|---|---|---|---|---|
| A | 7031 | 4908 | 3389 | 3389 | 48.20% | 69.05% | 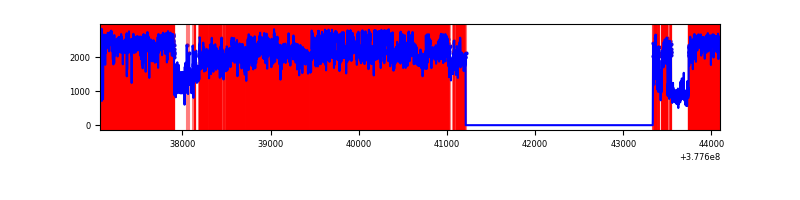 |
| B | 7032 | 4910 | 50 | 50 | 0.71% | 1.02% | 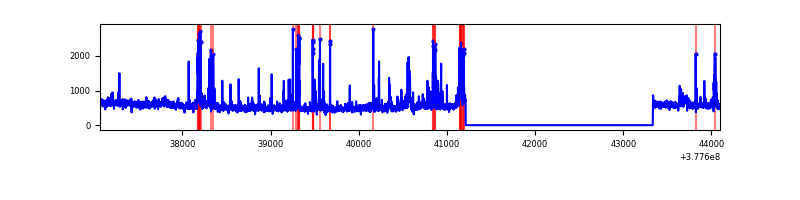 |
| C | 7032 | 4910 | 133 | 133 | 1.89% | 2.71% | 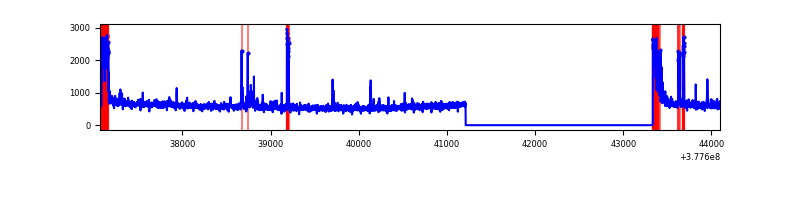 |
| D | 7032 | 4910 | 13 | 13 | 0.18% | 0.26% | 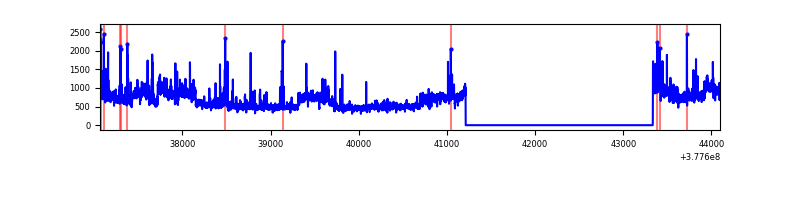 |
Top three noisy pixels from each quadrant. If the there are fewer than three noisy pixels in the level2.evt file, extra rows are filled as -1
| Pixel properties | Quadrant properties | ||||||
|---|---|---|---|---|---|---|---|
| Quadrant | DetID | PixID | Counts | Sigma | Mean | Median | Sigma |
| A | 15 | 169 | 9118437 | 170637.82 | 261 | 257 | 53.4 |
| A | 15 | 237 | 118692 | 2216.4 | 261 | 257 | 53.4 |
| A | 9 | 143 | 35452 | 658.64 | 261 | 257 | 53.4 |
| B | 5 | 172 | 189176 | 1544.69 | 646 | 633 | 122.1 |
| B | 15 | 222 | 81298 | 660.87 | 646 | 633 | 122.1 |
| B | 4 | 81 | 39257 | 316.44 | 646 | 633 | 122.1 |
| C | 0 | 10 | 361002 | 2515.92 | 627 | 637 | 143.2 |
| C | 15 | 214 | 227878 | 1586.51 | 627 | 637 | 143.2 |
| C | 3 | 233 | 204327 | 1422.08 | 627 | 637 | 143.2 |
| D | 8 | 195 | 607476 | 3747.25 | 626 | 615 | 161.9 |
| D | 1 | 52 | 115115 | 707.02 | 626 | 615 | 161.9 |
| D | 2 | 250 | 72256 | 442.37 | 626 | 615 | 161.9 |
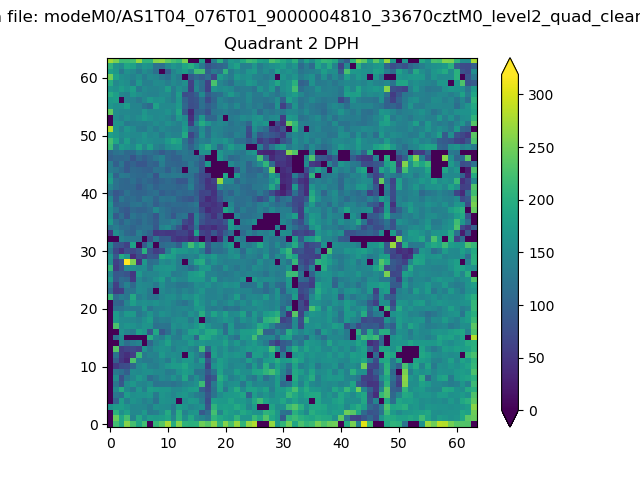
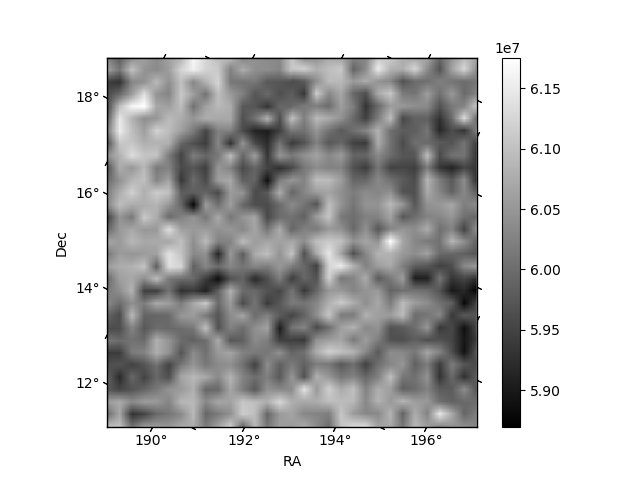
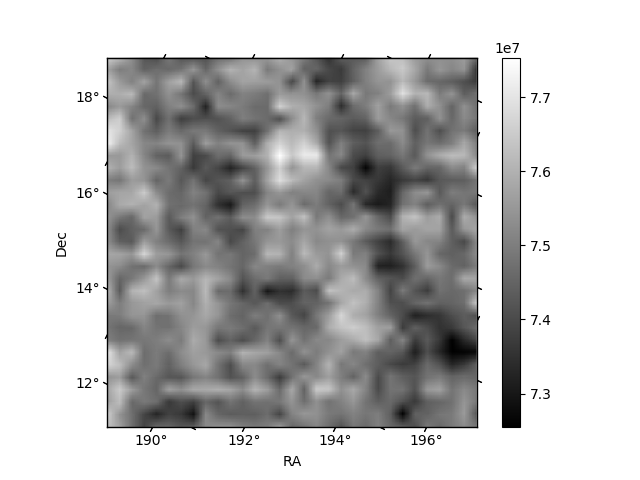
Histogram calculated using DETX and DETY for each event in the final _common_clean file
| Quadrant A | 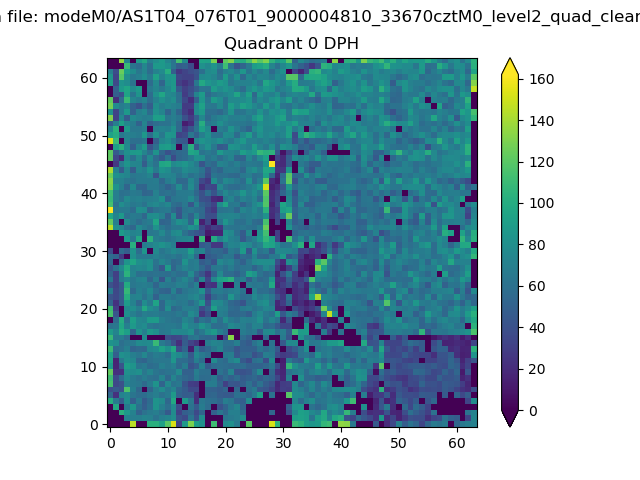 |
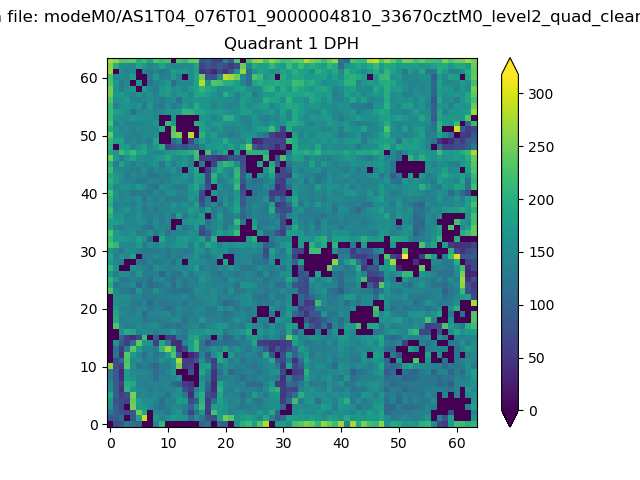 |
Quadrant B |
|---|---|---|---|
| Quadrant D | 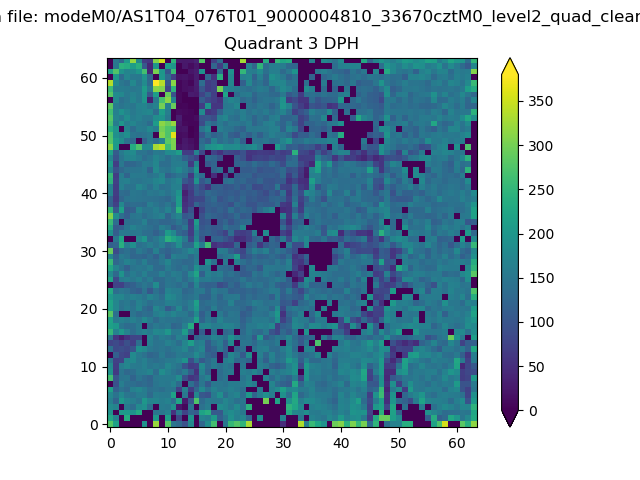 |
 |
Quadrant C |
| Plot type | Count rate plots | Images |
|---|---|---|
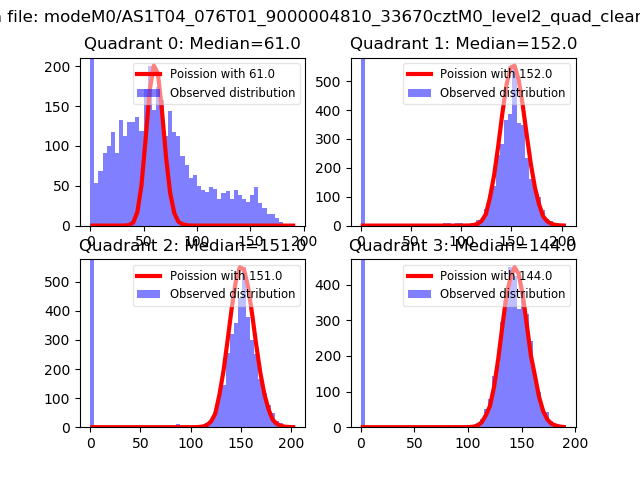
| Comparison with Poisson distribution Blue bars denote a histogram of data divided into 1 sec bins. Red curve is a Poisson curve with rate = median count rate of data. |
 |
 |
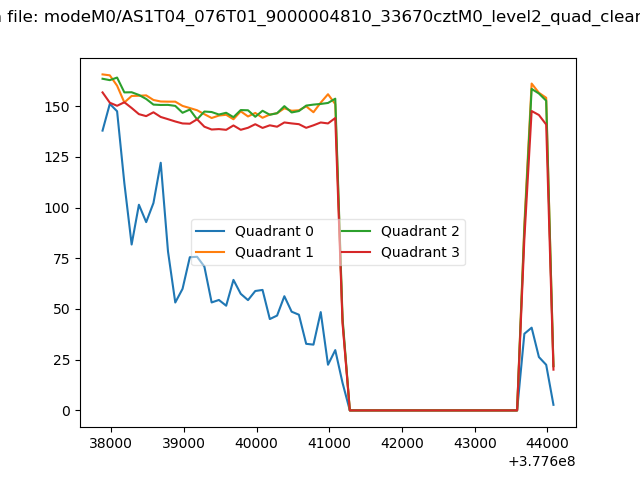
| Quadrant-wise count rates Data is divided into 100 sec bins |
 |
|
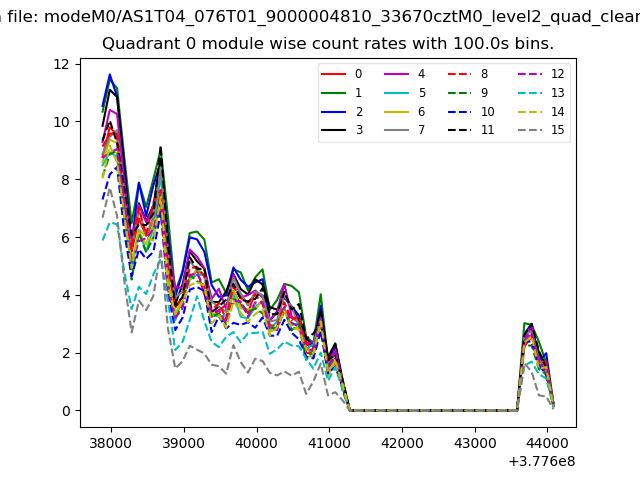
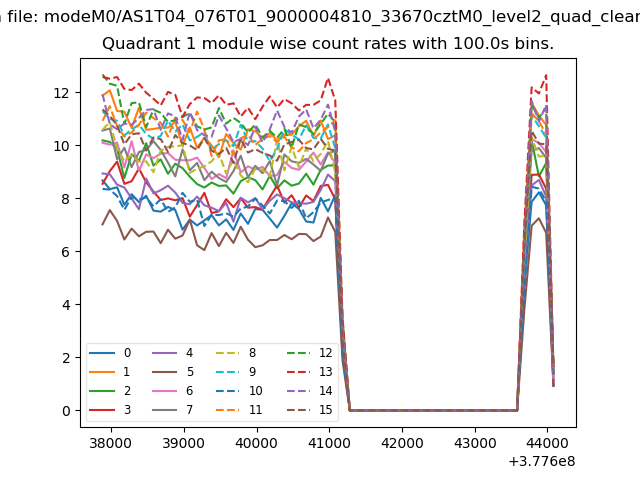
| Module-wise count rates for Quadrant A Data is divided into 100 sec bins |
 |
 |
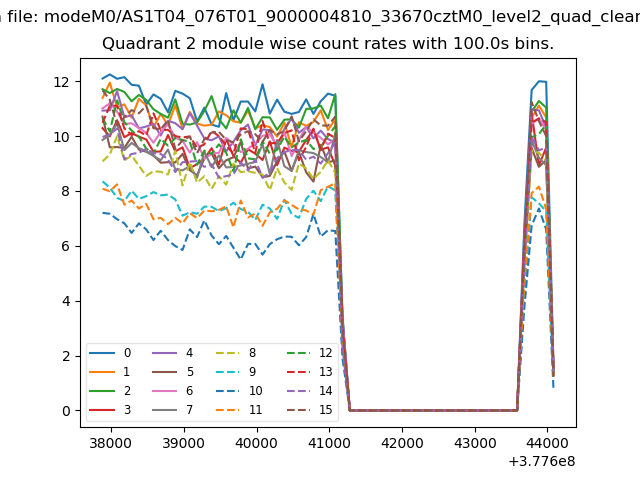
| Module-wise count rates for Quadrant B Data is divided into 100 sec bins |
 |
 |
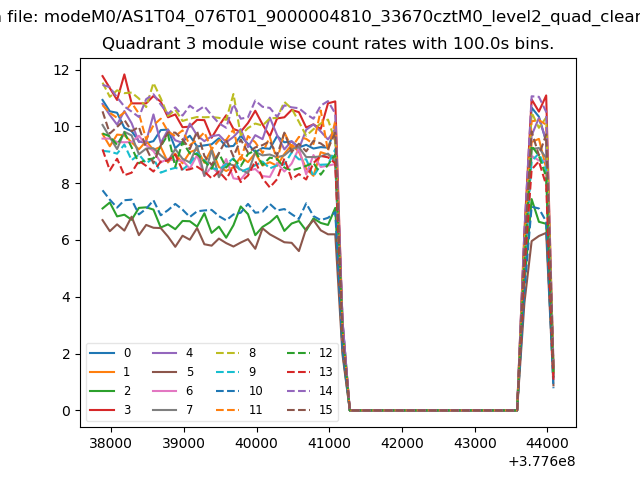
| Module-wise count rates for Quadrant C Data is divided into 100 sec bins |
 |
 |
| Module-wise count rates for Quadrant D Data is divided into 100 sec bins |
 |
 |
| Parameter | Plot |
|---|---|
| CZT HV Monitor | 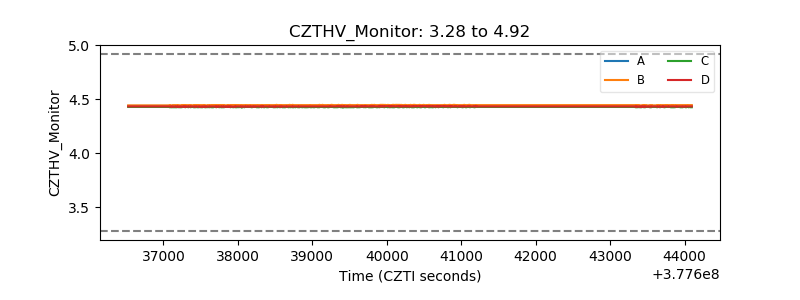 |
| D_VDD | 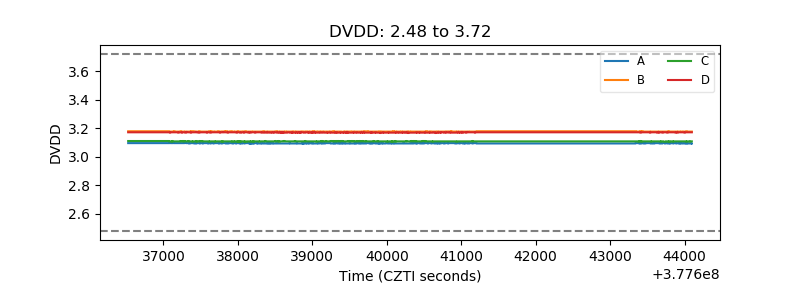 |
| Temperature 1 | 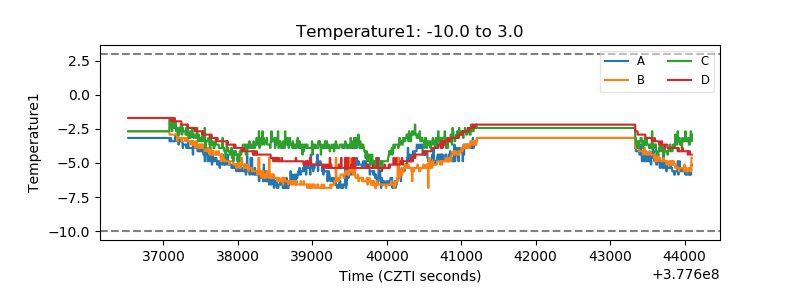 |
| Veto HV Monitor |  |
| Veto LLD | 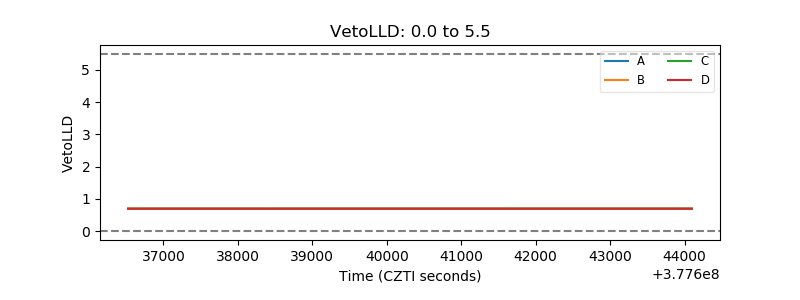 |
| Alpha Counter | 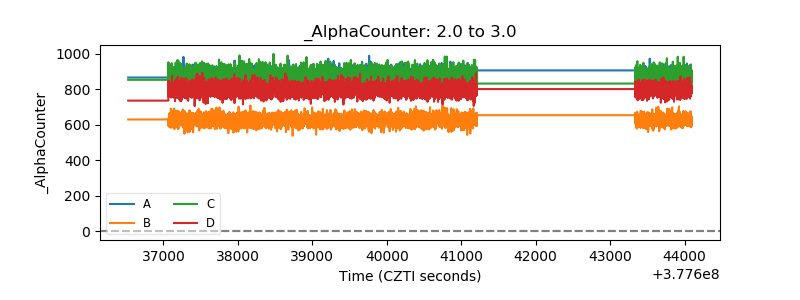 |
| _CPM_Rate | 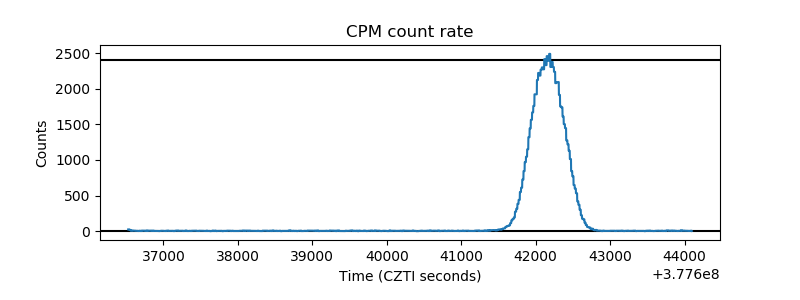 |
| CZT Counter | 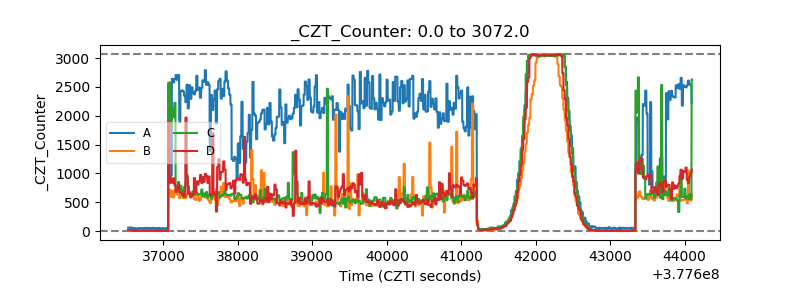 |
| +2.5 Volts monitor |  |
| +5 Volts monitor |  |
| _ROLL_ROT | 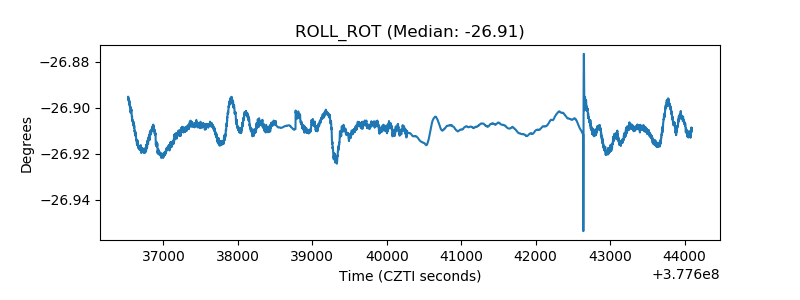 |
| _Roll_DEC | 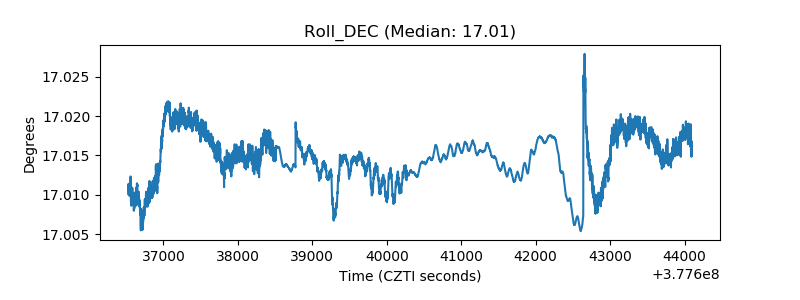 |
| _Roll_RA | 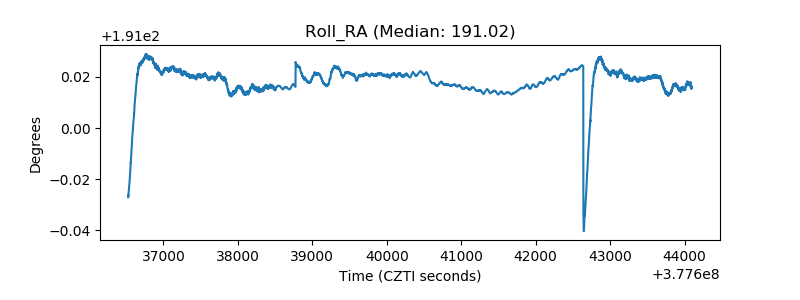 |
| Veto Counter | 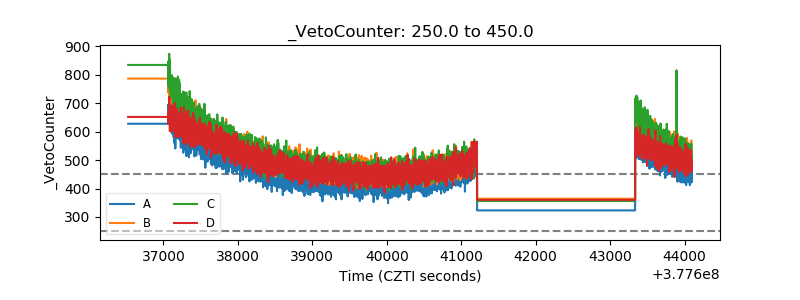 |